概要
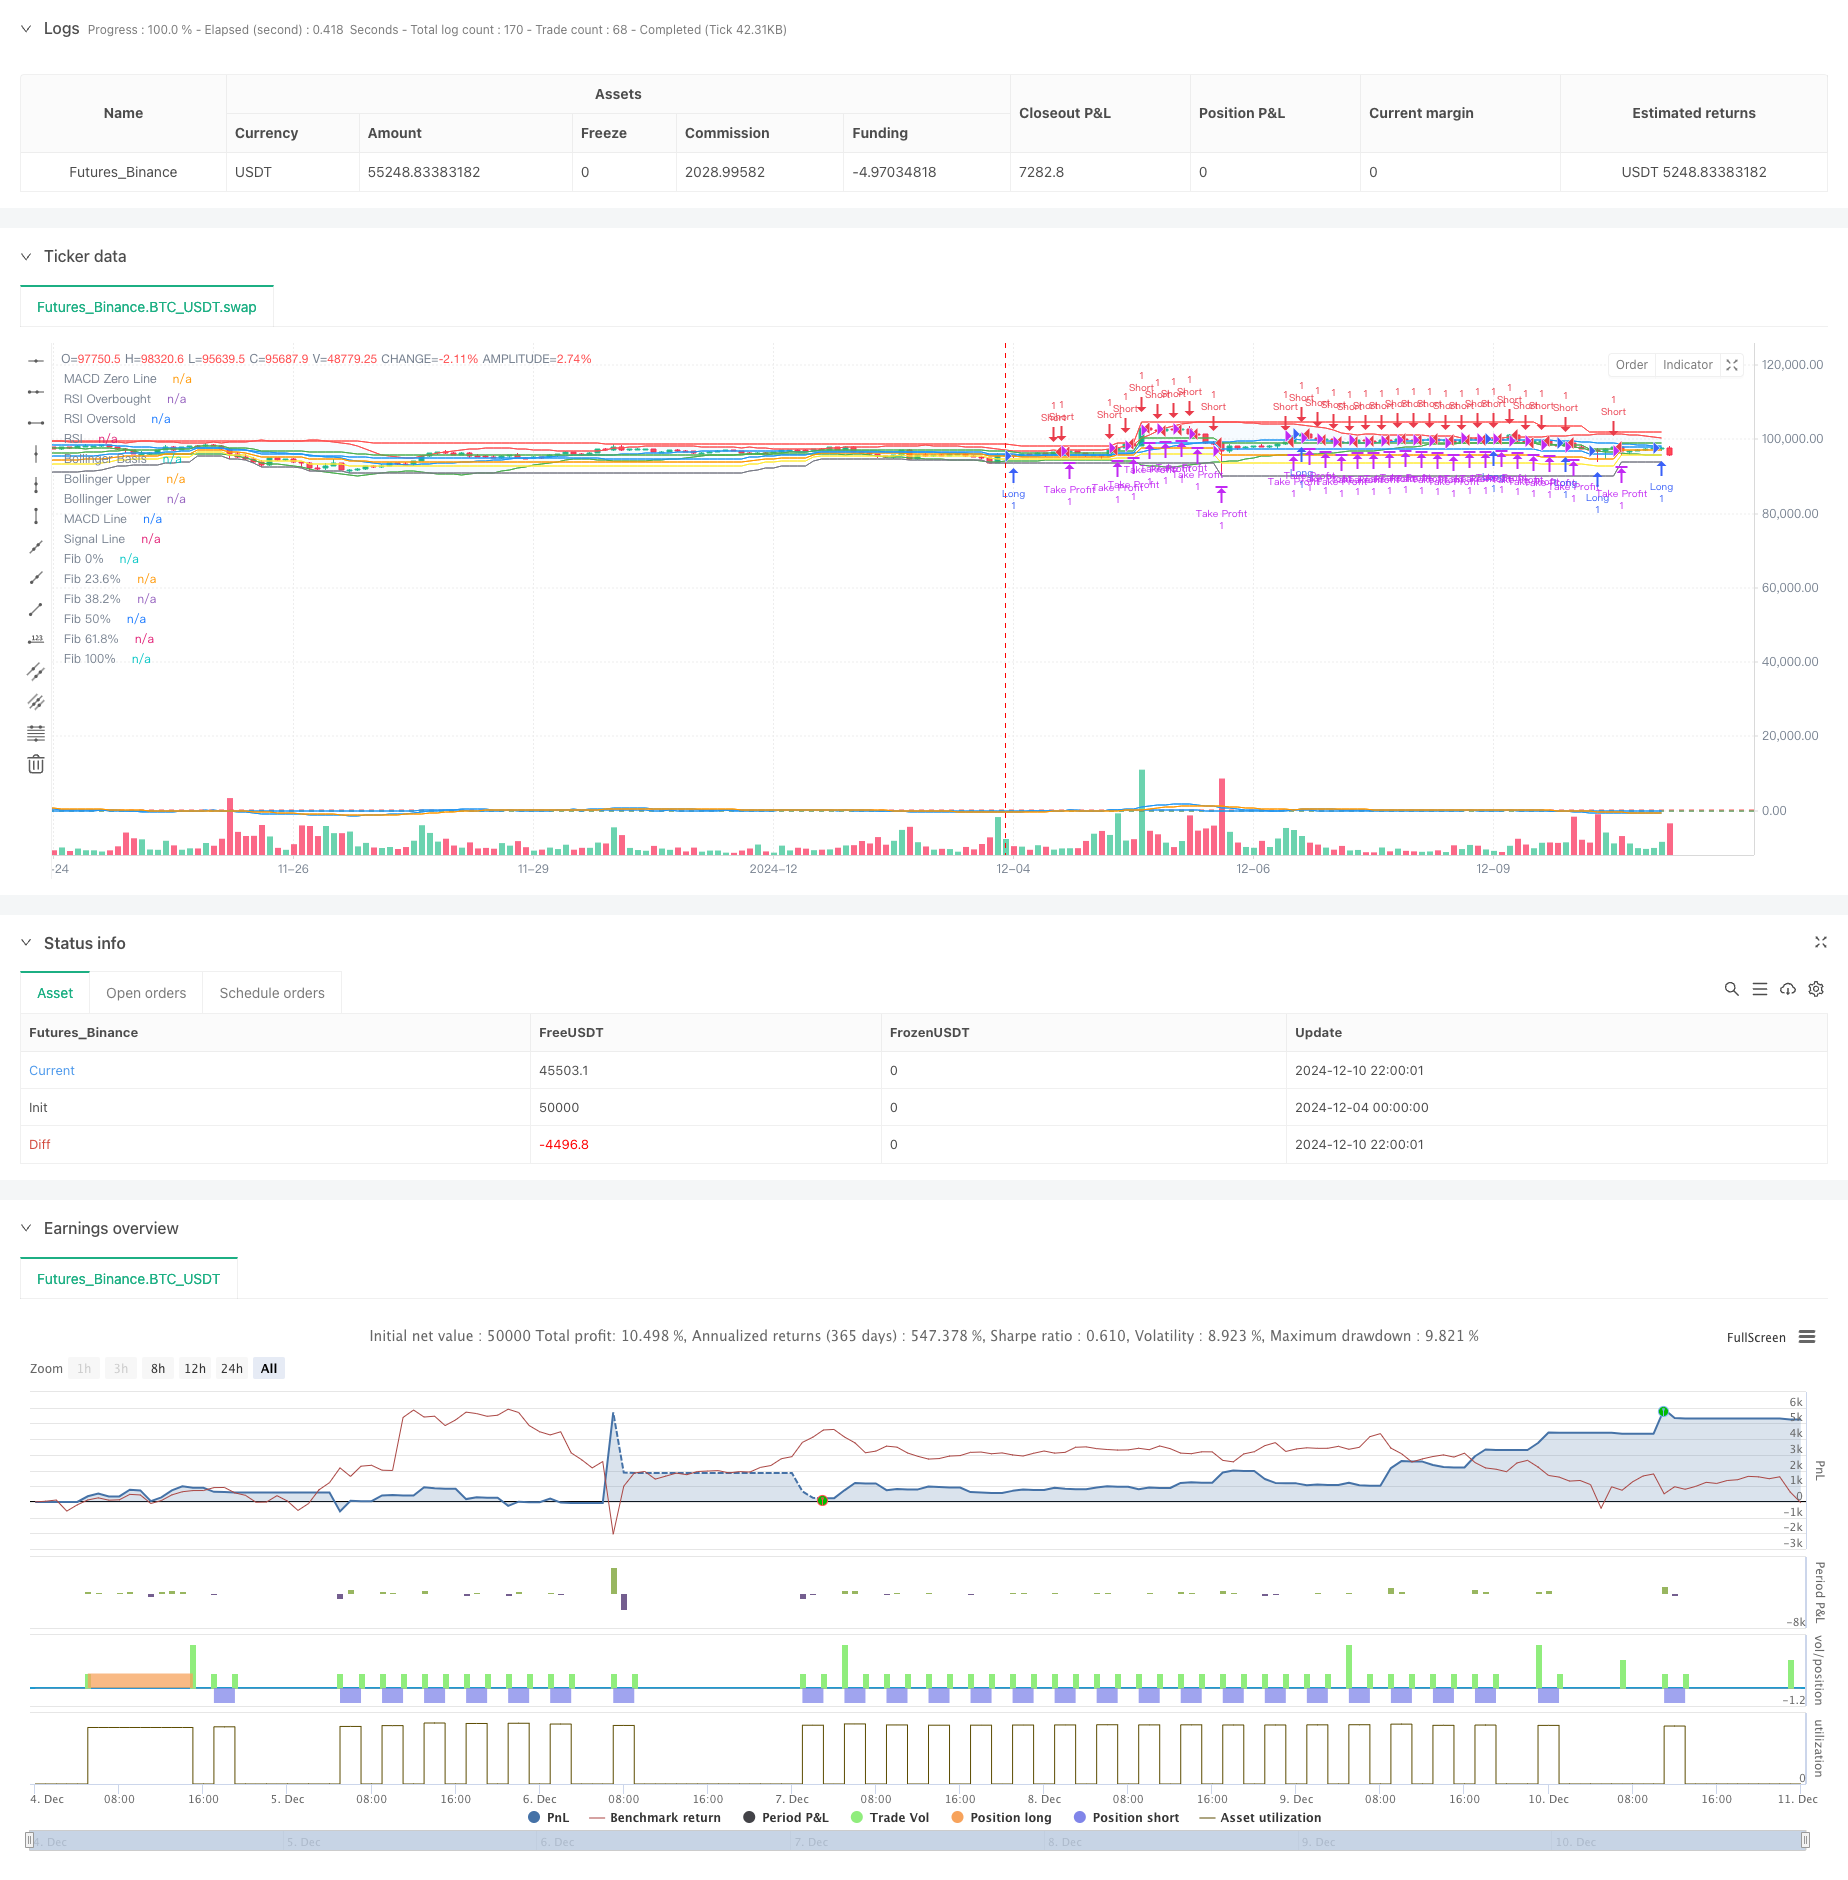
この戦略は,ブリン帯,フィボナッチ・リトロール,MACD,RSIなどの複数の技術指標を組み合わせた総合的な取引システムである. 戦略は,複数の指標の協調により,異なる市場条件下で取引機会を捉え,最大利益の止まりの方法を適用してリスク管理を行う. システムは,モジュール化された設計を採用し,各指標のパラメータは柔軟に調整され,強力な適応性と実用性を持っています.
戦略原則
この戦略は,次の4つの主要な技術指標を用いて取引シグナルを生成します.
- ブリン帯シグナル:価格の下線突破は多行シグナルを生じ,上線突破は空調シグナルを生じ
- フィボナッチシグナル:価格が0-23.6%の範囲で多値シグナルを生じ, 61.8-100%の範囲で空値シグナルを生じ
- MACD信号:MACD線上の穿越信号線は多信号を生じ,下穿越は空白信号を生じ
- RSIシグナル:RSIは,超売りラインより低い値で多売りシグナルを生じ,超買いラインより高い値で空売りシグナルを生じ 任意の指標が信号を生じると,システムは取引を開始する.同時に,戦略は最大利益のストップストップ方法を適用し,既定の利益目標に達した場合またはストップ損失を触発した場合に自動的に平仓する.
戦略的優位性
- 複数の技術指標を統合して信号の信頼性を向上させる
- 柔軟性:各指標のパラメータは,異なる市場状況に応じて柔軟に調整できます
- リスク管理の改善:最大利益ストップと固定ストップの組み合わせ
- 適応性:戦略は市場サイクルや変動条件に適応できる
- 実行効率が高い:コードの構造が明確で,動作負荷は適度である
戦略リスク
- シグナル重複:複数の指標が同時にシグナルを発信すると,過剰取引が起こりうる
- パラメータに敏感:異なるパラメータの組み合わせは,著しく異なる効果を生む可能性があります.
- 市場適応性:特定の市場条件下では不十分である可能性
- スライドポイントの影響:ハイフロー取引はスライドポイントの影響を受ける
- 資金管理:リスクをコントロールするために,合理的なポジションを設定する必要があります.
戦略最適化の方向性
- 信号重量:異なる指標の重量設定により,信号の質を向上させる
- 市場環境認識:市場環境認識モジュールを追加し,異なる市場に応じて戦略を調整する
- 動的パラメータ:自適性パラメータ調整メカニズムを導入
- 取引コスト:コストを削減するために取引頻度を最適化
- シグナルフィルタリング:追加のフィルタリング条件を加え誤信号を減らす
要約する
この戦略は,複数の指標の協調により,戦略の安定性を保証しながら,取引効率を高めます.ある程度のリスクがあるにもかかわらず,合理的なリスク管理と継続的な最適化により,戦略は優れた実用価値を持っています.実物取引の前に十分な反測とパラメータの最適化を行うことが推奨されています.
ストラテジーソースコード
/*backtest
start: 2024-12-04 00:00:00
end: 2024-12-11 00:00:00
period: 2h
basePeriod: 2h
exchanges: [{"eid":"Futures_Binance","currency":"BTC_USDT"}]
*/

//@version=5
strategy("Demo GPT Bollinger, Fibonacci, MACD & RSI with Max Profit Exit", overlay=true)

// === User Inputs for Bollinger Bands ===
length_bb = input.int(20, minval=1, title="Bollinger Bands Length")
maType_bb = input.string("SMA", title="Bollinger Bands MA Type", options=["SMA", "EMA", "SMMA (RMA)", "WMA", "VWMA"])
src_bb = input(close, title="Bollinger Bands Source")
mult_bb = input.float(2.0, minval=0.001, maxval=50, title="Bollinger Bands StdDev")
offset_bb = input.int(0, title="Bollinger Bands Offset", minval=-500, maxval=500)

// === User Inputs for Fibonacci Levels ===
lookback_fib = input.int(50, minval=1, title="Fibonacci Lookback Period")

// === User Inputs for MACD ===
macd_fast = input.int(12, minval=1, title="MACD Fast Length")
macd_slow = input.int(26, minval=1, title="MACD Slow Length")
macd_signal = input.int(9, minval=1, title="MACD Signal Length")

// === User Inputs for RSI ===
rsi_length = input.int(14, title="RSI Length")
rsi_overbought = input.int(70, title="RSI Overbought Level")
rsi_oversold = input.int(30, title="RSI Oversold Level")

// === Start and End Date Inputs ===
start_date = input(timestamp("2023-01-01 00:00:00"), title="Start Date")
end_date = input(timestamp("2069-12-31 23:59:59"), title="End Date")

// === Moving Average Function ===
ma(source, length, _type) =>
    switch _type
        "SMA" => ta.sma(source, length)
        "EMA" => ta.ema(source, length)
        "SMMA (RMA)" => ta.rma(source, length)
        "WMA" => ta.wma(source, length)
        "VWMA" => ta.vwma(source, length)

// === Bollinger Bands Calculation ===
basis_bb = ma(src_bb, length_bb, maType_bb)
dev_bb = mult_bb * ta.stdev(src_bb, length_bb)
upper_bb = basis_bb + dev_bb
lower_bb = basis_bb - dev_bb

// === Fibonacci Levels Calculation ===
highest_price = ta.highest(high, lookback_fib)
lowest_price = ta.lowest(low, lookback_fib)

fib_0 = lowest_price
fib_23 = lowest_price + 0.236 * (highest_price - lowest_price)
fib_38 = lowest_price + 0.382 * (highest_price - lowest_price)
fib_50 = lowest_price + 0.5 * (highest_price - lowest_price)
fib_61 = lowest_price + 0.618 * (highest_price - lowest_price)
fib_100 = highest_price

// === MACD Calculation ===
[macd_line, signal_line, _] = ta.macd(close, macd_fast, macd_slow, macd_signal)

// === RSI Calculation ===
rsi = ta.rsi(close, rsi_length)

// === Plotting for Reference ===
plot(basis_bb, "Bollinger Basis", color=color.blue, offset=offset_bb)
p1_bb = plot(upper_bb, "Bollinger Upper", color=color.red, offset=offset_bb)
p2_bb = plot(lower_bb, "Bollinger Lower", color=color.green, offset=offset_bb)
fill(p1_bb, p2_bb, title="Bollinger Bands Background", color=color.rgb(33, 150, 243, 95))

plot(fib_0, "Fib 0%", color=color.gray)
plot(fib_23, "Fib 23.6%", color=color.yellow)
plot(fib_38, "Fib 38.2%", color=color.orange)
plot(fib_50, "Fib 50%", color=color.blue)
plot(fib_61, "Fib 61.8%", color=color.green)
plot(fib_100, "Fib 100%", color=color.red)

hline(0, "MACD Zero Line", color=color.gray)
plot(macd_line, "MACD Line", color=color.blue)
plot(signal_line, "Signal Line", color=color.orange)

hline(rsi_overbought, "RSI Overbought", color=color.red)
hline(rsi_oversold, "RSI Oversold", color=color.green)
plot(rsi, "RSI", color=color.blue)

// === Combined Trading Logic ===
// Bollinger Bands Signals
long_bb = ta.crossover(close, lower_bb)
short_bb = ta.crossunder(close, upper_bb)

// Fibonacci Signals
long_fib = close <= fib_23 and close >= fib_0
short_fib = close >= fib_61 and close <= fib_100

// MACD Signals
long_macd = ta.crossover(macd_line, signal_line)
short_macd = ta.crossunder(macd_line, signal_line)

// RSI Signals
long_rsi = rsi < rsi_oversold
short_rsi = rsi > rsi_overbought

// Combined Long and Short Conditions
long_condition = (long_bb or long_fib or long_macd or long_rsi)
short_condition = (short_bb or short_fib or short_macd or short_rsi)
// === Max Profit Exit Logic ===
// Define the maximum profit exit percentage
take_profit_percentage = input.float(5.0, title="Take Profit (%)", minval=0.1, maxval=100) / 100
stop_loss_percentage = input.float(2.0, title="Stop Loss (%)", minval=0.1, maxval=100) / 100

// Track the highest price during the trade
var float max_profit_price = na
if (strategy.opentrades > 0)
    max_profit_price := na(max_profit_price) ? strategy.opentrades.entry_price(0) : math.max(max_profit_price, high)

// Calculate the take profit and stop loss levels based on the max profit price
take_profit_level = max_profit_price * (1 + take_profit_percentage)
stop_loss_level = max_profit_price * (1 - stop_loss_percentage)

// Exit the trade if the take profit or stop loss level is hit
if (strategy.opentrades > 0)
    if (close >= take_profit_level)
        strategy.exit("Take Profit", from_entry="Long", limit=take_profit_level)
    if (close <= stop_loss_level)
        strategy.exit("Stop Loss", from_entry="Long", stop=stop_loss_level)

if (strategy.opentrades > 0)
    if (close <= take_profit_level)
        strategy.exit("Take Profit", from_entry="Short", limit=take_profit_level)
    if (close >= stop_loss_level)
        strategy.exit("Stop Loss", from_entry="Short", stop=stop_loss_level)

// === Execute Trades ===
if (long_condition)
    strategy.entry("Long", strategy.long, when=not na(long_condition))

if (short_condition)
    strategy.entry("Short", strategy.short, when=not na(short_condition))