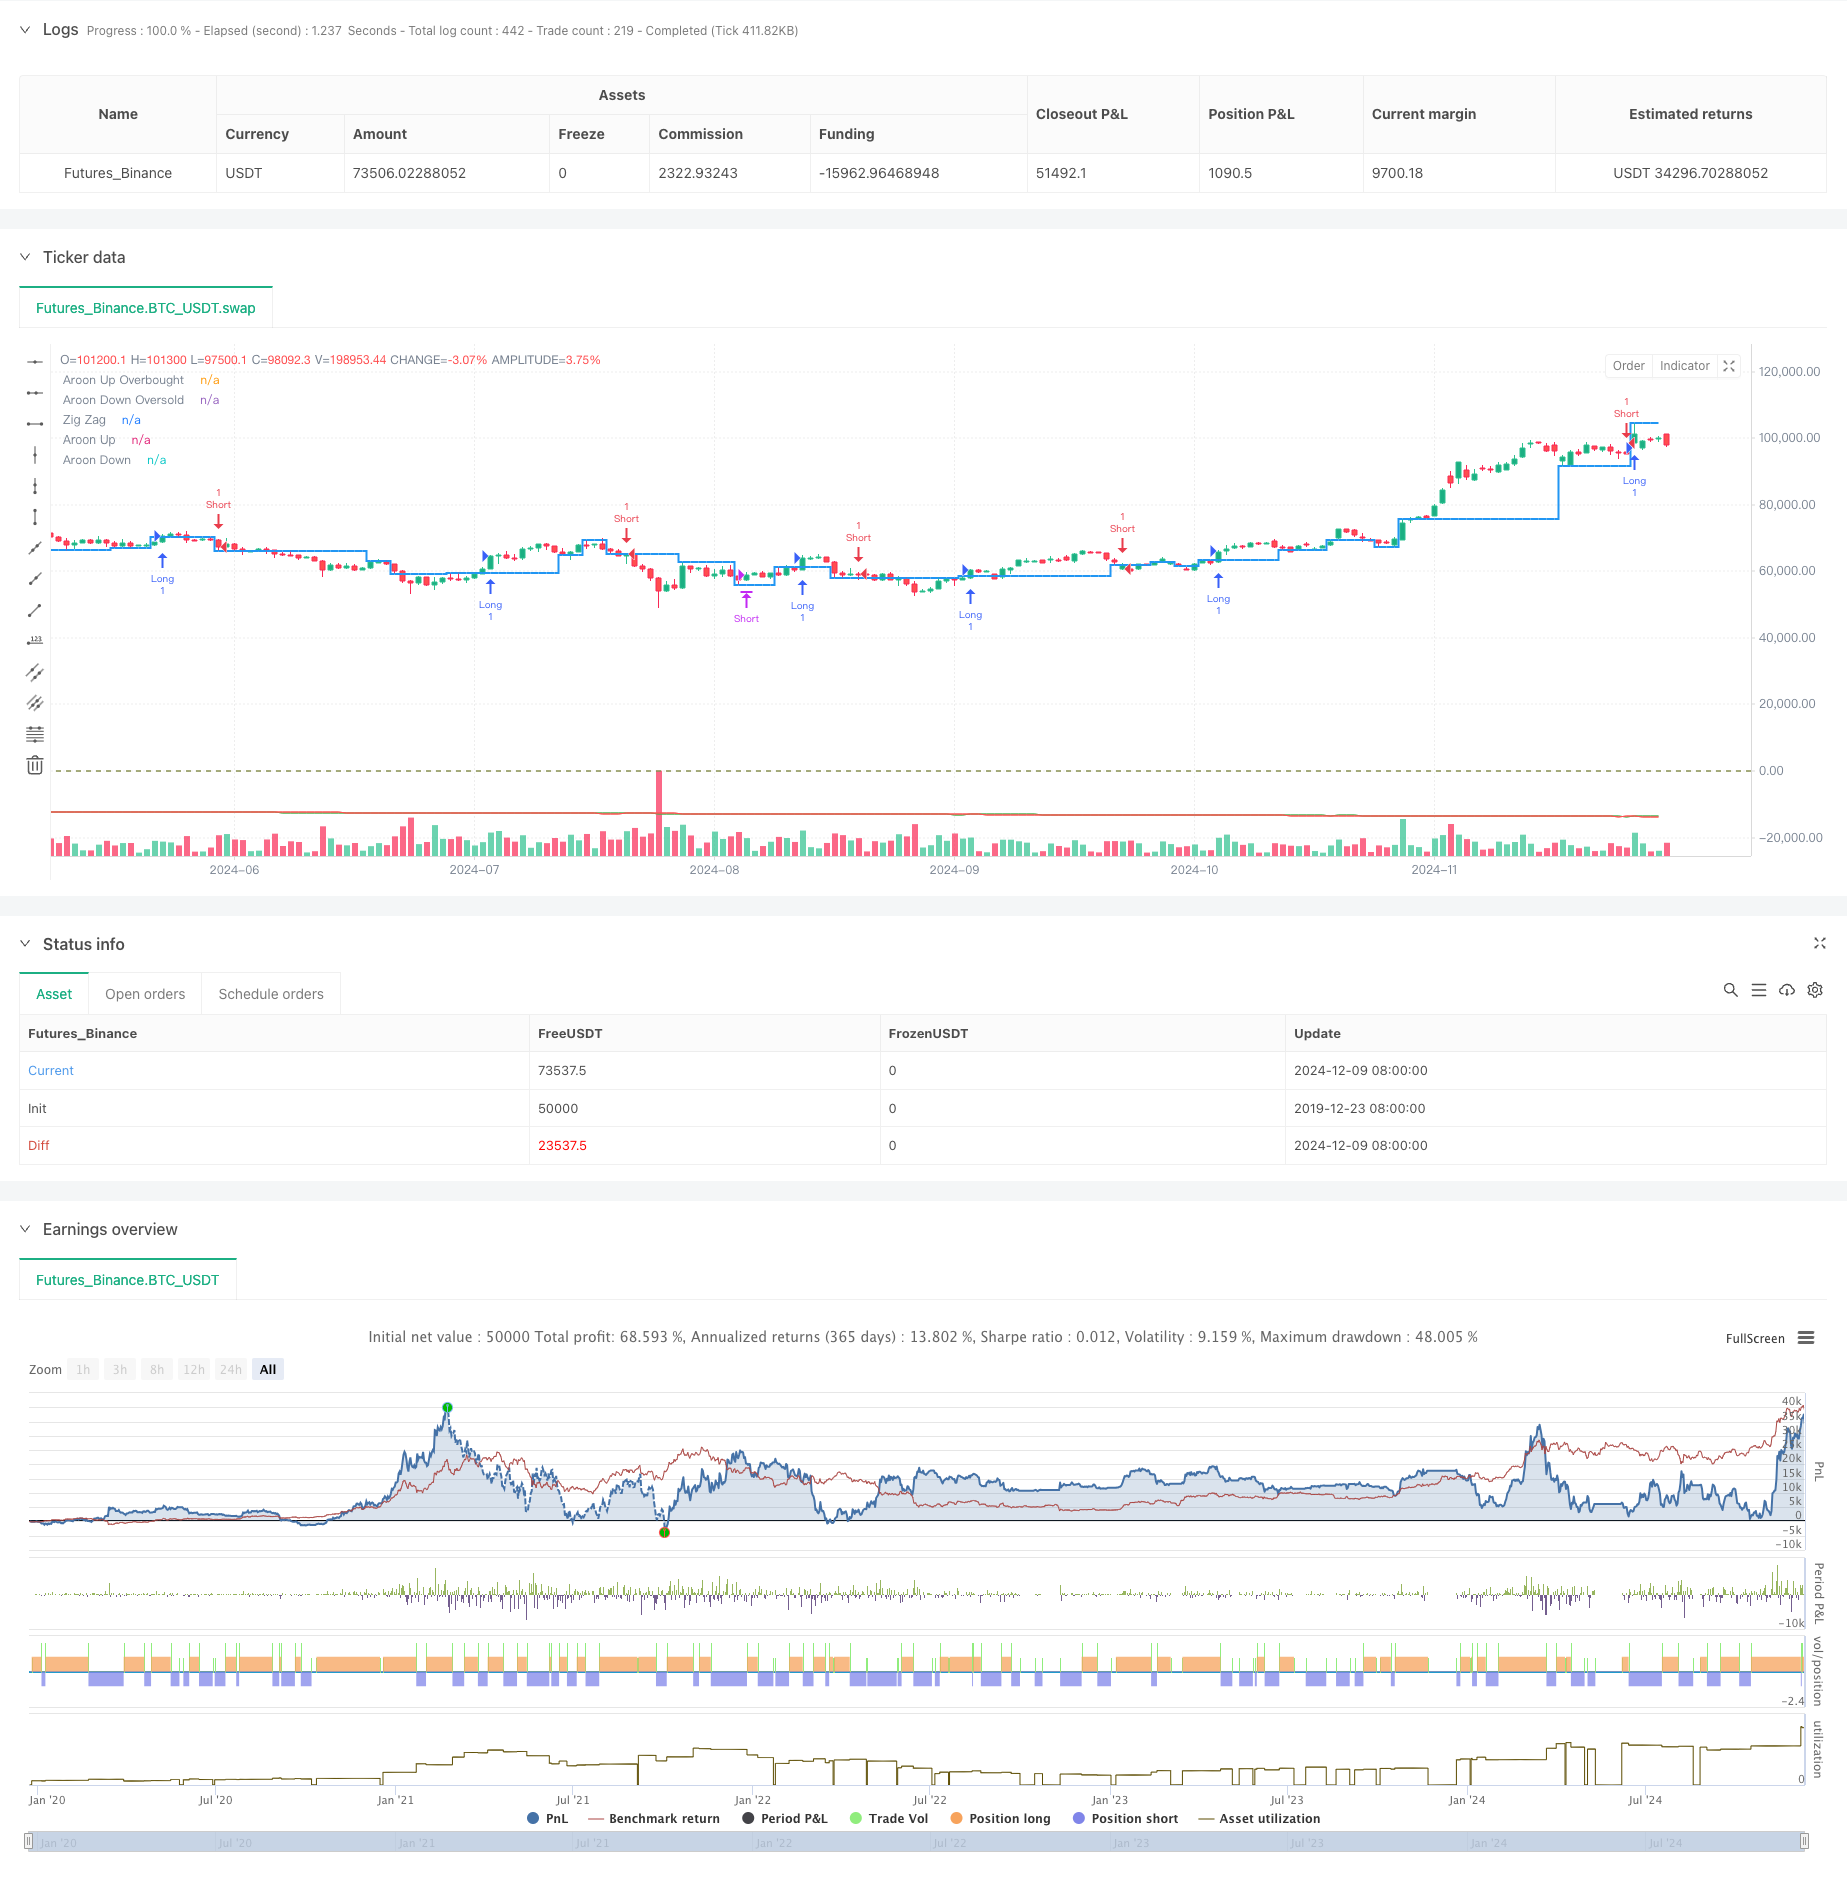
適応型トレンド追跡および反転識別戦略: ZigZag および Aroon 指標に基づく定量取引システム
作成日:
2024-12-12 17:21:41
最終変更日:
2024-12-12 17:21:41
コピー:
0
クリック数:
496
1
フォロー
1627
フォロワー

概要
この戦略は,ZigZag指標とAroon指標を組み合わせた自己適応的取引システムである. ZigZag指標は,市場のノイズをフィルタリングし,重要な価格変動を識別し,Aroon指標は,トレンドの強さや潜在的な逆転点を確認するために使用される. 戦略は,この2つの指標の協調的な配合によって,トレンドに敏感であると同時に,市場の転換点をタイムリーに捉えることができる.
戦略原則
戦略の中核となるロジックは、次の主要な要素に基づいています。
- ZigZag指標は,深さパラメータ ((zigzagDepth) を設定して短期的な変動をフィルターし,統計的に有意な価格変動のみを保持する.
- Aroon指標は,最高値と最低値の出現の時間間隔を計算して,Aroon UpとAroon Downの2つの線を生成する.
- 入力信号は2つの条件によって引き起こされる.
- Aroon UpはAroon Downを突破し,ZigZagが上昇傾向を示している間,多ポジションを開設しました.
- Aroon DownがAroon Upを突破し,ZigZagが下落傾向を示している間,空白のポジションを開きます.
- アルーン指数の交差によって発射される出力信号は,
- Aroon Downの多仓は,Aroon Upの平仓を突破する
- 空倉はAroon Upの上でAroon Downを横断する際に平仓
戦略的優位性
- 双重確認の仕組みは取引の信頼性を高め,偽の信号を減少させます.
- ZigZagの指標の使用は,市場騒音の影響を効果的に軽減しました.
- Aroonの指標は,トレンドの強さの定量的な尺度を提供する.
- 戦略は適応性があり,異なる市場環境で調整することができます.
- リスクの管理に役立つ出場メカニズムが明確です.
戦略リスク
- 波動的な市場では,頻繁に取引信号が発生し,取引コストが増加する可能性があります.
- ZigZag指標の遅滞により,入場時間が少し遅れる可能性があります.
- パラメータの選択は,戦略のパフォーマンスに大きな影響を及ぼします.
- 急速な逆転の状況では,より大きな後退が起こりうる.
戦略最適化の方向性
- 波動率指標を導入し,市場の波動に応じてパラメータを調整する.
- 取引量指標を追加して確認する
- ストップ・メカニズムを最適化し,移動ストップに加える.
- 市場環境の分類を考慮し,異なる市場環境で異なるパラメータの組み合わせを使用する.
- ポジション管理システムを導入し,信号の強度に応じてポジションのサイズを調整する.
要約する
この戦略は,ZigZagとAroonの指標を組み合わせて,比較的完全なトレンド追跡システムを構築している.戦略の優点は,自律的適応性と二重確認の仕組みにあるが,同時に,パラメータ選択と市場環境が戦略のパフォーマンスに与える影響にも注意する必要がある.継続的な最適化と改善により,この戦略は実際の取引で安定したパフォーマンスを期待している.
ストラテジーソースコード
/*backtest
start: 2019-12-23 08:00:00
end: 2024-12-10 08:00:00
period: 1d
basePeriod: 1d
exchanges: [{"eid":"Futures_Binance","currency":"BTC_USDT"}]
*/

//@version=5
strategy("Zig Zag + Aroon Strategy", overlay=true)

// Zig Zag parameters
zigzagDepth = input(5, title="Zig Zag Depth")

// Aroon parameters
aroonLength = input(14, title="Aroon Length")

// Zig Zag logic
var float lastZigZag = na
var float lastZigZagHigh = na
var float lastZigZagLow = na
var int direction = 0  // 1 for up, -1 for down

// Calculate Zig Zag
if (not na(high) and high >= ta.highest(high, zigzagDepth) and direction != 1)
    lastZigZag := high
    lastZigZagHigh := high
    direction := 1
if (not na(low) and low <= ta.lowest(low, zigzagDepth) and direction != -1)
    lastZigZag := low
    lastZigZagLow := low
    direction := -1

// Aroon calculation
highestHigh = ta.highest(high, aroonLength)
lowestLow = ta.lowest(low, aroonLength)
aroonUp = (aroonLength - (bar_index - ta.highestbars(high, aroonLength))) / aroonLength * 100
aroonDown = (aroonLength - (bar_index - ta.lowestbars(low, aroonLength))) / aroonLength * 100

// Long entry condition
longCondition = (ta.crossover(aroonUp, aroonDown)) and (lastZigZag == lastZigZagHigh)
if (longCondition)
    strategy.entry("Long", strategy.long)

// Short entry condition
shortCondition = (ta.crossover(aroonDown, aroonUp)) and (lastZigZag == lastZigZagLow)
if (shortCondition)
    strategy.entry("Short", strategy.short)

// Exit conditions
if (ta.crossover(aroonDown, aroonUp) and strategy.position_size > 0)
    strategy.close("Long")

if (ta.crossover(aroonUp, aroonDown) and strategy.position_size < 0)
    strategy.close("Short")

// Plot Zig Zag
plot(lastZigZag, color=color.blue, title="Zig Zag", linewidth=2, style=plot.style_stepline)

// Plot Aroon
hline(70, "Aroon Up Overbought", color=color.red)
hline(30, "Aroon Down Oversold", color=color.green)
plot(aroonUp, color=color.green, title="Aroon Up")
plot(aroonDown, color=color.red, title="Aroon Down")