サポートブレイクに基づく戦略をフォローする動的ATR傾向
作者: リン・ハーンチャオチャン開催日:2024年12月12日17時26分タグ:ATRエイマSMC

概要
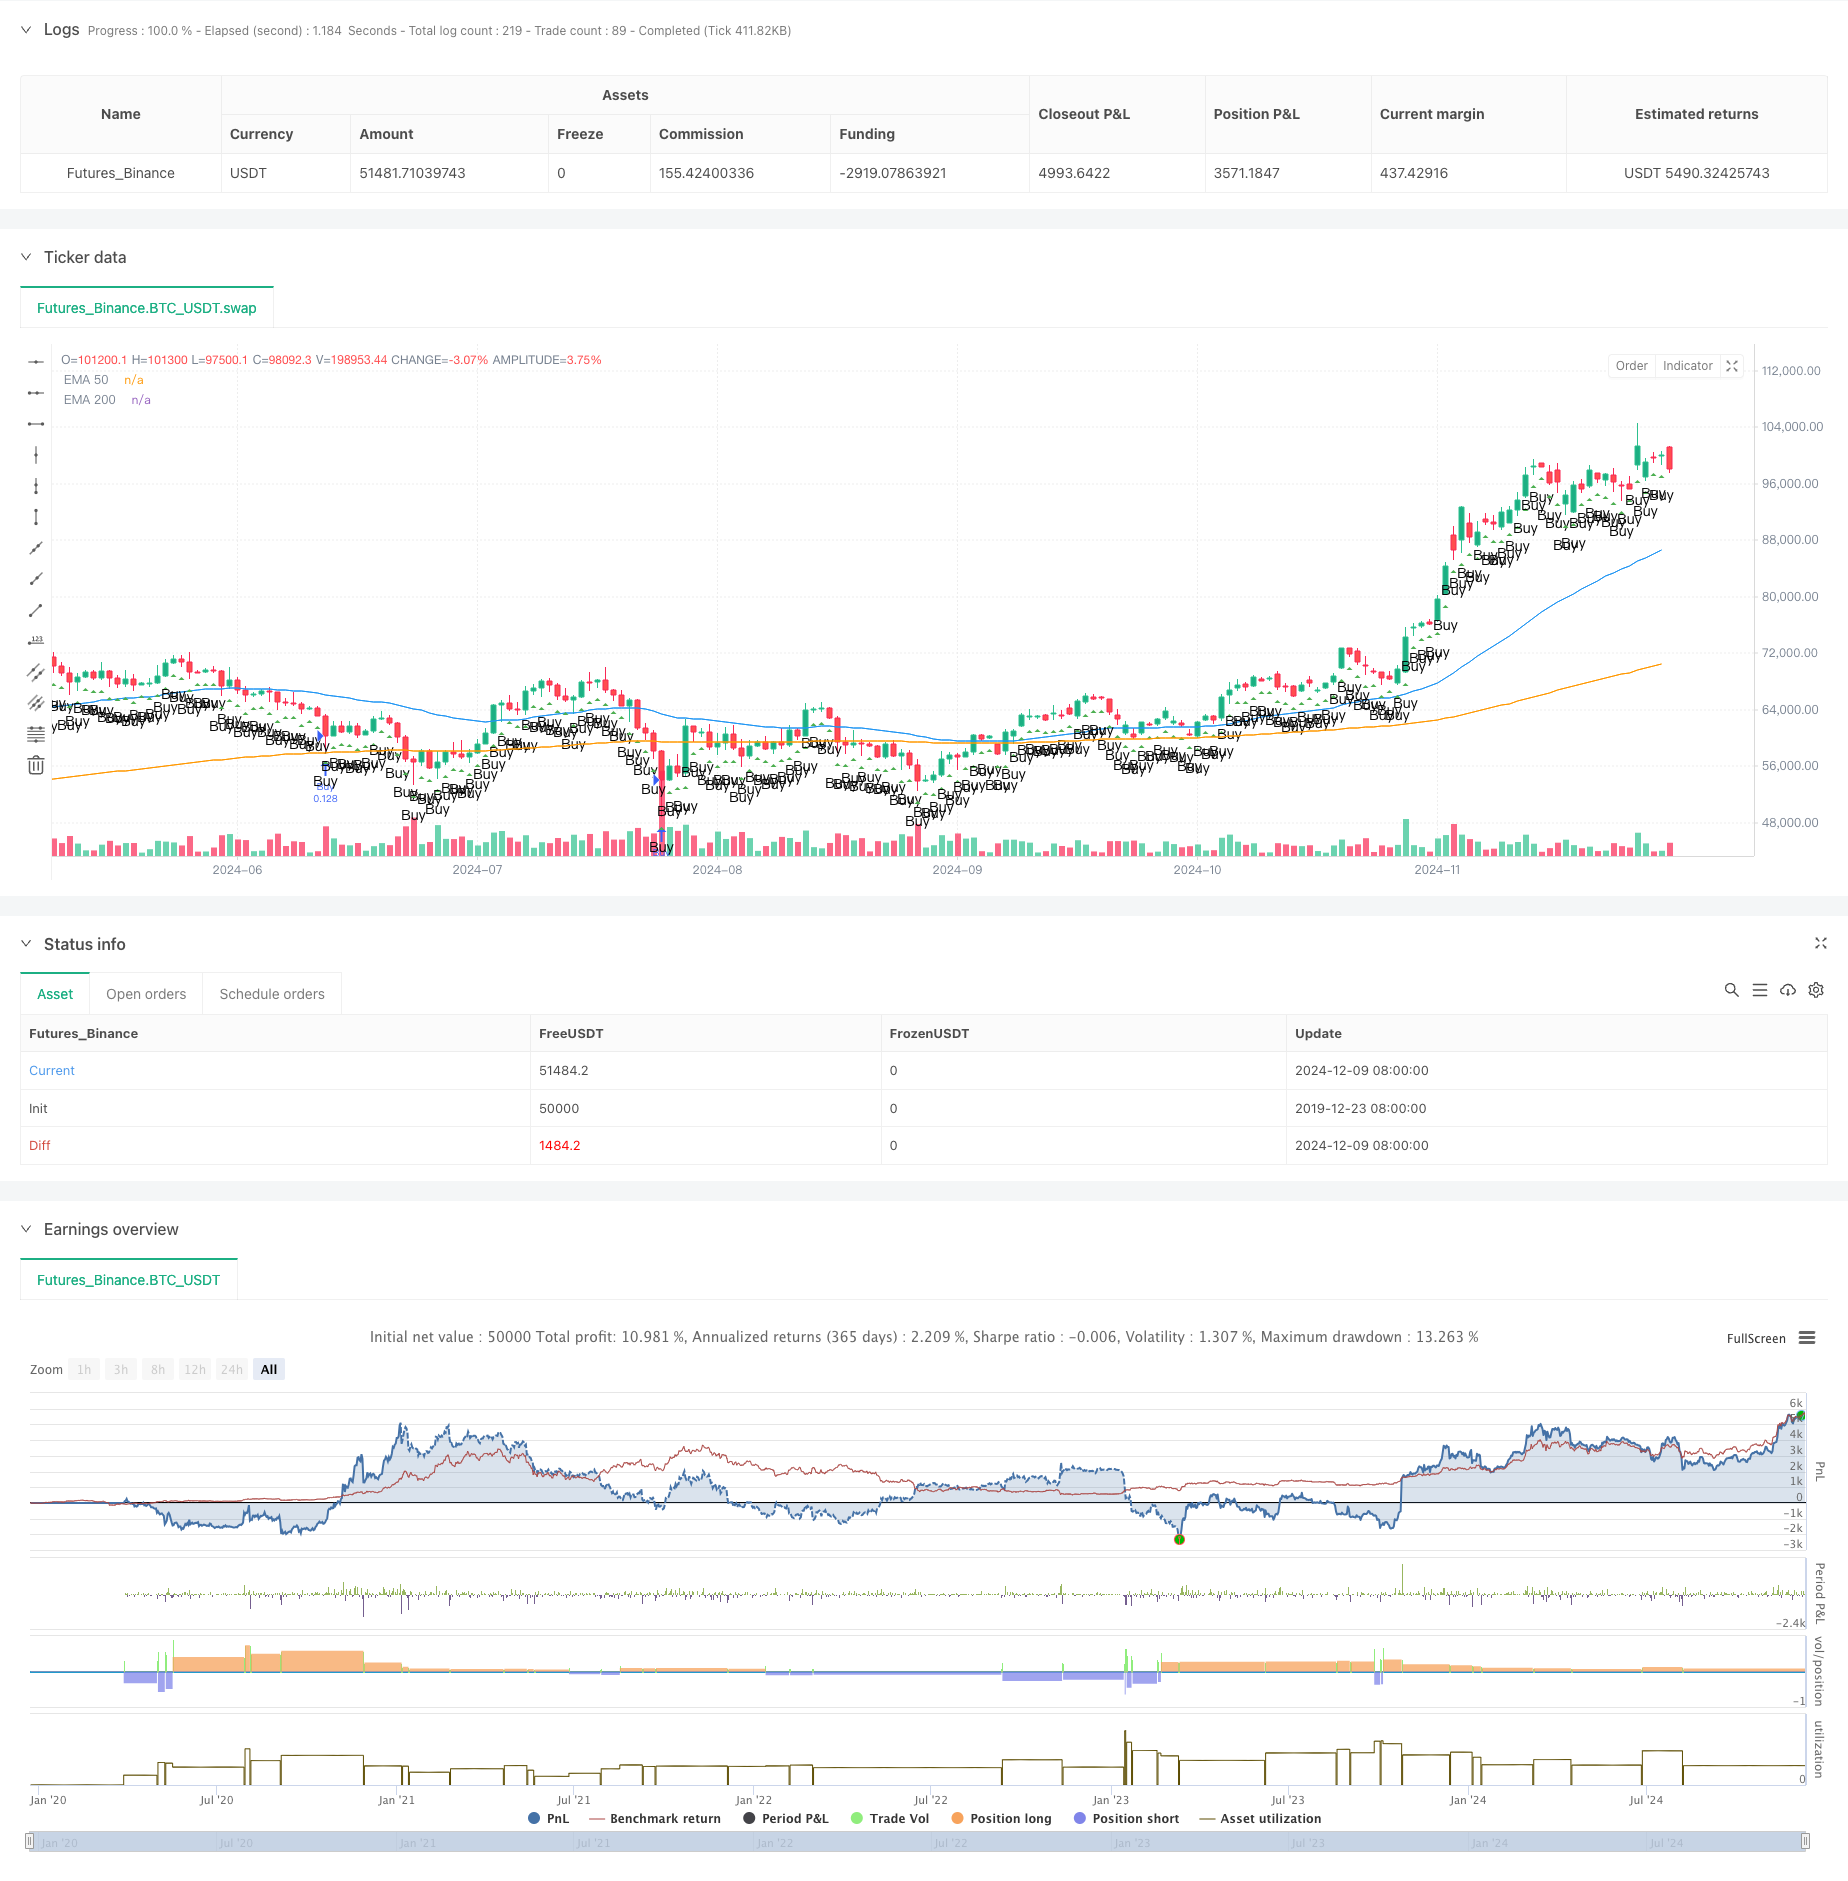
これはサポートブレイクアウトに基づく戦略をフォローする動的ATRトレンドである.この戦略は,市場動向を把握するためにEMAシステム,ATR波動性指標,およびスマートマネーコンセプト (SMC) を組み込む.動的なポジションサイズ化とストップ・ロス/テイク・プロフィート配置を通じて効果的なリスク管理を達成する.
戦略原則
戦略はいくつかの主要な要素に基づいています. 市場傾向の方向性を確認するために50期と200期EMAシステムを使用する. 2. ストップ・ロストと利益目標を動的に調整するためにATR指標を使用します. 3. オーダーブロックと不均衡ゾーンを分析し,最適なエントリーポイントを見つけます 4. 口座リスクパーセントに基づいてポジションサイズを自動的に計算します. 5. 最後の20のキャンドルの価格範囲を観察することによって市場統合を決定します
戦略 の 利点
- ダイナミックな計算による包括的なリスク管理
- 統合市場を回避する信頼性の高い傾向識別システム
- 合理的なストップ・ロストとテイク・プロフィート設定で,リスク・リターン比は1:3
- 異なる市場状況にうまく適応する
- 維持し最適化しやすい明確なコード構造
戦略リスク
- EMA指標は欠陥があるため,エントリーポイントを遅らせる可能性がある.
- 高波動性のある市場で誤った信号を生む可能性があります
- 戦略は,トレンドの継続に依存し,様々な市場で劣る可能性があります.
- 幅広くストップ・ロスを設定する場合は,特定の状況でより大きな損失をもたらす可能性があります.
オプティマイゼーションの方向性
- トレンドの特定を改善するために,物量価格関係分析を組み込む
- 入場タイミングを最適化するために市場情勢指標を追加する
- システムの安定性を高めるため,複数のタイムフレーム分析を検討する
- オーダーブロックと不均衡ゾーンの識別基準を精査する
- ストップ・ロスの方法を最適化し,トライリング・ストップの実施を検討する
概要
この戦略は,適切なリスク管理と複数のシグナル確認によって取引安定を達成する包括的なトレンドフォローシステムである.シグナルに一定の遅れがあるにもかかわらず,全体的に信頼性の高い取引システムを表す.実用化する前に徹底的なバックテストを行い,特定の取引ツールと市場状況に応じてパラメータを最適化することが推奨される.
/*backtest
start: 2019-12-23 08:00:00
end: 2024-12-10 08:00:00
period: 1d
basePeriod: 1d
exchanges: [{"eid":"Futures_Binance","currency":"BTC_USDT"}]
*/

// TradingView Pine Script strategy for Smart Money Concept (SMC)
//@version=5
strategy("Smart Money Concept Strategy", overlay=true, default_qty_type=strategy.fixed, default_qty_value=100)

// === Input Parameters ===
input_risk_percentage = input.float(1, title="Risk Percentage", step=0.1)
input_atr_length = input.int(14, title="ATR Length")
input_ema_short = input.int(50, title="EMA Short")
input_ema_long = input.int(200, title="EMA Long")

// === Calculations ===
atr = ta.atr(input_atr_length)
ema_short = ta.ema(close, input_ema_short)
ema_long = ta.ema(close, input_ema_long)

// === Utility Functions ===
// Identify Order Blocks
is_order_block(price, direction) =>
    ((high[1] > high[2] and low[1] > low[2] and direction == 1) or (high[1] < high[2] and low[1] < low[2] and direction == -1))

// Identify Imbalance Zones
is_imbalance() =>
    range_high = high[1]
    range_low = low[1]
    range_high > close and range_low < close

// Calculate Lot Size Based on Risk
calculate_lot_size(stop_loss_points, account_balance) =>
    risk_amount = account_balance * (input_risk_percentage / 100)
    lot_size = risk_amount / (stop_loss_points * syminfo.pointvalue)
    lot_size

// Determine if Market is Consolidating
is_consolidating() =>
    (ta.highest(high, 20) - ta.lowest(low, 20)) / atr < 2

// === Visual Enhancements ===
// Plot Order Blocks
// if is_order_block(close, 1)
//     line.new(x1=bar_index[1], y1=low[1], x2=bar_index, y2=low[1], color=color.green, width=2, extend=extend.right)
// if is_order_block(close, -1)
//     line.new(x1=bar_index[1], y1=high[1], x2=bar_index, y2=high[1], color=color.red, width=2, extend=extend.right)

// Highlight Imbalance Zones
// if is_imbalance()
//     box.new(left=bar_index[1], top=high[1], right=bar_index, bottom=low[1], bgcolor=color.new(color.orange, 80))

// === Logic for Trend Confirmation ===
is_bullish_trend = ema_short > ema_long
is_bearish_trend = ema_short < ema_long

// === Entry Logic ===
account_balance = strategy.equity
if not is_consolidating()
    if is_bullish_trend
        stop_loss = close - atr * 2
        take_profit = close + (math.abs(close - (close - atr * 2)) * 3)
        stop_loss_points = math.abs(close - stop_loss) / syminfo.pointvalue
        lot_size = calculate_lot_size(stop_loss_points, account_balance)
        strategy.entry("Buy", strategy.long, qty=lot_size)
        strategy.exit("TP/SL", "Buy", stop=stop_loss, limit=take_profit)

    if is_bearish_trend
        stop_loss = close + atr * 2
        take_profit = close - (math.abs(close - (close + atr * 2)) * 3)
        stop_loss_points = math.abs(close - stop_loss) / syminfo.pointvalue
        lot_size = calculate_lot_size(stop_loss_points, account_balance)
        strategy.entry("Sell", strategy.short, qty=lot_size)
        strategy.exit("TP/SL", "Sell", stop=stop_loss, limit=take_profit)

// === Plotting Indicators ===
plot(ema_short, color=color.blue, title="EMA 50")
plot(ema_long, color=color.orange, title="EMA 200")
plotshape(series=is_bullish_trend and not is_consolidating(), style=shape.triangleup, location=location.belowbar, color=color.green, text="Buy")
plotshape(series=is_bearish_trend and not is_consolidating(), style=shape.triangledown, location=location.abovebar, color=color.red, text="Sell")
関連性
- 強化された多指標モメンタム取引戦略
- 動的チャネルと移動平均取引システムによる多指標トレンドフォロー戦略
- K 連続キャンドル ブール・ベア戦略
- 波動性と線形回帰に基づく長期短期市場体制最適化戦略
- オシレーターとダイナミックサポート/レジスタンスの取引戦略を持つマルチEMAクロス
- ケルトナー・チャネルズ EMA ATR戦略
- SMCとEMAの戦略とP&L予測
- ATR と EMA をベースとした動的取利益とストップ損失適応戦略
- 取引戦略をフォローする EMA ダイナミック・トレンド
- トリプルEMAクロスオーバー戦略
もっと
- 二重モメンタム突破確認量的な取引戦略
- MACD-RSI トレンド・モメンタム・クロス戦略とリスクマネジメントモデル
- RSIモメンタムとATR波動性に基づくトレンドを伴う多期EMAクロスオーバー
- 賢明なリスク・リターン制御の EMA 相互運用戦略
- 戦略をフォローする多動平均傾向 - EMAとSMA指標に基づく長期投資シグナルシステム
- 戦略をフォローする月間移動平均フィルタートレンドと歴史的な高い突破
- 多均衡価格動向の追跡と逆転取引戦略
- 動的波動性指数 (VIDYA) とATRトレンドフォロディング逆転戦略
- RSI,MACDおよびボリュームに基づく多指標適応型取引戦略
- 価格パターンに基づくダブルボトムとトップ自動取引戦略
- 複数の移動平均値とストカスティックオシレータークロスオーバーの定量戦略
- アダプティブ・トレンドフォローと逆転検出戦略:ジグザグとアロン指標に基づく定量取引システム
- 多指標シネージストラテジーはボリンジャーバンド,フィボナッチ,MACD,RSI
- ドル・コスト平均化投資戦略
- 多次元ゴールド金曜日の異常戦略分析システム
- 多期動的ATRトレンド追跡戦略
- RSI トレンド・モメント・トラッキング・ストラテジーによる移動平均のクロスオーバー
- 動的ATRベースのトレーリングストップ取引戦略
- MACD-RSIの二重確認の取引戦略をフォローするモメンタムトレンド
- 金十字最適化システムを持つダイナミックピボットポイント