概要
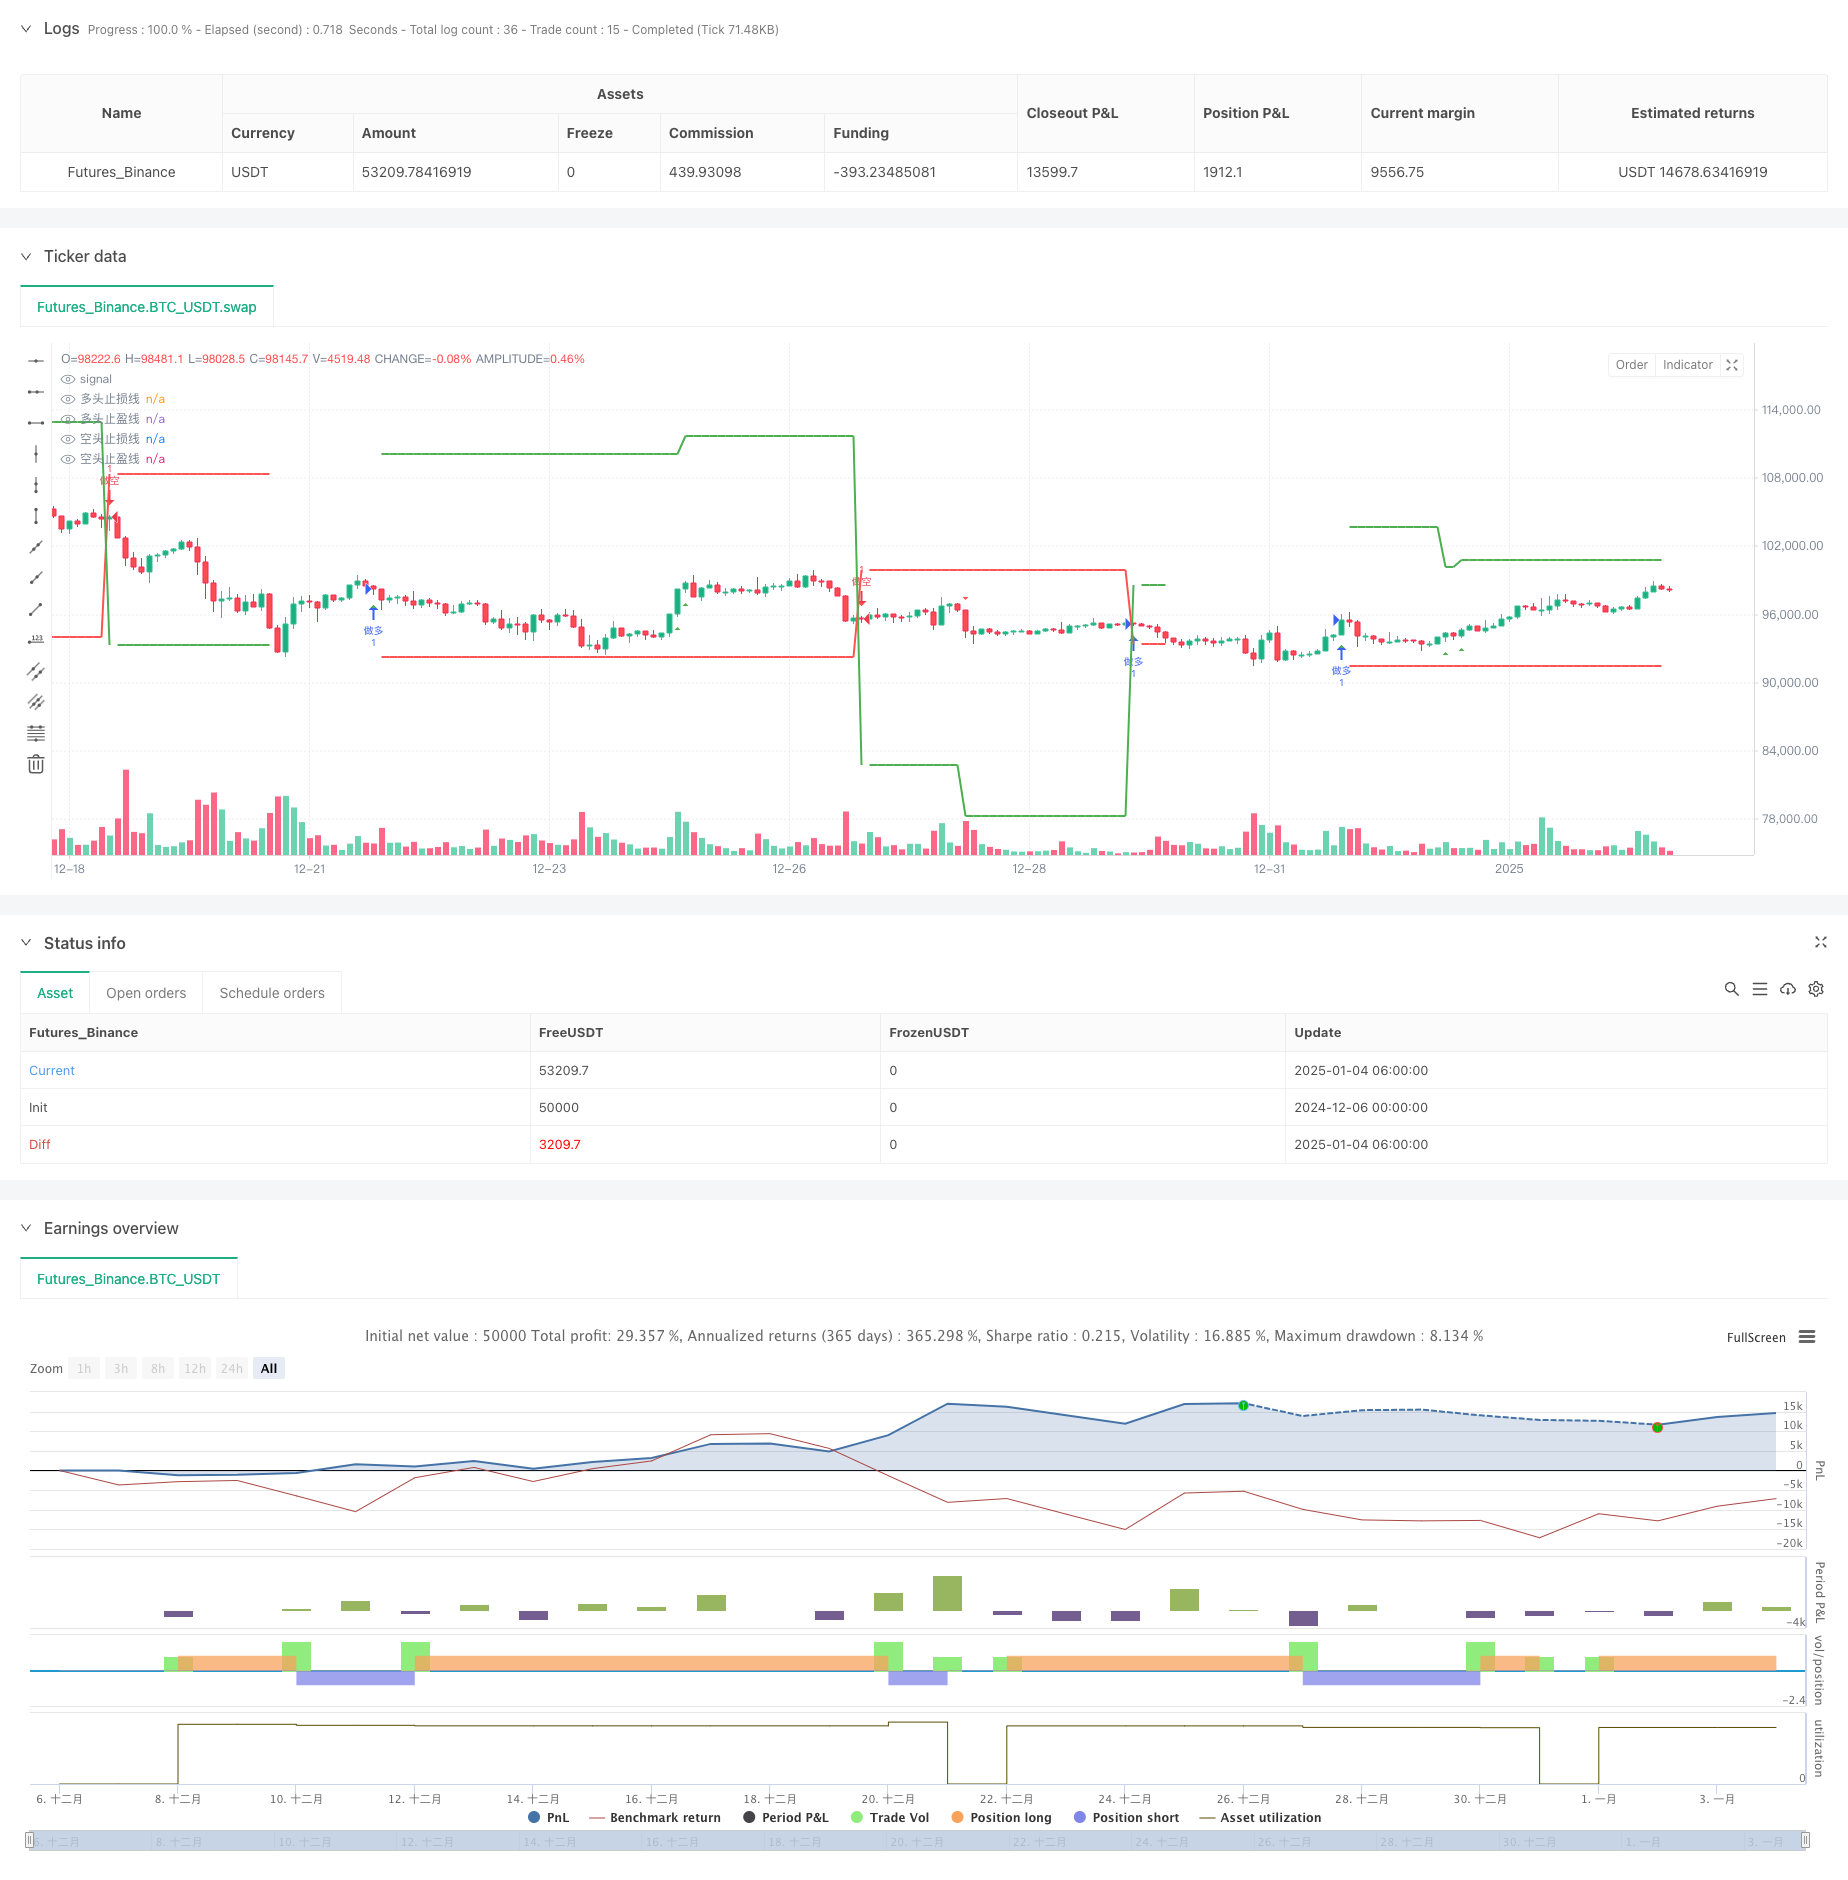
この戦略は、WaveTrend オシレーターと EMA 移動平均バンドを組み合わせた高度な取引システムです。これら 2 つのテクニカル指標を統合することで、市場トレンドの転換点を正確に捉えることができる取引戦略が形成されます。この戦略では、動的なストッププロフィットとストップロスの設定を採用し、資本の安全性を保護しながらより高い収益を追求します。
戦略原則
この戦略の中核は、WaveTrend インジケーターと 8 つの EMA 移動平均の調整を通じて取引シグナルを識別することです。 WaveTrend インジケーターは、価格と移動平均の偏差を計算して、市場の買われすぎまたは売られすぎの状態を測定します。 EMA 移動平均バンドは、異なる期間の移動平均を交差することでトレンドの方向を確認します。具体的には:
- EMA2 が EMA8 を横切るか、青い三角形のシグナルが表示され (EMA2 が EMA3 を横切る)、ブラッドダイヤモンド パターンがない場合、ロング シグナルがトリガーされます。
- EMA8 が EMA2 を横切るか、ダイヤモンド パターンが現れると、ショート シグナルがトリガーされます。
- ストップロス設定は、前回の反転信号の後の極値ポイントを使用し、リスクを効果的に制御できます。
- 利益目標はストップロス距離の 2 ~ 3 倍に設定されており、良好なリスク リターン比率を反映しています。
戦略的優位性
- 二重確認メカニズムにより取引シグナルの信頼性が向上
- ダイナミックストップロス設定により、市場の変動に適応しやすくなります。
- 明確なリスク・リターン比率設定
- EMA移動平均バンドの使用は、市場全体のトレンドを判断するのに役立ちます。
- WaveTrendインジケーターは、買われ過ぎと売られ過ぎの市場状況を効果的に識別できます。
- 戦略ロジックは明確で、理解しやすく、実行しやすい
戦略リスク
- 不安定な市場では誤ったシグナルが頻繁に発生する可能性がある
- 変動が激しい場合には、ダイナミックストップロスが簡単に発動される可能性がある。
- 過去のデータに依存する指標は、市場が劇的に変化した場合に機能しなくなる可能性があります。
- 複数のテクニカル指標を使用すると、シグナルが遅れる可能性がある 解決:
- ボラティリティフィルターを追加することで、ボラティリティの高い市場での誤ったシグナルを減らすことができます。
- より緩いストップロス設定の使用を検討する
- トレンドの強さを確認するメカニズムを追加
戦略最適化の方向性
- 市場ボラティリティ指標(ATRなど)を導入して、ストップロス距離を動的に調整する
- 信号の信頼性を向上させるために音量確認メカニズムを追加
- 強いトレンド市場でのみ取引するために、トレンド強度フィルターを追加することを検討してください。
- さまざまな市場環境に適応するためにWaveTrendパラメータを最適化します
- 異なる期間における信号の相乗効果を研究する
要約する
これは、テクニカル分析のトレンドフォローとオシレーターを組み合わせた完全な取引システムです。 WaveTrendとEMA移動平均バンドを組み合わせて使用することで、全体的なトレンドを把握できるだけでなく、トレンドの転換点にタイミングよく市場に参入することができます。動的なストッププロフィットおよびストップロス管理メカニズムにより、戦略に優れたリスク管理機能が提供されます。戦略の最適化の余地は、主にシグナル フィルタリングとリスク管理の改善にあります。
ストラテジーソースコード
/*backtest
start: 2024-12-06 00:00:00
end: 2025-01-04 08:00:00
period: 2h
basePeriod: 2h
exchanges: [{"eid":"Futures_Binance","currency":"BTC_USDT"}]
*/

//@version=5
strategy("VuManChu Cipher A Strategy", overlay=true, initial_capital=10000, default_qty_type=strategy.fixed, default_qty_value=1.0)

// === 函数定义 ===
// WaveTrend函数
f_wavetrend(_src, _chlen, _avg, _malen) =>
    _esa = ta.ema(_src, _chlen)
    _de = ta.ema(math.abs(_src - _esa), _chlen)
    _ci = (_src - _esa) / (0.015 * _de)
    _tci = ta.ema(_ci, _avg)
    _wt1 = _tci
    _wt2 = ta.sma(_wt1, _malen)
    [_wt1, _wt2]

// EMA Ribbon函数
f_emaRibbon(_src, _e1, _e2, _e3, _e4, _e5, _e6, _e7, _e8) =>
    _ema1 = ta.ema(_src, _e1)
    _ema2 = ta.ema(_src, _e2)
    _ema3 = ta.ema(_src, _e3)
    _ema4 = ta.ema(_src, _e4)
    _ema5 = ta.ema(_src, _e5)
    _ema6 = ta.ema(_src, _e6)
    _ema7 = ta.ema(_src, _e7)
    _ema8 = ta.ema(_src, _e8)
    [_ema1, _ema2, _ema3, _ema4, _ema5, _ema6, _ema7, _ema8]

// === 变量声明 ===
var float stopPrice = na      // 止损价格变量
var float targetPrice = na    // 止盈价格变量
var float lastLongPrice = na
var float lastShortPrice = na
var float highestSinceLastLong = na
var float lowestSinceLastShort = na

// === WaveTrend参数 ===
wtChannelLen = input.int(9, title = 'WT Channel Length')
wtAverageLen = input.int(13, title = 'WT Average Length')
wtMASource = hlc3
wtMALen = input.int(3, title = 'WT MA Length')

// === EMA Ribbon参数 ===
ema1Len = input.int(5, "EMA 1 Length")
ema2Len = input.int(11, "EMA 2 Length")
ema3Len = input.int(15, "EMA 3 Length")
ema4Len = input.int(18, "EMA 4 Length")
ema5Len = input.int(21, "EMA 5 Length")
ema6Len = input.int(24, "EMA 6 Length")
ema7Len = input.int(28, "EMA 7 Length")
ema8Len = input.int(34, "EMA 8 Length")

// === 计算指标 ===
// WaveTrend计算
[wt1, wt2] = f_wavetrend(wtMASource, wtChannelLen, wtAverageLen, wtMALen)

// WaveTrend交叉条件
wtCross = ta.cross(wt1, wt2)
wtCrossDown = wt2 - wt1 >= 0

// EMA Ribbon计算
[ema1, ema2, ema3, ema4, ema5, ema6, ema7, ema8] = f_emaRibbon(close, ema1Len, ema2Len, ema3Len, ema4Len, ema5Len, ema6Len, ema7Len, ema8Len)

// === 交易信号 ===
longEma = ta.crossover(ema2, ema8)
shortEma = ta.crossover(ema8, ema2)
redCross = ta.crossunder(ema1, ema2)
blueTriangle = ta.crossover(ema2, ema3)
redDiamond = wtCross and wtCrossDown
bloodDiamond = redDiamond and redCross

// 更新最高最低价
if not na(lastLongPrice)
    highestSinceLastLong := math.max(high, nz(highestSinceLastLong))
if not na(lastShortPrice)
    lowestSinceLastShort := math.min(low, nz(lowestSinceLastShort))

// === 交易信号条件 ===
longCondition = longEma or (blueTriangle and not bloodDiamond)
shortCondition = shortEma or bloodDiamond

// === 执行交易 ===
if (longCondition)
    // 记录多头入场价格
    lastLongPrice := close
    // 重置最高价跟踪
    highestSinceLastLong := high

    stopPrice := nz(lowestSinceLastShort, close * 0.98)  // 使用前一个空头信号后的最低价作为止损
    float riskAmount = math.abs(close - stopPrice)
    targetPrice := close + (riskAmount * 2)  // 止盈为止损距离的2倍

    strategy.entry("做多", strategy.long)
    strategy.exit("多头止盈止损", "做多", limit=targetPrice, stop=stopPrice)

if (shortCondition)
    // 记录空头入场价格
    lastShortPrice := close
    // 重置最低价跟踪
    lowestSinceLastShort := low

    stopPrice := nz(highestSinceLastLong, close * 1.02)  // 使用前一个多头信号后的最高价作为止损
    float riskAmount = math.abs(stopPrice - close)
    targetPrice := close - (riskAmount * 3)  // 止盈为止损距离的2倍

    strategy.entry("做空", strategy.short)
    strategy.exit("空头止盈止损", "做空", limit=targetPrice, stop=stopPrice)

// === 绘制信号 ===
plotshape(longCondition, style=shape.triangleup, color=color.green, location=location.belowbar, size=size.small, title="做多信号")
plotshape(shortCondition, style=shape.triangledown, color=color.red, location=location.abovebar, size=size.small, title="做空信号")

// 绘制止损线
plot(strategy.position_size > 0 ? stopPrice : na, color=color.red, style=plot.style_linebr, linewidth=2, title="多头止损线")
plot(strategy.position_size < 0 ? stopPrice : na, color=color.red, style=plot.style_linebr, linewidth=2, title="空头止损线")

// 绘制止盈线
plot(strategy.position_size > 0 ? targetPrice : na, color=color.green, style=plot.style_linebr, linewidth=2, title="多头止盈线")
plot(strategy.position_size < 0 ? targetPrice : na, color=color.green, style=plot.style_linebr, linewidth=2, title="空头止盈线")