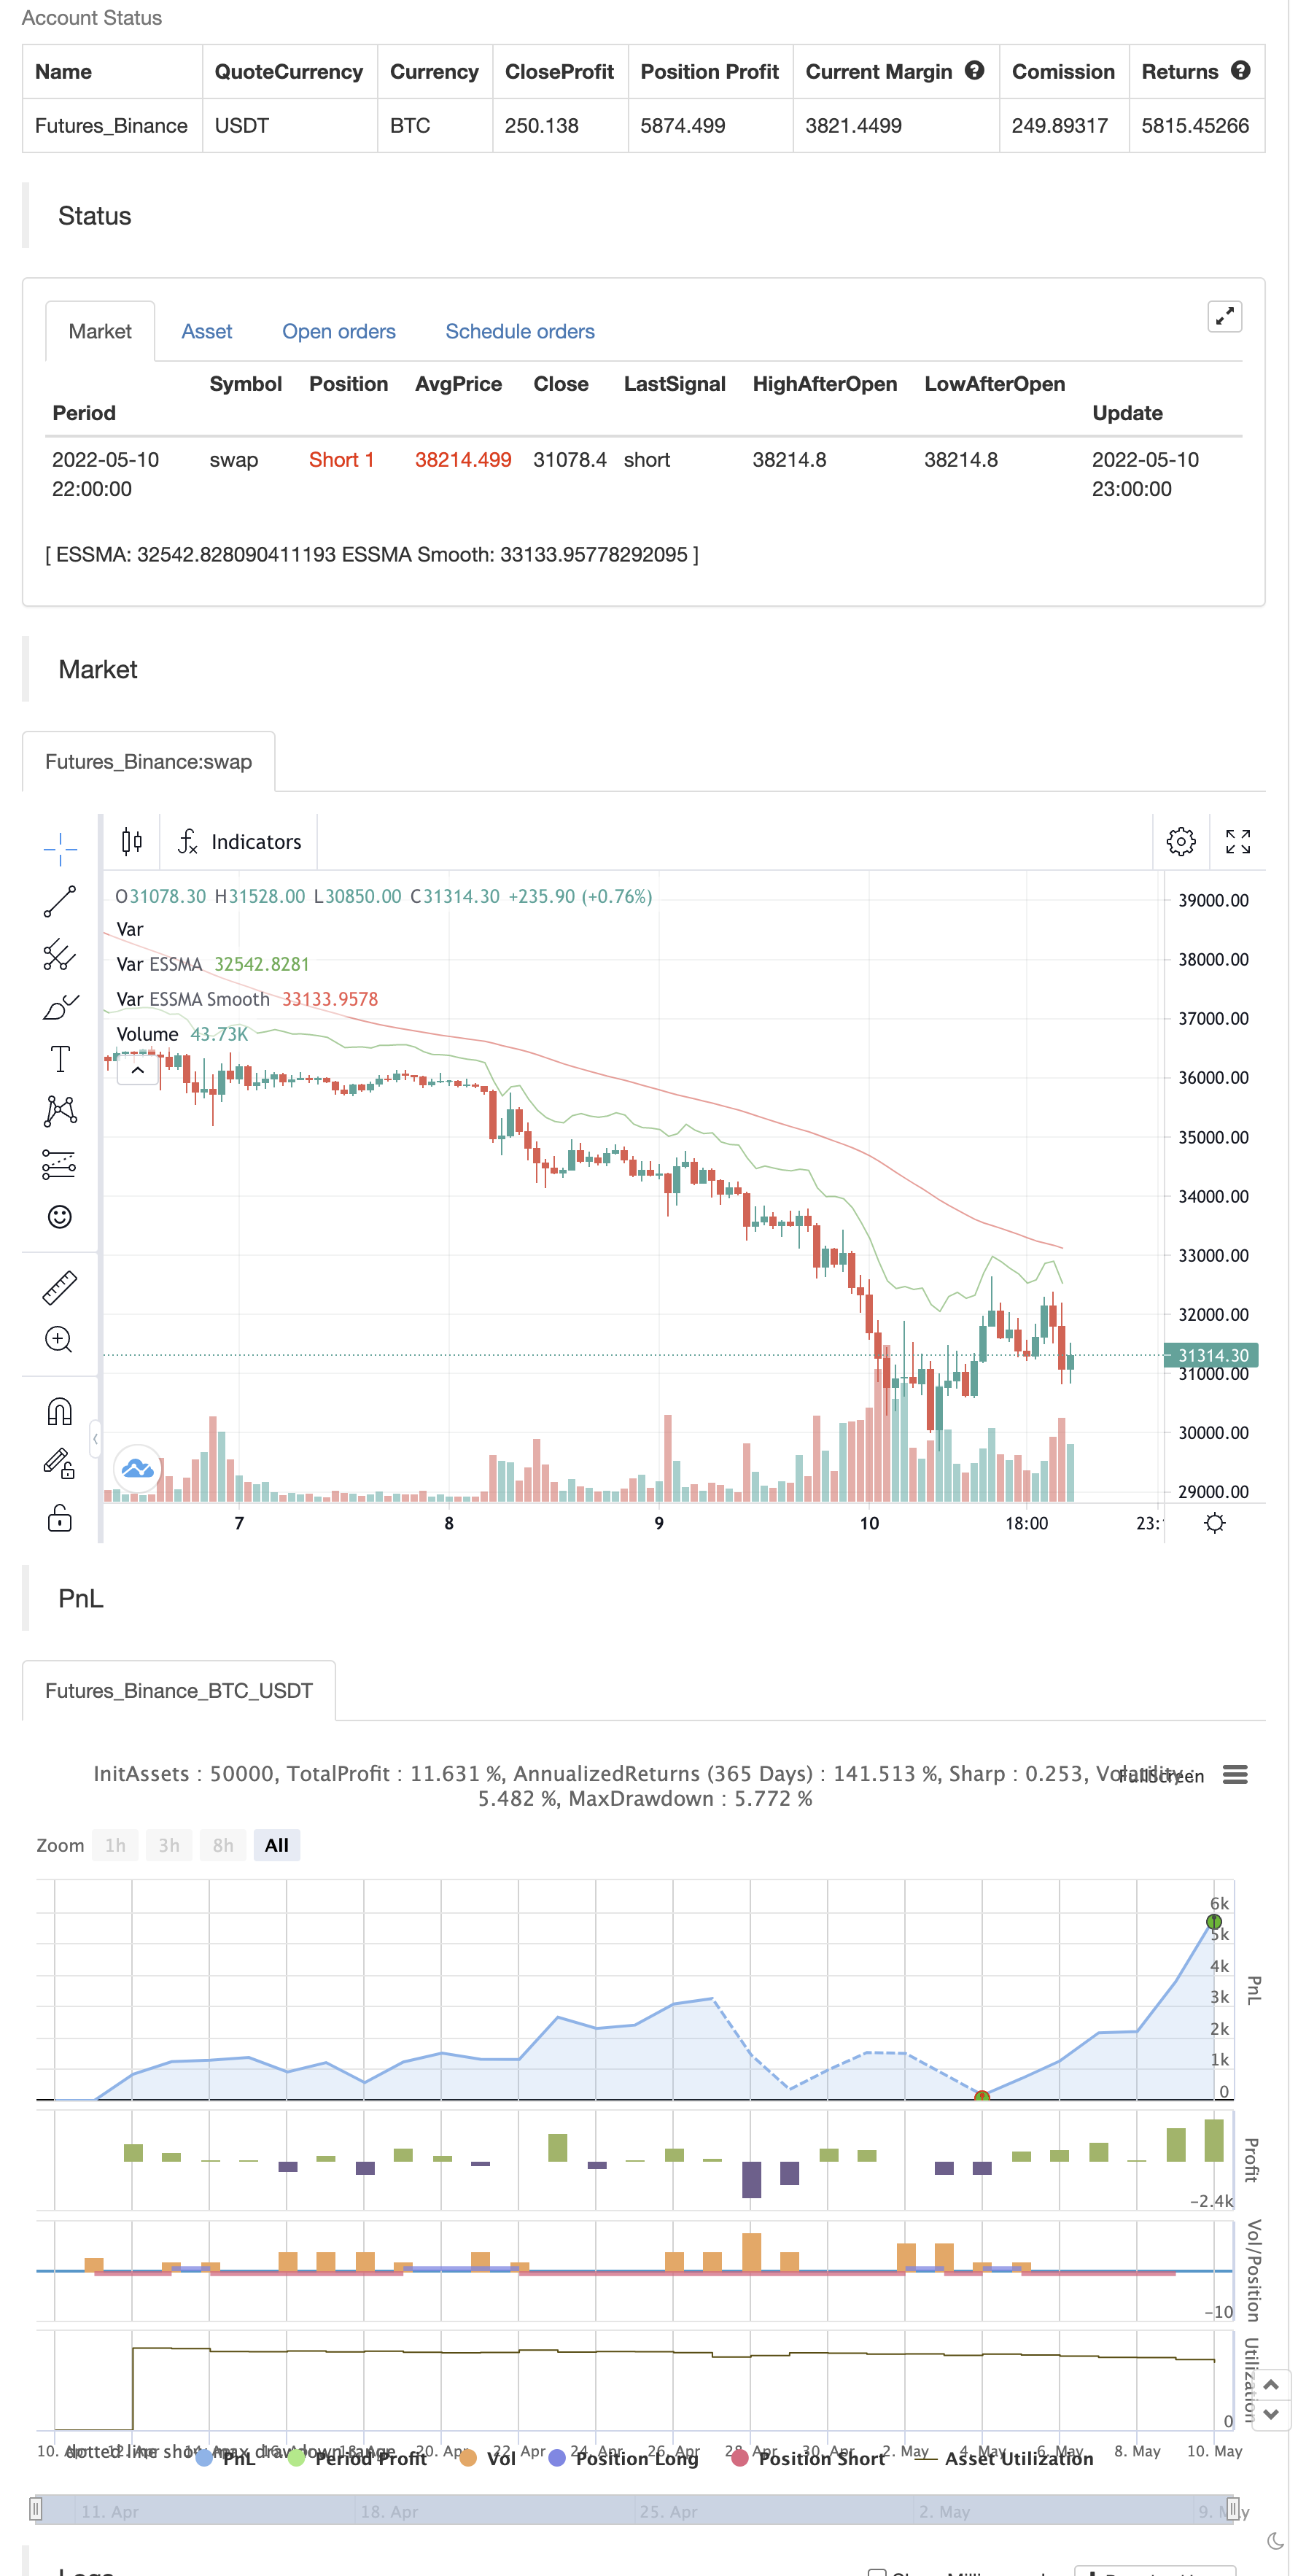
ESSMA
저자:차오장, 날짜: 2022-05-12 15:19:33태그:EMASMAWMARMAATR
개념:
많은 이동 평균이 있습니다.
하지만 그 효과는 다릅니다.
트렌드 확인과 추적은 많은 수의 이동 평균을 다르게 사용해야합니다.
여기서의 개념은 조합 이동 평균을 생성하는 것입니다. 각 MA 유형은 트렌드를 더 높은 수준의 확인을 제공하기 위해 가중화 될 수 있습니다.
무게는 설정으로 구성 될 수 있으며 샘플로 50 길이가 사용되었습니다.
ATR은 좋은 결과를 얻지 못했고, 선택적으로 유지되었습니다.
소스는 수정될 수 있습니다.
이 지표는 더 큰 시간 프레임에서 좋은 저항 지원 값을 제공합니다. 또한 브레이크오웃 및 파업 지표를 제공합니다. 추적은 대부분 효과적입니다.
경보 상태는 바로 디스코드로 전환될 수 있도록 만들어졌습니다.
경고를 위해서는 자신의 메시지를 설정해야 합니다.
행복한 거래

/*backtest
start: 2022-04-11 00:00:00
end: 2022-05-10 23:59:00
period: 1h
basePeriod: 15m
exchanges: [{"eid":"Futures_Binance","currency":"BTC_USDT"}]
*/

// This source code is subject to the terms of the Mozilla Public License 2.0 at https://mozilla.org/MPL/2.0/
// © bhavishya

//@version=5
indicator("ESSMA", overlay=true)
//inputs
source = input(close, "Source", group="Source")
length1 = input(50, "Length1", group = "Length")


w1 = input.float(2.0, "SMA Weight", group="Weights")
w2 = input.float(2.0, "EMA Weight", group="Weights")
w3 = input.float(2.0, "WMA Weight", group="Weights")
w4 = input.float(2.0, "SMMA Weight", group="Weights")
w5 = input.float(2.0, "RMA Weight", group="Weights")


useatr = input.bool(false, "Use ATR", group="ATR")

atrLen    = input.int(title="ATR Length", defval=14, group="ATR")

// functions

smma(src, length) =>
	smma =  0.0
	smma := na(smma[2]) ? ta.sma(src, length) : (smma[2] * (length - 1) + src) / length
	smma

essma(src,length) =>
    essma = 0.0

    smma = smma(src * w4,length)
    ema = ta.ema(src * w2, length)
    sma = ta.sma(src * w1, length)
    wma = ta.wma(src * w3, length)
    rma = ta.rma(src * w5, length)

    essma := (smma/w4+ema/w2+sma/w1 - wma/w3 - rma/w5 + open + close)/(3)
    essma
// calucations

// atr and MAs

atr = ta.atr(atrLen)

usesource = useatr ? atr : source

essma1 = essma(usesource, length1)
sessma1 = ta.wma(essma1, length1)
// plots


p1 = plot(essma1, "ESSMA", color.green)

ps1 = plot(sessma1, "ESSMA Smooth", color.red)

bool up = na
bool down = na

if (ta.crossover(essma1,sessma1))
    up := true


if (ta.crossunder(essma1, sessma1))
    down := true

plotshape(up, style=shape.labelup, location = location.belowbar, color=color.lime, text="B", textcolor=color.black)
plotshape(down, style=shape.labeldown, location = location.abovebar, color=color.orange, text="S", textcolor=color.black)


// alerts

alertcondition(up, "ESSMA UP", '{"content":"ESSMA BUY @ {{close}}" : "{{ticker}} int : {{interval}} - essma : {{plot_0}} / sessma {{plot_1}}"}')
alertcondition(down, "ESSMA DOWN", '{"content":"ESSMA SELL @ {{close}}" : "{{ticker}} int : {{interval}} -  essma :{{plot_0}} /sessma : {{plot_1}}"}')

if up
    strategy.entry("Enter Long", strategy.long)
else if down
    strategy.entry("Enter Short", strategy.short)
관련 내용
- 슈퍼 스칼퍼
- 슈퍼 점프 턴 백 볼링거 밴드
- 슈퍼 스칼퍼 - 5분 15분
- 멀티 슬라이드 오브라인 다이내믹 크로스 트렌드 추적 및 멀티 확인 양적 거래 전략
- SSL 하이브리드
- 레인보우 오시레이터
- 다중평균형 크로스 다이내믹 거래 전략에 적응
- 더 똑똑한 MACD
- 구매/판매로 EMA ADX RSI를 스칼핑
- 슈퍼트렌드 이동 평균
더 많은 내용
- 브라마스트라
- 모보 밴드
- SAR + 3SMMA와 SL & TP
- SSS
- 달 발사 경고 템플릿 [지표]
- HALFTREND + HEMA + SMA (거짓 신호의 전략)
- RSI: 피보트, BB, SMA, EMA, SMMA, WMA, VWMA와의 분차
- RSI와 BB와 동시에 과판
- 롤링 하이킨 아시 촛불
- 콤보 2/20 EMA & 밴드 패스 필터
- 3EMA
- 회전 순서 블록
- NMVOB-S
- 이동 평균 색상 EMA/SMA
- MAHL 밴드
- 3 이 단일 스크립트에서 슈퍼 트렌드 추가
- 변동 높은/저하 지표와 MACD 및 EMA 확인
- 트리플 EMA + MACD
- 크로스 플레이
- 더 작은 프랙탈 (+ 투명성)