파이썬 KLineChart
저자:발명가 양자화, 날짜: 2022-07-01 15:55:31태그:
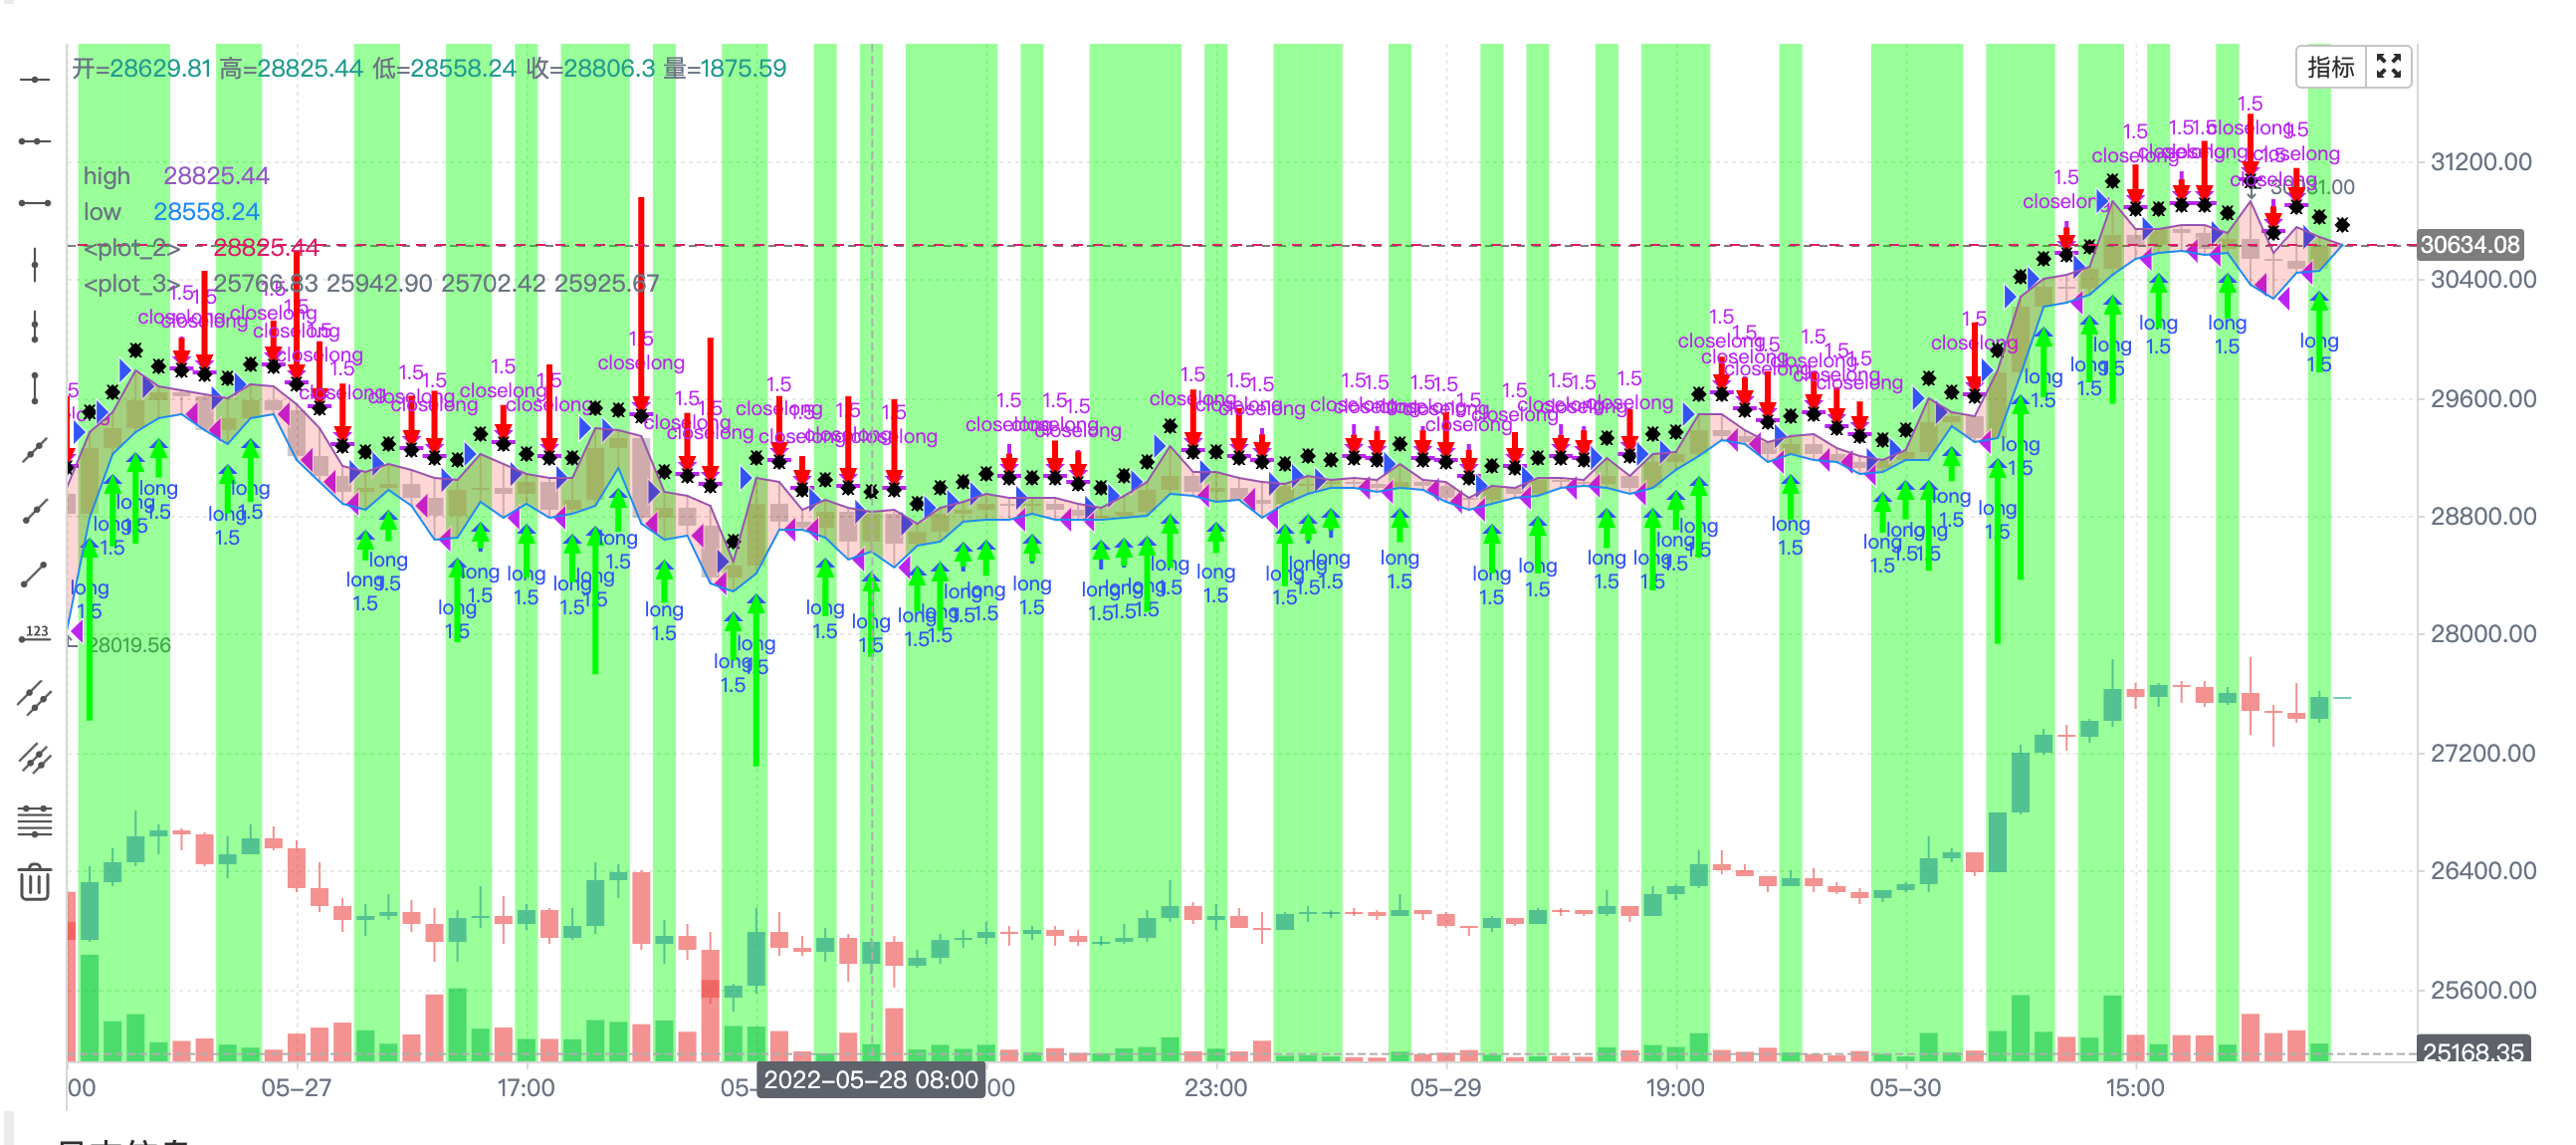
플랫폼 (Javascript/Python 언어) 오픈 KLineChart 지원, 파인 언어의 모든 그래프 기능을 지원 (변수 일치), 사용자 정의 구매 신호를 지원 여기 예시입니다.
참고 문서https://www.fmz.com/api#klinechart

'''backtest
start: 2022-03-30 09:00:00
end: 2022-06-30 15:00:00
period: 1h
basePeriod: 15m
exchanges: [{"eid":"Binance","currency":"BTC_USDT"}]
'''


import sys
def main():
    Log(sys.version)
    c = KLineChart()
    c.reset(0)

    bars = exchange.GetRecords()
    for bar in bars:
        c.begin(bar)
        c.barcolor('rgba(255, 0, 0, 0.2)' if bar.Close > bar.Open else 'rgba(0, 0, 0, 0.2)')
        if bar.Close > bar.Open:
            c.bgcolor('rgba(0, 255, 0, 0.5)')

        h = c.plot(bar.High, 'high')
        l = c.plot(bar.Low, 'low')
        c.fill(h, l, 'rgba(255, 0, 0, 1)' if bar.Close > bar.Open else '#000000')
        c.hline(bar.High)
        c.plotarrow(bar.Close - bar.Open)
        c.plotshape(bar.Low, style = 'diamond')
        c.plotchar(bar.Close, char = 'X')
        c.plotcandle(bar.Open*0.9, bar.High*0.9, bar.Low*0.9, bar.Close*0.9)
        if bar.Close > bar.Open:
            c.signal("long", bar.High, 1.5, "LONG")
        elif bar.Close < bar.Open:
            c.signal("closelong", bar.Low, 1.5)
        c.close()
더 많은 내용