개요
이 전략은 이동 평균, 진동 지표와 같은 여러 가지 기술 지표를 사용하여, 평균선 통과 형태와 결합하여, 주식 가격의 추세와 하락의 전환점을 식별하여, 매매를 한다.
원칙
이 전략은 다음과 같은 부분으로 구성됩니다.
구간을 선택: K 라인 그래프의 시간 구간 분수, 예를 들어 1분, 5분 등
이동 평균을 선택: 일반적으로 사용되는 EMA, SMA 등의 이동 평균의 파라미터를 구성합니다. 10일선, 20일선 등
흔들림 지표 선택: RSI, MACD, 윌리엄 지표 등 흔들림 지표의 파라미터를 구성한다.
구매 및 판매 신호를 계산합니다: 사용자 정의 함수를 사용하여 이동 평균과 진동 지표의 수치를 계산합니다. 단기 평균선 위에 장기 평균선을 통과하면 구매 신호가 발생하고, 단기 평균선 아래에 장기 평균선을 통과하면 판매 신호가 발생합니다.
등급 시스템: 각 지표의 구매 판매 신호를 수치화 스코어, 그리고 평균을 취하여 전체 등급 지수를 얻습니다. 등급 지수는 0보다 큰 구매 신호, 0보다 작은 판매 신호입니다.
거래 신호: 등급 지수가 0보다 크거나 작으면 최종 거래 신호를 생성하고, 구매 또는 판매 작업을 수행한다.
이 전략은 여러 가지 지표를 조합하여 가격의 추세와 전환점을 효과적으로 식별하여 신호의 신뢰성을 높입니다. 평행선 통과는 유효한 트렌드 기술 신호이며, 흔들림 지표와 결합하면 가짜 돌파구를 피하는 데 도움이됩니다. 등급 시스템은 거래 신호를 더 명확하게 만듭니다.
장점
- 평평선 통과와 여러 가지 진동 지표가 결합되어 거래 신호가 더 신뢰할 수 있으며 가짜 신호를 피합니다.
- 평가 시스템은 구매와 판매 신호를 더 명확하게 만듭니다.
- 사용자 정의 함수를 사용하여 모듈화 프로그래밍, 코드 구조가 명확하다
- 여러 시간 주기를 사용하여 조합 분석을 수행하여 정확도를 향상시킵니다.
- RSI 길이, MACD 속속 평균주기 등과 같은 변수 설정을 최적화합니다.
- 매개 변수 사용자 정의 지표와 평균선 매개 변수를 통해 유연성을 향상
위험성
- 대시장 추세에 따른 주가 성과에 차이가 있다.
- 거래 빈도가 높을 수 있으며 거래 비용과 지점 위험을 증가시킬 수 있습니다.
- 다양한 주식 특성에 맞게 최적화 변수를 반복적으로 테스트해야 합니다.
- 철수와 손실의 위험이 있습니다.
이 위험은 다음과 같은 방법으로 줄일 수 있습니다.
- 큰 시장의 흐름과 함께 주식을 선택하세요.
- 거래시간을 적절히 조정하고 거래 빈도를 낮추는 것
- 주식 특성에 맞는 최적화 변수 설정
- 손실을 통제하기 위한 전략
최적화 방향
이 전략은 다음의 몇 가지 측면에서 더 개선될 수 있습니다.
- 더 많은 지표, 예를 들어 변동률 지표, 강화 신호
- 기계 학습과 결합된 자동 최적화 매개 변수
- 주식 및 업계 선택 모듈을 추가합니다.
- 양적 선택 방법과 결합
- 적응적 손실, 추적적 손실을 방지하는 방법
- 큰 시장 상황을 고려하고 불확실한 환경을 피하십시오.
- 실물 거래 결과를 분석하고 평가 중량을 조정합니다.
종합적으로, 이 전략은 평균선 돌파와 여러 지표를 통합하여 가격 움직임을 효과적으로 식별할 수 있다. 그러나 지속적으로 최적화를 테스트하고 위험을 제어해야 한다. 포트폴리오 선택 주식, 매개 변수 최적화, 상쇄 측면에서 향후 개선할 수 있다.
요약하다
이 전략은 수평선을 통과하는 것을 주요 거래 신호로 하고, 여러 가지 충격 지표에 의해 확인되고, 점수 시스템을 사용하여 명확한 구매 판매 신호를 생성한다. 가격 추세와 전환점을 효과적으로 식별 할 수 있지만 거래 주파수를 제어하고 거래 비용과 위험을 줄이는 동시에 계속적인 최적화 매개 변수가 필요합니다.
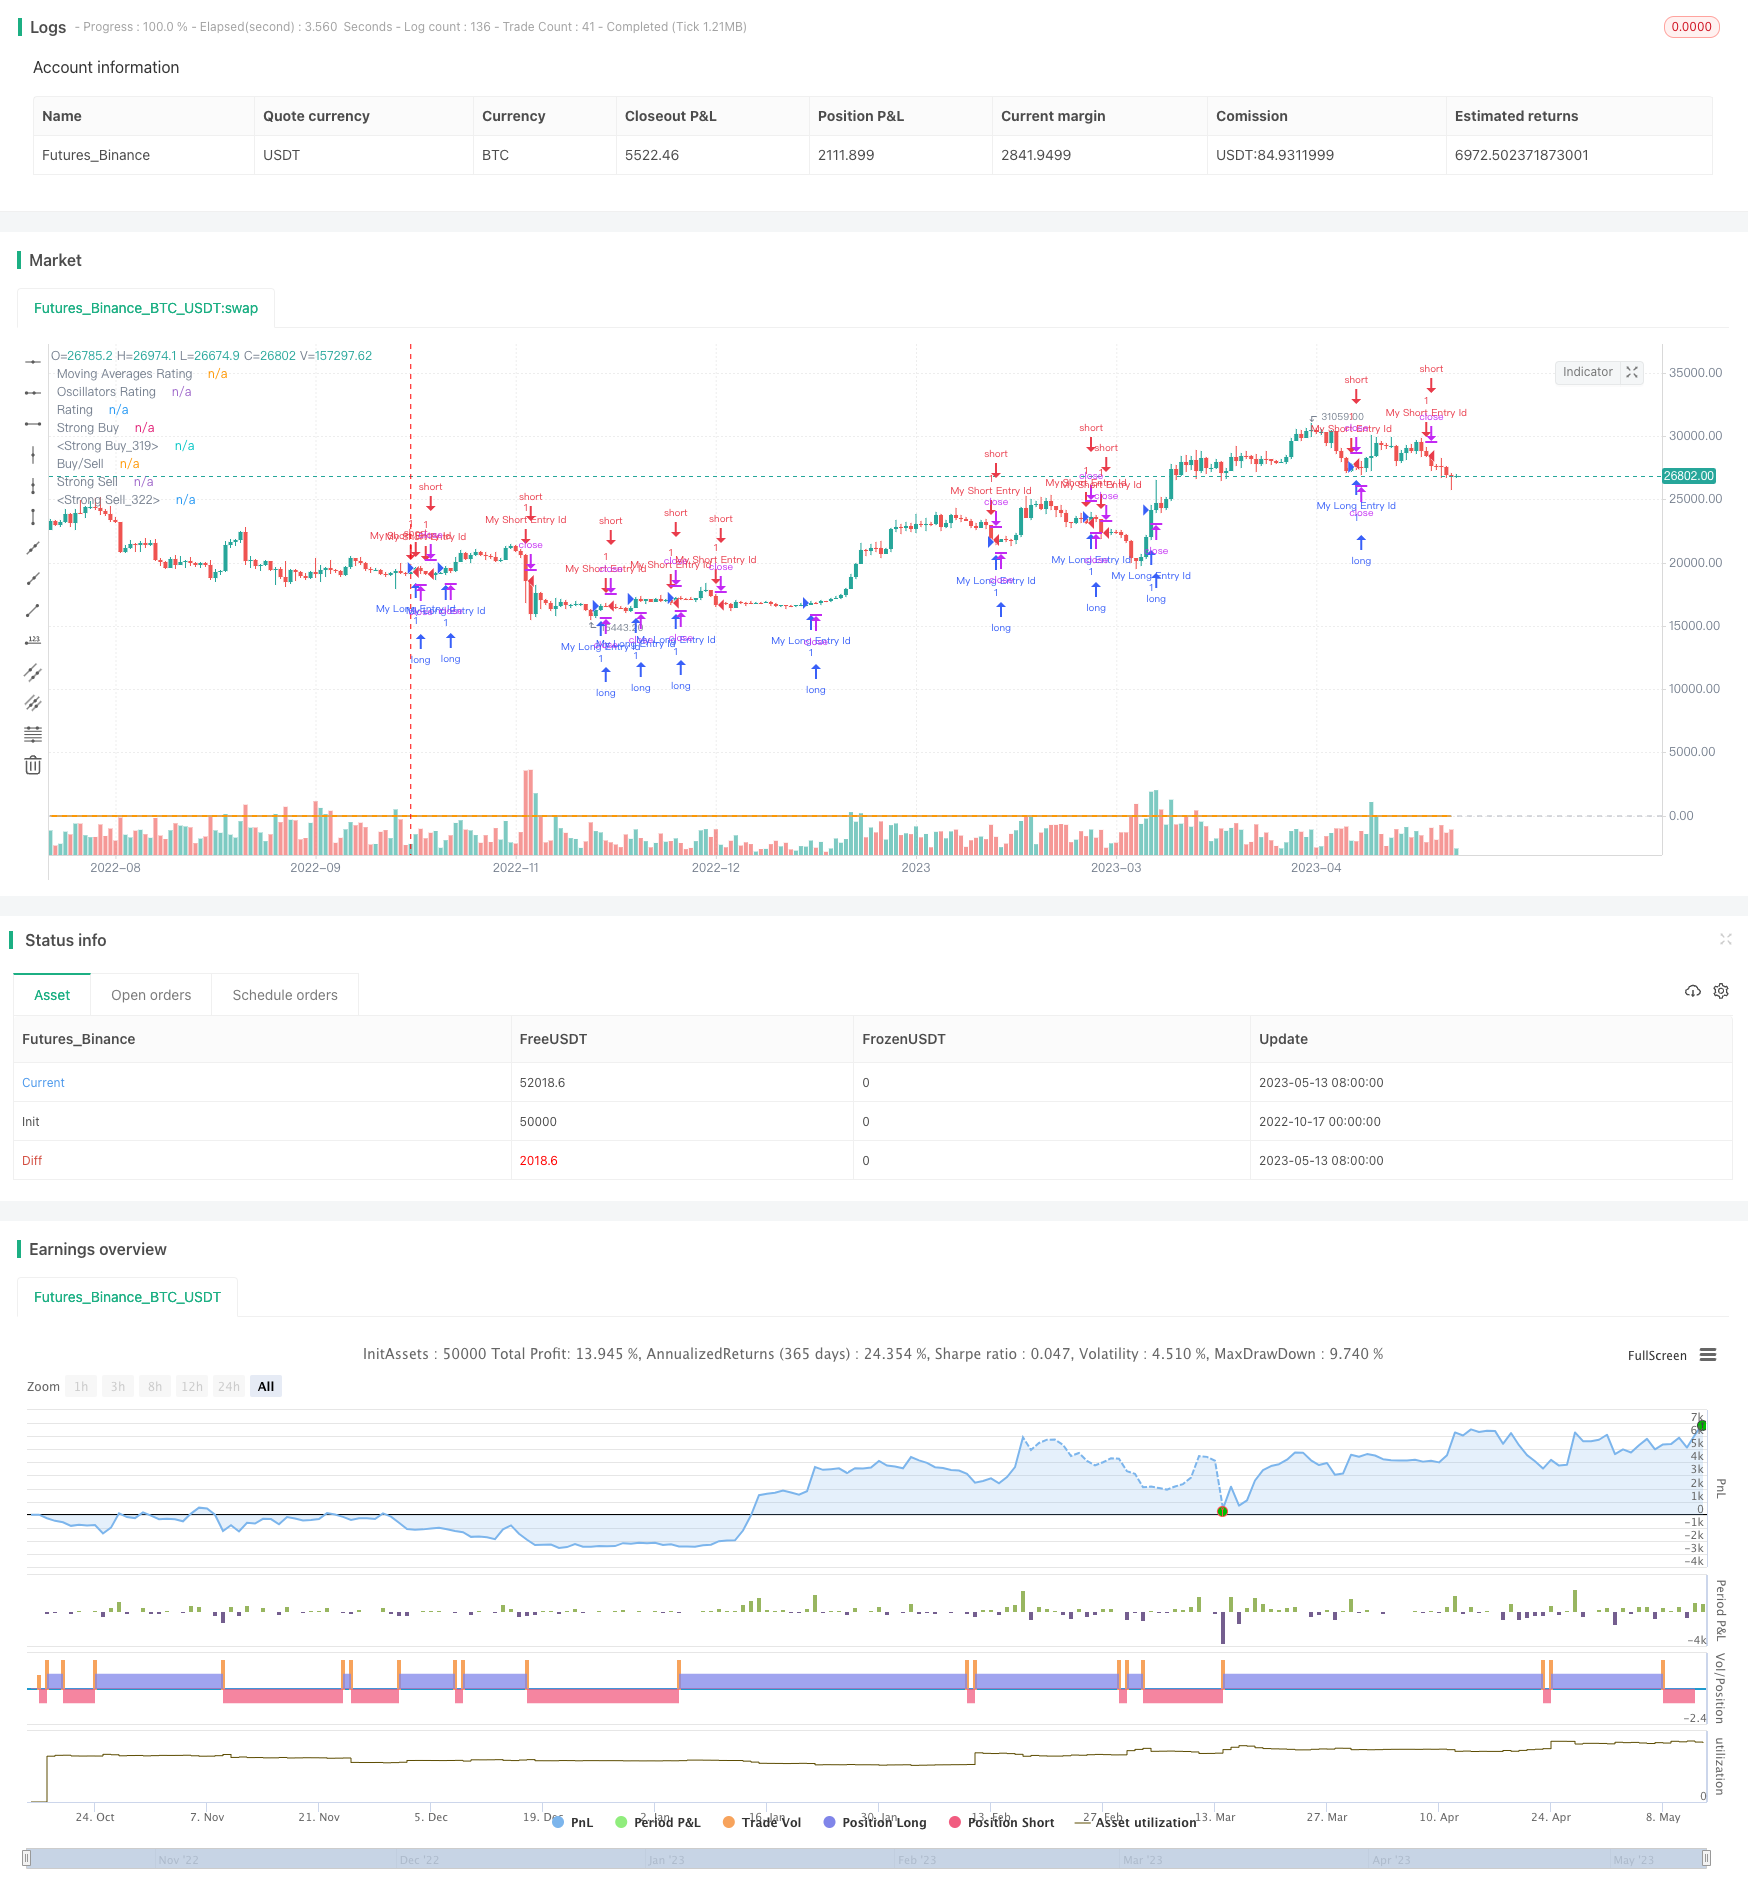
/*backtest
start: 2022-10-17 00:00:00
end: 2023-05-14 00:00:00
period: 1d
basePeriod: 1h
exchanges: [{"eid":"Futures_Binance","currency":"BTC_USDT"}]
*/

//@version=4
strategy("TV Signal", overlay=true, initial_capital = 500, currency = "USD")

// -------------------------------------- GLOBAL SELECTION --------------------------------------------- //
//res  = input(defval="5"  , title="resolution " , type=resolution)
res_num  = input("240", title="Resolution (minutes)", options=["1", "5", "15", "60", "240"] )
res = res_num
src  = close

// -----------------------------------MOVING AVERAGES SELECTION----------------------------------------- //
// EMAS input
ema10                 = 10
ema20                 = 20
ema30                 = 30
ema50                 = 50
ema100                = 100
ema200                = 200
// SMAS input
sma10                 = 10
sma20                 = 20
sma30                 = 30
sma50                 = 50
sma100                = 100
sma200                = 200
// Ichimoku - is not active in the calculation brought to you by TV TEAM for the lolz
// VWMA
vwma20                = 20
// Hull
hma9                  = 9

// -----------------------------------OSCILLATORS SELECTION----------------------------------------- //
//RSI
rsi_len         = input(14, minval=1, title="RSI Length")
//STOCH K
stoch_k         = input(14, minval=1, title="STOCH K")
stoch_d         = input(3,  minval=1, title="STOCH D")
stoch_smooth    = input(3,  minval=1, title="STOCH Smooth")
//CCI
cci_len         = input(20, minval=1, title="CCI Length")
//Momentum
momentum_len = input(10, minval=1, title="Momentum Length")
//MACD
macd_fast           = input(12,  title="MACD fast")
macd_slow           = input(27,  title="MACD slow")
//ADX
adxlen = input(14, title="ADX Smoothing")
dilen  = input(14, title="DI Length")
//BBP
bbp_len           = input(13,  title="BBP EMA Length")
//William Percentage Range
wpr_length = input(14, minval=1,  title="William Perc Range Length")
//Ultimate Oscillator
uo_length7 = input(7, minval=1, title="UO Length 7"), uo_length14 = input(14, minval=1, title="UO Length 14"), uo_length28 = input(28, minval=1, title="UO Length 28")

// -------------------------------------- FUNCTIONS - Moving Averages -------------------------------------- //
// Simple Moving Averages Calculation Function - SELL indicator values < price // BUY – indicator values > price
calc_sma_index(len, src, res) =>
    sma_val = request.security(syminfo.tickerid, res, sma(src, len))
    sma_index  = if( sma_val > close )
        -1
    else
        1
    sma_index
// Exponential Moving Averages Calculation Function - SELL indicator values < price // BUY – indicator values > price
calc_ema_index(len, src, res) =>
    ema_val = request.security(syminfo.tickerid, res, sma(src, len))
    ema_index  = if( ema_val > close )
        -1
    else
        1
    ema_index
// Hull Moving Averages Calculation Function - SELL indicator values < price // BUY – indicator values > price
calc_hull_index(len, src, res) =>
    hull_val = request.security(syminfo.tickerid, res, wma(2*wma(src, len/2)-wma(src, len), round(sqrt(len))))
    hull_index  = if( hull_val > close )
        -1
    else
        1
    hull_index
// VW Moving Averages Calculation Function - SELL indicator values < price // BUY – indicator values > price
calc_vwma_index(len, src, res) =>
    vwma_val = request.security(syminfo.tickerid, res, vwma(src, len))
    vwma_index  = if( vwma_val > close )
        -1
    else
        1
    vwma_index
// -------------------------------------- FUNCTIONS - Oscillators -------------------------------------- //
// RSI indicator < lines that represent oversold conditions(70) and indicator values are rising    = -1
// RSI indicator > lines that represent overbought conditions(30) and indicator values are falling = +1
calc_rsi_index(len, src, res) =>
    up         = rma(max(change(src), 0), len)
    down       = rma(-min(change(src), 0), len)
    rsi        = down == 0 ? 100 : up == 0 ? 0 : 100 - (100 / (1 + up / down))
    rsi_res    = request.security(syminfo.tickerid, res, rsi)
    rsi_change = rsi_res - rsi_res[1]
    rsi_index  = 0
    if( rsi_res > 70 and rsi_change < 0 )
        rsi_index := -1
    if( rsi_res < 30 and rsi_change > 0  )
        rsi_index := 1
    rsi_index

// STOCH indicator – main line < lower band (20) and main line crosses the signal line from bottom-up
// STOCH indicato  – main line > upper band (80) and main line crosses the signal line from above-down
calc_stoch_index(len_k, len_d, smoothK, res) =>
    stoch_k     = sma(stoch(close, high, low, len_k), smoothK)
    stoch_d     = sma(stoch_k, len_d)
    res_stoch_k = request.security(syminfo.tickerid, res, stoch_k)
    res_stoch_d = request.security(syminfo.tickerid, res, stoch_d)
    spread      = (res_stoch_k/res_stoch_d -1)*100
    stoch_index = 0
    if( res_stoch_k > 80 and spread < 0 )
        stoch_index := -1
    if( res_stoch_k < 20 and spread > 0  )
        stoch_index := 1
    stoch_index

// CCI indicator – indicator < oversold level (-100) and reversed upwards
// CCI indicator – indicator > overbought level (100) and reversed downwards
calc_cci_index(len, src, res) =>
    cci_ma     = sma(src, len)
    cci        = (src - cci_ma) / (0.015 * dev(src, len))
    cci_res    = request.security(syminfo.tickerid, res, cci)
    cci_change = cci_res - cci_res[1]
    cci_index  = 0
    if( cci_res > 100 and cci_change > 0 )
        cci_index := -1
    if( cci_res < -100 and cci_change < 0  )
        cci_index := 1
    cci_index

//AWESOME OSCILLATOR – saucer and values are greater than 0 or zero line cross from bottom-up - BUY
//AWESOME OSCILLATOR – saucer and values are lower than 0 or zero line cross from above-down  - SELL
calc_awesome_index(src, res) =>
    ao        = sma(hl2,5) - sma(hl2,34)
    ao_res    = request.security(syminfo.tickerid, res, ao)
    ao_change = ao_res - ao_res[1]
    ao_index  = 0
    if( ao_res > 0 and ao_change > 0 )
        ao_index := 1
    if( ao_res < 0 and ao_change < 0 )
        ao_index := -1
    ao_index

// Momentum indicator - indicator values are rising  - BUY
// Momentum indicator - indicator values are falling - SELL
calc_momentum_index(len, src, res) =>
    mom       = src - src[len]
    res_mom   = request.security(syminfo.tickerid, res, mom)
    mom_index = 0
    if res_mom>= 0
        mom_index := 1
    if res_mom <= 0
        mom_index := -1
    mom_index

// MACD - main line values > signal line values  - BUY
// MACD - main line values < signal line values - SELL
calc_macd_index(macd_fast, macd_slow, src, res) =>
    macd       = ema(src, macd_fast) - ema(src, macd_slow)
    res_macd   = request.security(syminfo.tickerid, res, macd)
    macd_index = 0
    if res_macd>= 0
        macd_index := 1
    if res_macd <= 0
        macd_index := -1
    macd_index

//STOCHRSI - main line < lower band (20) and main line crosses the signal line from bottom-up
//STOCHRSI - main line > upper band (80) and main line crosses the signal line from above-down
calc_stochrsi_index(len_rsi, len_stoch, smoothK, smoothD, src, res) =>
    rsi     = rsi(src, len_rsi)
    stoch_k = sma(stoch(rsi, rsi, rsi, len_stoch), smoothK)
    stoch_d = sma(stoch_k, smoothD)
    res_stoch_k = request.security(syminfo.tickerid, res, stoch_k)
    res_stoch_d = request.security(syminfo.tickerid, res, stoch_d)
    spread  = (res_stoch_k/res_stoch_d -1)*100
    stochrsi_index = 0
    if( res_stoch_k > 80 and spread < 0 )
        stochrsi_index := -1
    if( res_stoch_k < 20 and spread > 0  )
        stochrsi_index := 1
    stochrsi_index

//Williams % Range  - line is above -20 and values are dropping - Overbough conditions - SELL
//Williams % Range  - line is below -80 and values are rising   - Oversold conditions  - BUY
calc_wpr_index(len, src, res) =>
    wpr_upper = highest(len)
    wpr_lower = lowest(len)
    wpr = 100 * (src - wpr_upper) / (wpr_upper - wpr_lower)
    wpr_res = request.security(syminfo.tickerid, res, wpr)
    wpr_change = wpr_res - wpr_res[1]
    wpr_index = 0
    if( wpr_res < -80 and wpr_change > 0 )
        wpr_index := 1
    if( wpr_res > -20 and wpr_change < 0 )
        wpr_index := -1
    wpr_index

//Ultimate Oscillator - line is above -20 and values are dropping - Overbough conditions - SELL
//Ultimate Oscillator - line is below -80 and values are rising   - Oversold conditions  - BUY
average(bp, tr_, length) => sum(bp, length) / sum(tr_, length)

calc_uo_index(len7, len14, len28, res) =>
    high_ = max(high, close[1])
    low_ = min(low, close[1])
    bp = close - low_
    tr_ = high_ - low_
    avg7 = average(bp, tr_, len7)
    avg14 = average(bp, tr_, len14)
    avg28 = average(bp, tr_, len28)
    uo = 100 * (4*avg7 + 2*avg14 + avg28)/7
    uo_res = request.security(syminfo.tickerid, res, uo)
    uo_index = 0
    if uo_res >= 70
        uo_index := 1
    if uo_res <= 30
        uo_index := -1
    uo_index

//Average Directional Index - indicator > 20 and +DI line crossed -DI line from bottom-up
//Average Directional Index - indicator > 20 and +DI line crossed -DI line from above-down
dirmov(len) =>
	up = change(high)
	down = -change(low)
	truerange = rma(tr, len)
	plus = fixnan(100 * rma(up > down and up > 0 ? up : 0, len) / truerange)
	minus = fixnan(100 * rma(down > up and down > 0 ? down : 0, len) / truerange)
	[plus, minus]

adx(dilen, adxlen) =>
	[plus, minus] = dirmov(dilen)
	sum = plus + minus
	adx = 100 * rma(abs(plus - minus) / (sum == 0 ? 1 : sum), adxlen)

adxHigh(dilen, adxlen) =>
	[plus, minus] = dirmov(dilen)
	plus

adxLow(dilen, adxlen) =>
	[plus, minus] = dirmov(dilen)
	minus

calc_adx_index(res) =>
    sig         = adx(dilen, adxlen) //ADX
    sigHigh     = adxHigh(dilen, adxlen) // DI+
    sigLow      = adxLow(dilen, adxlen) // DI-
    res_sig     = request.security(syminfo.tickerid, res, sig)
    res_sigHigh = request.security(syminfo.tickerid, res, sigHigh)
    res_sigLow  = request.security(syminfo.tickerid, res, sigLow)
    spread      = (res_sigHigh/res_sigLow  -1)*100
    adx_index   = 0
    if res_sig >= 20 and spread > 0
        adx_index := 1
    if res_sig >= 20 and spread < 0
        adx_index := -1
    adx_index

//Bull Bear Power Index - bear power is below 0 and is weakening -> BUY
//Bull Bear Power Index - bull power is above 0 and is weakening -> SELL
calc_bbp_index(len, src, res ) =>
    ema   = ema(src, len)
    bulls = high - ema
    bears = low  - ema
    bulls_res = request.security(syminfo.tickerid, res, bulls)
    bears_res = request.security(syminfo.tickerid, res, bears)
    sum = bulls_res + bears_res
    bbp_index = 0
    if bears_res < 0 and bears_res > bears_res[1]
        bbp_index := 1
    if bulls_res > 0 and bulls_res < bulls_res[1]
        bbp_index := -1
    bbp_index

// --------------------------------MOVING AVERAGES CALCULATION------------------------------------- //
sma10_index  = calc_sma_index(sma10,  src, res)
sma20_index  = calc_sma_index(sma20,  src, res)
sma30_index  = calc_sma_index(sma30,  src, res)
sma50_index  = calc_sma_index(sma50,  src, res)
sma100_index = calc_sma_index(sma100, src, res)
sma200_index = calc_sma_index(sma200, src, res)
ema10_index  = calc_ema_index(ema10,  src, res)
ema20_index  = calc_ema_index(ema20,  src, res)
ema30_index  = calc_ema_index(ema30,  src, res)
ema50_index  = calc_ema_index(ema50,  src, res)
ema100_index = calc_ema_index(ema100, src, res)
ema200_index = calc_ema_index(ema200, src, res)
hull9_index  = calc_ema_index(hma9,   src, res)
vwma20_index = calc_ema_index(vwma20, src, res)

ichimoku_index = 0.0 //Ichimoku - is not active in the calculation brought to you by TV TEAM for the lolz
moving_averages_index = ( ema10_index + ema20_index + ema30_index + ema50_index + ema100_index + ema200_index +
						  sma10_index + sma20_index + sma30_index + sma50_index + sma100_index + sma200_index +
                          ichimoku_index + vwma20_index + hull9_index ) / 15

// -----------------------------------OSCILLATORS CALCULATION----------------------------------------- //
rsi_index       = calc_rsi_index(rsi_len, src, res)
stoch_index     = calc_stoch_index(stoch_k, stoch_d, stoch_smooth, res)
cci_index       = calc_cci_index(cci_len, src, res)
ao_index        = calc_awesome_index(src, res)
mom_index       = calc_momentum_index(momentum_len, src, res)
macd_index      = calc_macd_index(macd_fast, macd_slow, src, res)
stochrsi_index  = calc_stochrsi_index(rsi_len, stoch_k, stoch_d, stoch_smooth, src, res)
wpr_index       = calc_wpr_index(wpr_length, src, res)
uo_index        = calc_uo_index(uo_length7, uo_length14, uo_length28, res)
adx_index       = calc_adx_index(res)
bbp_index       = calc_bbp_index(bbp_len , src, res)

oscillators_index = ( rsi_index + stoch_index + adx_index + cci_index + stochrsi_index + ao_index + mom_index + macd_index + wpr_index + uo_index + bbp_index )	/ 11

rating_index = ( moving_averages_index + oscillators_index ) / 2

plot(moving_averages_index, color=green, linewidth = 1, title="Moving Averages Rating",transp = 70)
plot(oscillators_index    , color=blue,  linewidth = 1, title="Oscillators Rating",transp = 70)
plot(rating_index         , color=orange,   linewidth = 2, title="Rating")

strongbuy       = hline(1,   "Strong Buy" , color=silver )
buy             = hline(0.5, "Strong Buy" , color=green  )
normal          = hline(0,   "Buy/Sell"   , color=silver )
sell            = hline(-0.5,"Strong Sell", color=red    )
strongsell      = hline(-1,  "Strong Sell", color=silver )

fill(strongbuy,buy,   color=green,   transp=90)
fill(buy,normal,      color=#b2ffb2, transp=90)
fill(sell,normal,     color=#F08080, transp=90)
fill(strongsell,sell, color=red,     transp=90)

longCondition = rating_index > 0
if (longCondition)
    strategy.entry("My Long Entry Id", strategy.long)

shortCondition = rating_index < 0
if (shortCondition)
    strategy.entry("My Short Entry Id", strategy.short)