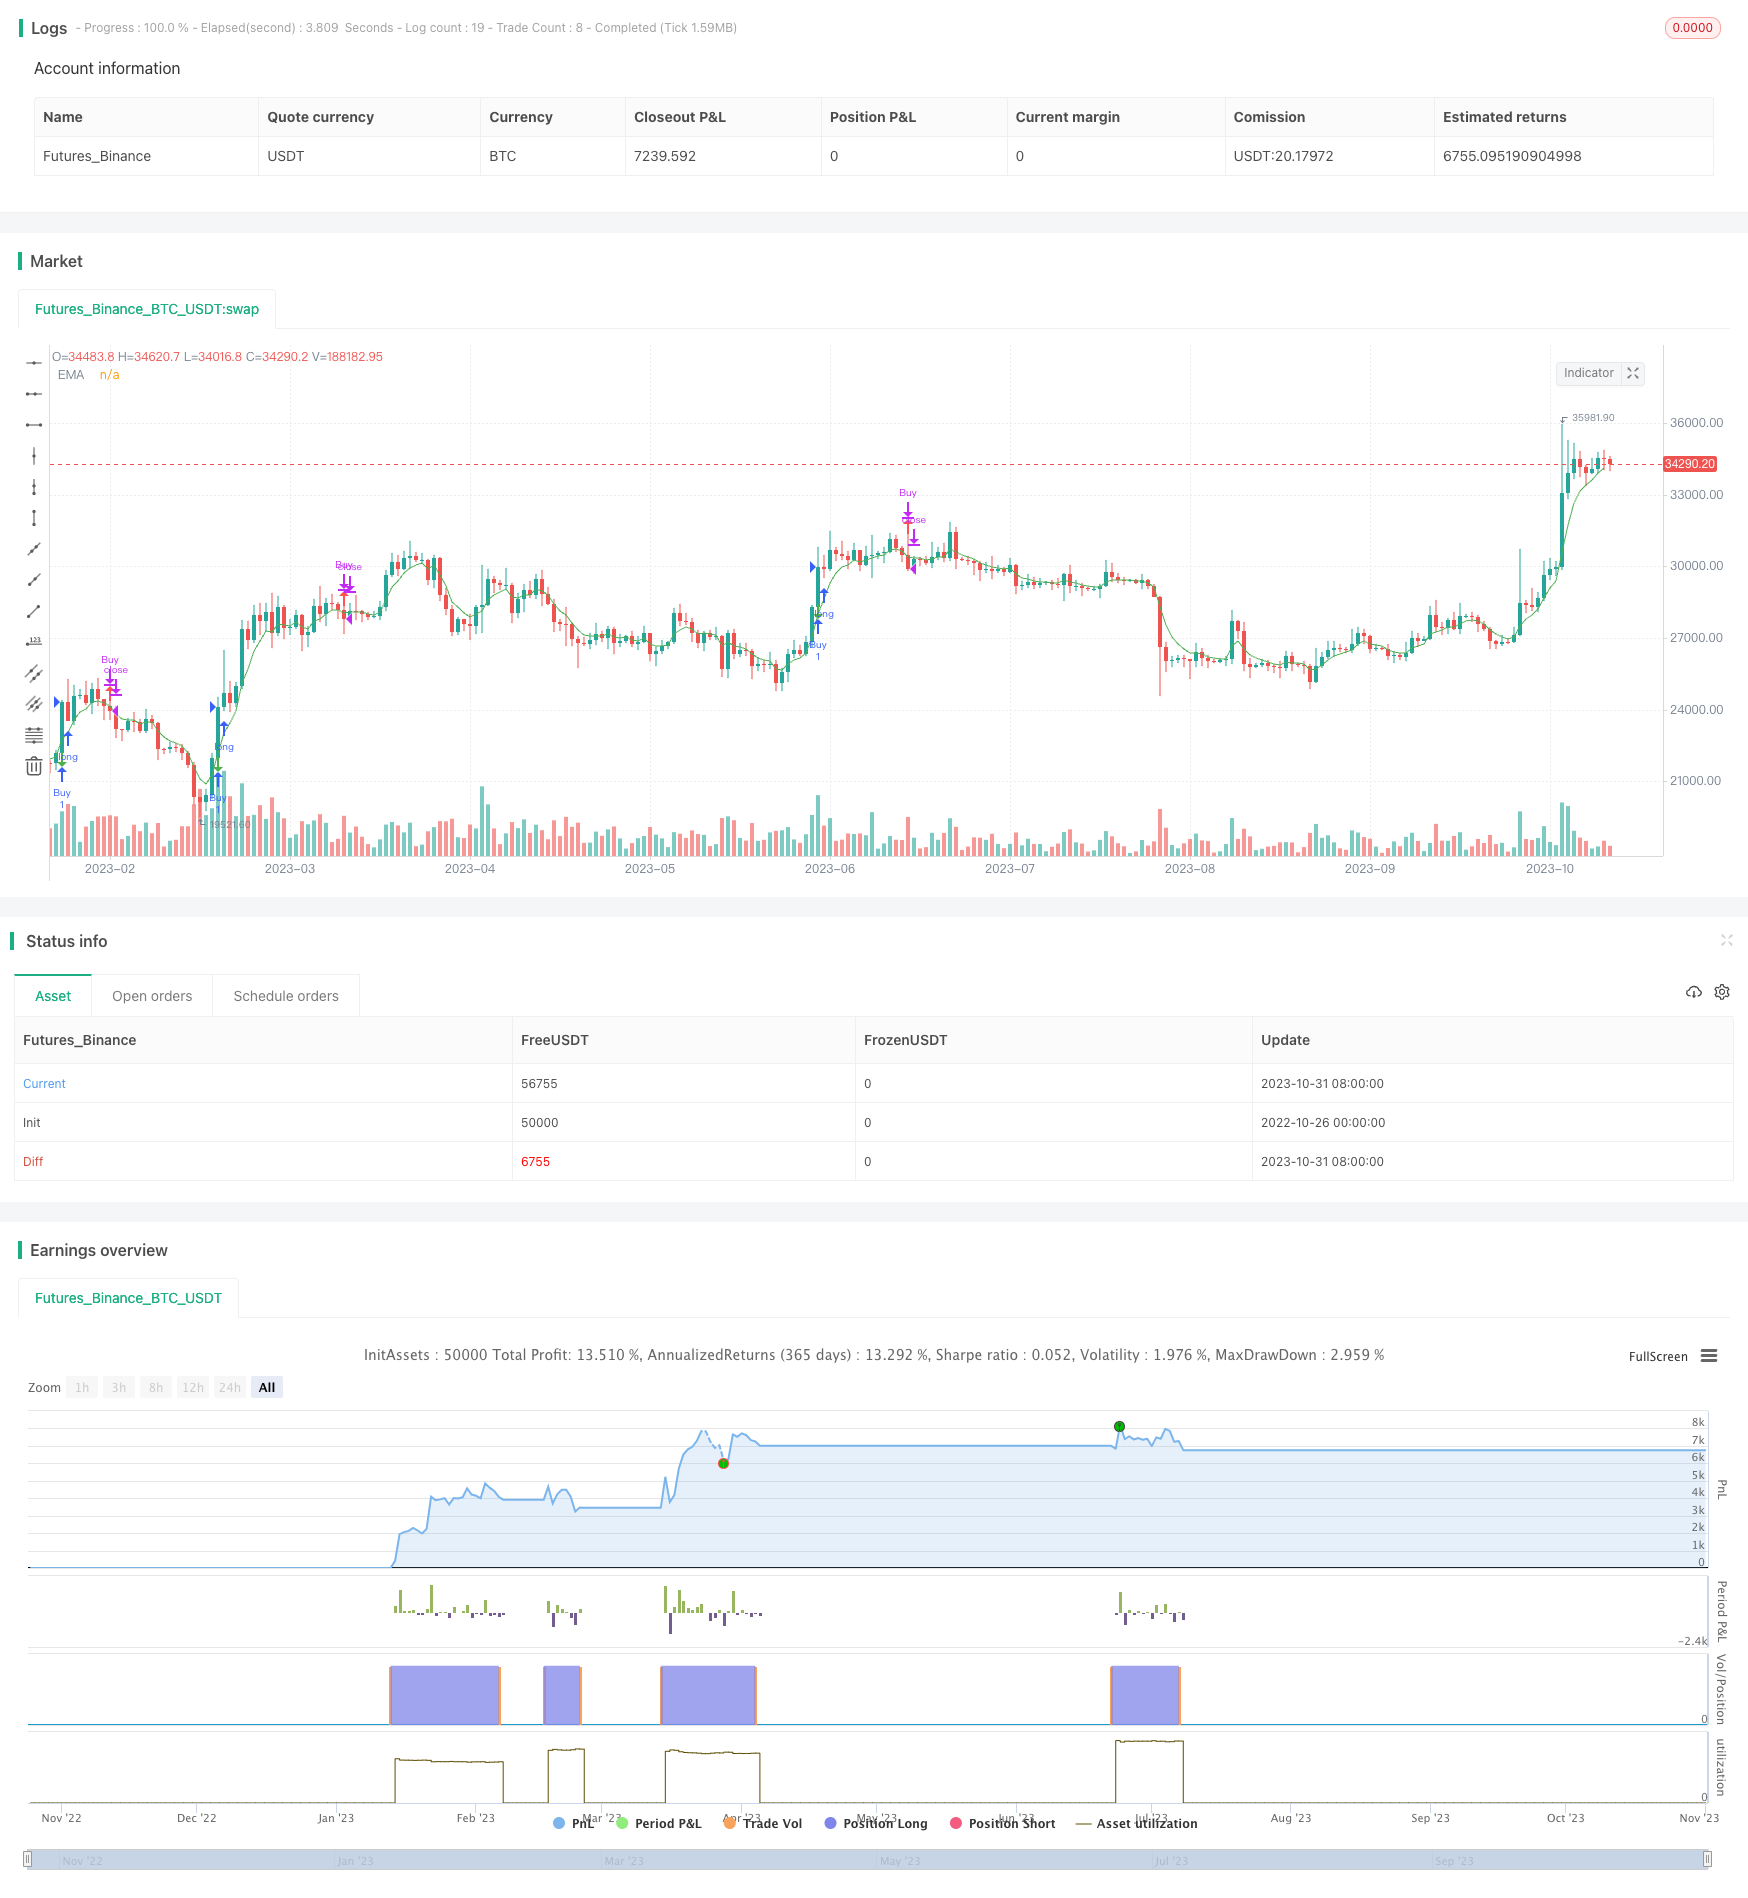
개요
동적 크로스 시트 효율적인 수익 전략은 크로스 시트 거래 원칙과 동적 지표를 통합하여 중기 금융 시장에서 수익 기회를 잡기 위해 고안된 정량 거래 전략이다. 이 전략은 이동 평균, 가로 지르는 신호 및 거래량 분석과 같은 여러 가지 기술 지표의 조합을 사용하여 구매 및 판매 신호를 생성한다. 전략의 목표는 시장 추세를 식별하고 가격 움직임으로 인한 수익을 잡는 것이다.
전략 원칙
구매 신호는 A1, A2, A3, XG 및 WeeklySlope를 포함한 여러 요소의 통합적 고려에 따라 결정됩니다. 구체적으로 살펴보면:
A1 조건: 특정 가격 관계를 검사하여 최고 가격과 종결 가격의 비율이 1.03보다 작고, 오픈 가격과 최저 가격의 비율이 1.03보다 작고, 최고 가격과 전날 종결 가격의 비율이 1.06보다 크다는 것을 확인합니다. 이 조건은 잠재적인 다중 동력을 나타내는 특정 패턴을 찾습니다.
A2 조건: 종전 가격과 관련된 가격 관계를 검사하고, 종전 가격과 개시 가격의 비율이 1.05 이상인 것을 확인하거나, 종전 가격과 전날 종전 가격의 비율이 1.05 이상인 것을 확인한다. 이 조건은 상승 가격 운동과 동력의 징후를 찾는다.
A3 조건: 거래량에 주목하고, 현재 거래량이 지난 60주기의 최고 거래량을 돌파했는지 확인한다. 이 조건은 물가 증가를 식별하고 잠재적인 상승 동력이 강하다는 것을 확인하기 위해 마련되었다.
조건 XG: 조건 A1 및 조건 A2를 결합하여, 현재 K선과 이전 K선 동시에 충족되는지 확인한다. 또한, 5주기 EMA의 비율이 9주기 SMA의 동일한 비율을 뚫고 있는지 확인한다. 이 조건은 여러 요소가 동시에 제안하는 구매 신호를 식별하는 데 도움이됩니다.
주기선 트렌드 인자: 주기선 그래프 상의 50주기 SMA의 기울기를 계산하고, 기울기가 긍정인지 확인하여 전체적으로 주기선 상승 추세에 있음을 나타냅니다. 이 조건은 주식이 전체적으로 상승 경로에 있음을 추가적으로 확인합니다.
이러한 조건이 동시에 충족되면, 구매 조건이 발생하여, 이 시점에 거래가 가능한 초과 수익을 얻을 수 있는 좋은 기회가 있음을 알려줍니다.
판매 조건은 비교적 간단하며, 단지 종결 가격이 10주기 EMA를 넘지 않았는지 확인하는 것뿐이다. 이 조건은 반전 또는 다중자동 운동이 약해지는 신호를 提示한다.
전략적 이점
- 다양한 전략적 사고를 통합하는 도시 간 거래와 동력 지표
- 여러 기술 지표의 조합을 최적화하여 높은 확률의 거래 기회를 식별합니다.
- 포지션 스케일 제어 및 스톱 로스 기술을 사용하여 리스크 관리를 수행합니다.
- 회수 성과가 좋으며, 상당한 순이익과 승률을 기록했다.
전략적 위험
- 다중이 우세할 때 효과가 좋고, 공허가 적응할 수 없다.
- 가짜 해킹으로 인해 잘못된 거래가 발생할 수 있습니다.
- 잘못된 포지션 규모와 스톱 로즈 설정으로 손실을 확대할 수 있습니다.
- 다른 시장 환경에 따라 적절한 변수를 조정해야 합니다.
전략 최적화
- 필터 지수를 늘리고 신호 품질을 향상시킵니다.
- 손실을 추적하는 것과 같은 손실을 최적화하는 방법
- 동적으로 포지션 규모를 조정합니다.
- 기계 학습과 결합하여 파라미터 최적화 효과를 높인다.
요약하다
동력 크로스 시티 효율적인 수익 전략은 종합적으로 크로스 시티 거래 사상과 동력 지표를 적용하고, 변수 최적화, todolist 통합 판단 조건을 통해 재검토에서 상당한 수익을 얻는 양적 거래 전략을 달성했다. 이 전략은 중기 가격 추세를 잡는 것이 좋지만 추세 반전의 위험을 경계해야한다. 추가 최적화를 통해 전략의 안정성과 실적 성능을 더욱 향상시킬 수 있다.
/*backtest
start: 2022-10-26 00:00:00
end: 2023-11-01 00:00:00
period: 1d
basePeriod: 1h
exchanges: [{"eid":"Futures_Binance","currency":"BTC_USDT"}]
*/

// This source code is subject to the terms of the Mozilla Public License 2.0 at https://mozilla.org/MPL/2.0/
// © fzj20020403
//@version=5
strategy("Slight Swing Momentum Strategy.", overlay=true)

// Position Status Definition
var inPosition = false

// Moving Average Definition
ma60 = ta.sma(close, 60)

// A1 Condition Definition
A1 = high / close < 1.03 and open / low < 1.03 and high / close[1] > 1.06

// A2 Condition Definition
A2 = close / open > 1.05 or close / close[1] > 1.05

// A3 Condition Definition
highestVol = ta.highest(volume, 60)
A3 = ta.crossover(volume, highestVol[1])

// B1 Condition Definition
ema5 = ta.ema(close, 5)
B1 = close / ema5

// XG Condition Definition
A1andA2 = (A1 and A2) and (A1[1] and A2[1])
XG = ta.crossover(B1, ta.sma(B1, 9))

// Weekly Trend Factor Definition
weeklyMa = ta.sma(close, 50)
weeklySlope = (weeklyMa - weeklyMa[4]) / 4 > 0

// Buy Signal using XG Condition
buySignal = A1 and close > ma60 or A2 and A3 and XG and close > ma60 and weeklySlope

// Sell Signal Condition
sellSignal = close < ta.ema(close, 10)

// Buy and Sell Conditions
buyCondition = buySignal and not inPosition
sellCondition = sellSignal and inPosition

// Execute Buy and Sell Operations
if (buyCondition)
    strategy.entry("Buy", strategy.long)
    inPosition := true
if (sellCondition)
    strategy.close("Buy")
    inPosition := false

// Stop Loss and Take Profit Levels
stopLoss = strategy.position_avg_price * 0.5
takeProfit = strategy.position_avg_price * 1.30

// Apply Stop Loss and Take Profit Levels
if inPosition
    strategy.exit("Long Stop Loss", "Buy", stop=stopLoss)
    strategy.exit("Long Take Profit", "Buy", limit=takeProfit)

// Plot Buy and Sell Signal Shapes
plotshape(buyCondition, style=shape.arrowdown, location=location.belowbar, color=color.green, size=size.small)
plotshape(sellCondition, style=shape.arrowup, location=location.abovebar, color=color.red, size=size.small)

// EMA Variable Definition
ema = ta.ema(close, 5)

// Plot Indicator Line
plot(ema, color=color.green, title="EMA")