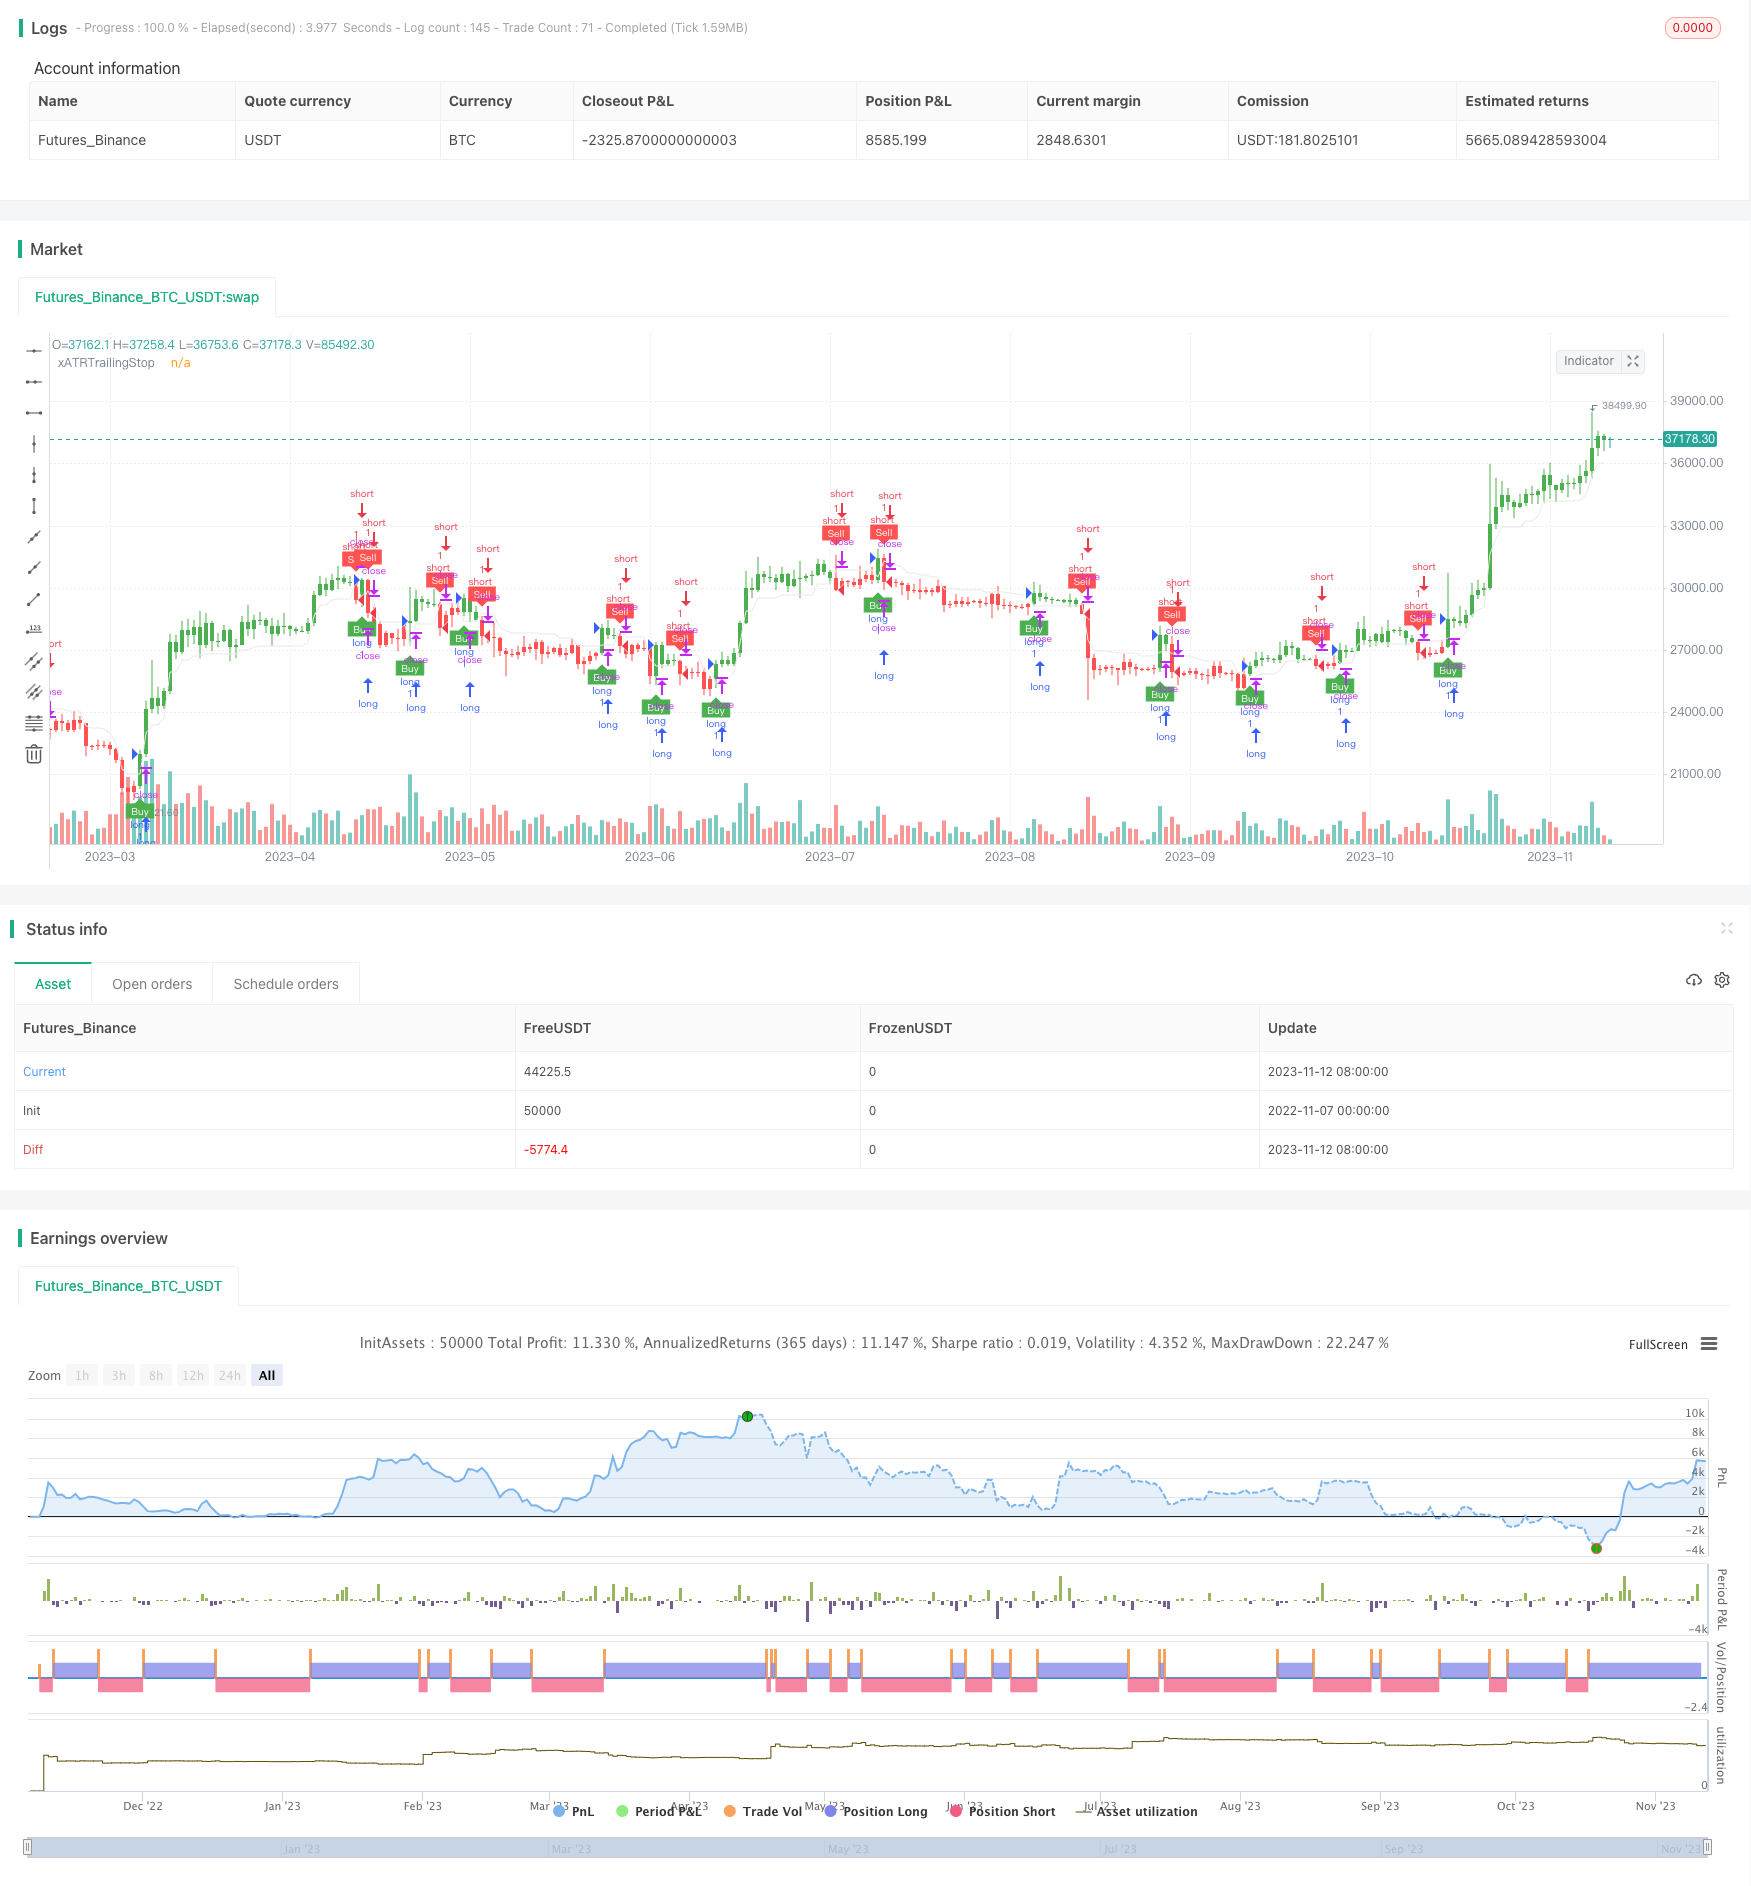
모멘텀 브레이크업 전략
저자:차오장, 날짜: 2023-11-14 11:19:05태그:

전반적인 설명
이 전략은 신호를 결정하기 위해 ATR 지표와 EMA 라인과 결합한 볼링거 밴드를 사용합니다. 가격이 볼링거 상단계를 통과하고 EMA 라인을 빠르게 넘을 때 구매 신호를 생성합니다. 가격이 볼링거 하단계를 통과하고 EMA 라인을 빠르게 넘을 때 판매 신호를 생성합니다. ATR 지표는 스톱 로스를 설정하는 데 사용됩니다.
전략 논리
-
볼링거 중선, 상단 및 하단 밴드를 계산합니다. 중선은 n 기간 SMA, 상단은 중선 + m입니다.n-period 표준편차, 하단역은 중간선 - mn-period 표준편차
-
스톱 로스를 추적하기 위한 ATR 표시기를 계산합니다.
-
가격 동력을 결정하기 위해 1주기 및 n주기 EMA 라인을 계산합니다.
-
가격이 볼링거 상단과 EMA 라인을 빠르게 넘으면 구매 신호가 생성됩니다.
-
가격이 볼링거 하위 대역과 EMA 라인을 빠르게 넘으면 판매 신호가 생성됩니다.
-
ATR 지표는 스톱 로스 포인트를 설정하고, 포착되지 않도록 가격 브레이크오웃 방향을 추적합니다.
이점 분석
-
ATR 스톱 로스로 결합된 볼링거 밴드는 위험을 효과적으로 제어할 수 있습니다.
-
빠른 EMA와 느린 EMA는 모멘텀 방향을 결정합니다.
-
조정 가능한 매개 변수는 다른 시장 환경에 적합합니다.
-
거래 빈도가 높은 명확한 구매/판매 신호, 단기 거래에 적합합니다.
-
ATR 지표는 적시에 손실을 멈추는 것을 추적합니다.
위험 분석
-
좁은 볼링거 밴드 범위는 더 시끄러운 거래를 일으킬 수 있습니다.
-
ATR 매개 변수가 너무 작게 설정되면 너무 가까운 스톱 손실이 발생하여 함정에 빠질 수 있습니다.
-
EMA 매개 변수들은 다른 주기의 효과에 따라 조정되어야 합니다.
-
오스실레이션 시장은 더 많은 거래를 일으킬 수 있어 조심해야 합니다.
-
스톱 로즈를 추적하는 것은 때로는 너무 공격적이어서 손실 확장을 유발할 수 있습니다.
최적화
-
다른 지표와 결합하여 거래 신호를 필터링합니다. 예를 들어, 과잉 구매/ 과잉 판매의 RSI, 오차의 KDJ 등.
-
ATR에 기반한 볼링거 매개 변수를 가격 변동에 맞게 동적으로 조정하는 것을 고려하십시오.
-
가장 좋은 매개 변수 조합을 위해 다른 EMA 사이클 매개 변수를 테스트합니다.
-
공격적인 스톱 손실을 피하기 위해 변동성에 따라 ATR 매개 변수를 지능적으로 조정합니다.
-
구매/판매 결정의 시기를 돕기 위해 딥러닝 모델을 적용하는 것을 고려하십시오.
요약
이 전략은 가격 브레이크우트를 캡처하기 위해 볼링거 밴드를 활용하고, 스톱 로스 범위를 설정하기 위해 ATR, 임멘텀 브레이크우트의 포괄적인 판단을 위해 동력 방향을 결정하기 위해 EMA를 사용하여 명확한 논리를 가지고 있으며, 이는 단기 가격 트렌드를 효과적으로 캡처 할 수 있습니다. 포괄적 인 판단을 위해 여러 지표를 결합하면 신호 품질을 향상시킬 수 있습니다. 더 많은 안정성과 탄력을 위해 이 전략을 더욱 정제하기 위해 매개 변수 조정, 지표 조합 등을 통해 최적화 할 여지가 있습니다.
/*backtest
start: 2022-11-07 00:00:00
end: 2023-11-13 00:00:00
period: 1d
basePeriod: 1h
exchanges: [{"eid":"Futures_Binance","currency":"BTC_USDT"}]
*/

//@version=4
strategy(title="UT Bot Strategy", overlay = true)
//CREDITS to HPotter for the orginal code. The guy trying to sell this as his own is a scammer lol.
// Inputs
a = input(1,     title = "Key Vaule. 'This changes the sensitivity'")
c = input(10,    title = "ATR Period")
h = input(false, title = "Signals from Heikin Ashi Candles")

src = h ? security(heikinashi(syminfo.tickerid), timeframe.period, close, lookahead = false) : close

length = input(20, minval=1)
mult = input(2.0, minval=0.001, maxval=50, title="StdDev")
basis = sma(src, length)
dev = mult * stdev(src, length)
upper = basis + dev
lower = basis - dev
bbr = (src - lower)/(upper - lower)
// plot(bbr, "Bollinger Bands %B", color=#26A69A)
// band1 = hline(1, "Overbought", color=#787B86, linestyle=hline.style_dashed)
// hline(0.5, "Middle Band", color=color.new(#787B86, 50))
// band0 = hline(0, "Oversold", color=#787B86, linestyle=hline.style_dashed)
// fill(band1, band0, color=color.rgb(38, 166, 154, 90), title="Background")


xATR  = atr(c)
nLoss = a * xATR


xATRTrailingStop = 0.0
xATRTrailingStop := iff(src > nz(xATRTrailingStop[1], 0) and src[1] > nz(xATRTrailingStop[1], 0), max(nz(xATRTrailingStop[1]), src - nLoss),
   iff(src < nz(xATRTrailingStop[1], 0) and src[1] < nz(xATRTrailingStop[1], 0), min(nz(xATRTrailingStop[1]), src + nLoss),
   iff(src > nz(xATRTrailingStop[1], 0), src - nLoss, src + nLoss)))

pos = 0
pos :=	iff(src[1] < nz(xATRTrailingStop[1], 0) and src > nz(xATRTrailingStop[1], 0), 1,
   iff(src[1] > nz(xATRTrailingStop[1], 0) and src < nz(xATRTrailingStop[1], 0), -1, nz(pos[1], 0)))

xcolor = pos == -1 ? color.red: pos == 1 ? color.green : color.blue

ema   = ema(src,1)
emaFast   = ema(src,144)
emaSlow   = ema(src,576)
sma       =  sma(src, c)

above = crossover(ema, xATRTrailingStop)
below = crossover(xATRTrailingStop, ema)

smaabove = crossover(src, sma)
smabelow = crossover(sma, src)


buy  = src > xATRTrailingStop and above and (bbr>20  or bbr<80)
sell = src < xATRTrailingStop and below  and  (bbr>20  or bbr<80)

// buy  = src > xATRTrailingStop
// sell = src < xATRTrailingStop


barbuy  = src > xATRTrailingStop
barsell = src < xATRTrailingStop

// plot(emaFast , color = color.rgb(243, 206, 127), title="emaFast")

plot(xATRTrailingStop, color = color.rgb(233, 233, 232), title="xATRTrailingStop")

plotshape(buy,  title = "Buy",  text = 'Buy',  style = shape.labelup,   location = location.belowbar, color= color.green, textcolor = color.white, transp = 0, size = size.tiny)
plotshape(sell, title = "Sell", text = 'Sell', style = shape.labeldown, location = location.abovebar, color= color.red,   textcolor = color.white, transp = 0, size = size.tiny)


// plotshape(buy,  title = "Sell",  text = 'Sell',  style = shape.labelup,   location = location.belowbar, color= color.green, textcolor = color.white, transp = 0, size = size.tiny)
// plotshape(sell, title = "buy", text = 'buy', style = shape.labeldown, location = location.abovebar, color= color.red,   textcolor = color.white, transp = 0, size = size.tiny)

barcolor(barbuy  ? color.green : na)
barcolor(barsell ? color.red   : na)

// strategy.entry("short",   false, when = buy)
// strategy.entry("long ", true, when = sell)


strategy.entry("long",   true, when = buy)
strategy.entry("short ", false, when = sell)
- 맥킨리 이동 평균 거래 전략
- 개선된 소용돌이 지표에 기초한 양적 거래 전략
- 멀티 타임프레임 트렌드 추적 전략
- 듀얼 트랙 오시레이터 패턴 전략
- 모멘텀 압축 전략
- MCL-YG 볼링거 밴드 브레이크업 쌍 거래 전략
- 이중 확인 역거래 전략
- 트렌드 역전 추적 중지 손실 전략
- 주말 거래 전략
- ANN 기반의 양적 거래 전략
- 이중 MACD 양적 거래 전략
- 옥수수 이동 평균 균형 거래 전략
- 이중 역입국 전략
- 동력 시장 감정 지표 전략
- 모멘텀 스
브레이크아웃 트렌드 추적 전략 - 역동 MACD 모멘텀은 DMI 브레이크오웃 단기 스칼핑 전략과 얽혀있다
- 볼링거 밴드 범위 거래 전략과 함께 EMA 비율 채널
- 이중 EMA 크로스오버 전략
- 점진적 스톱 로스 움직임 전략
- 변동성 중지와 함께 모멘텀 브레이크 전략