BB21_SMA200 트렌드 다음 전략
저자:차오장, 날짜: 2023-11-16 11:04:42태그:

전반적인 설명
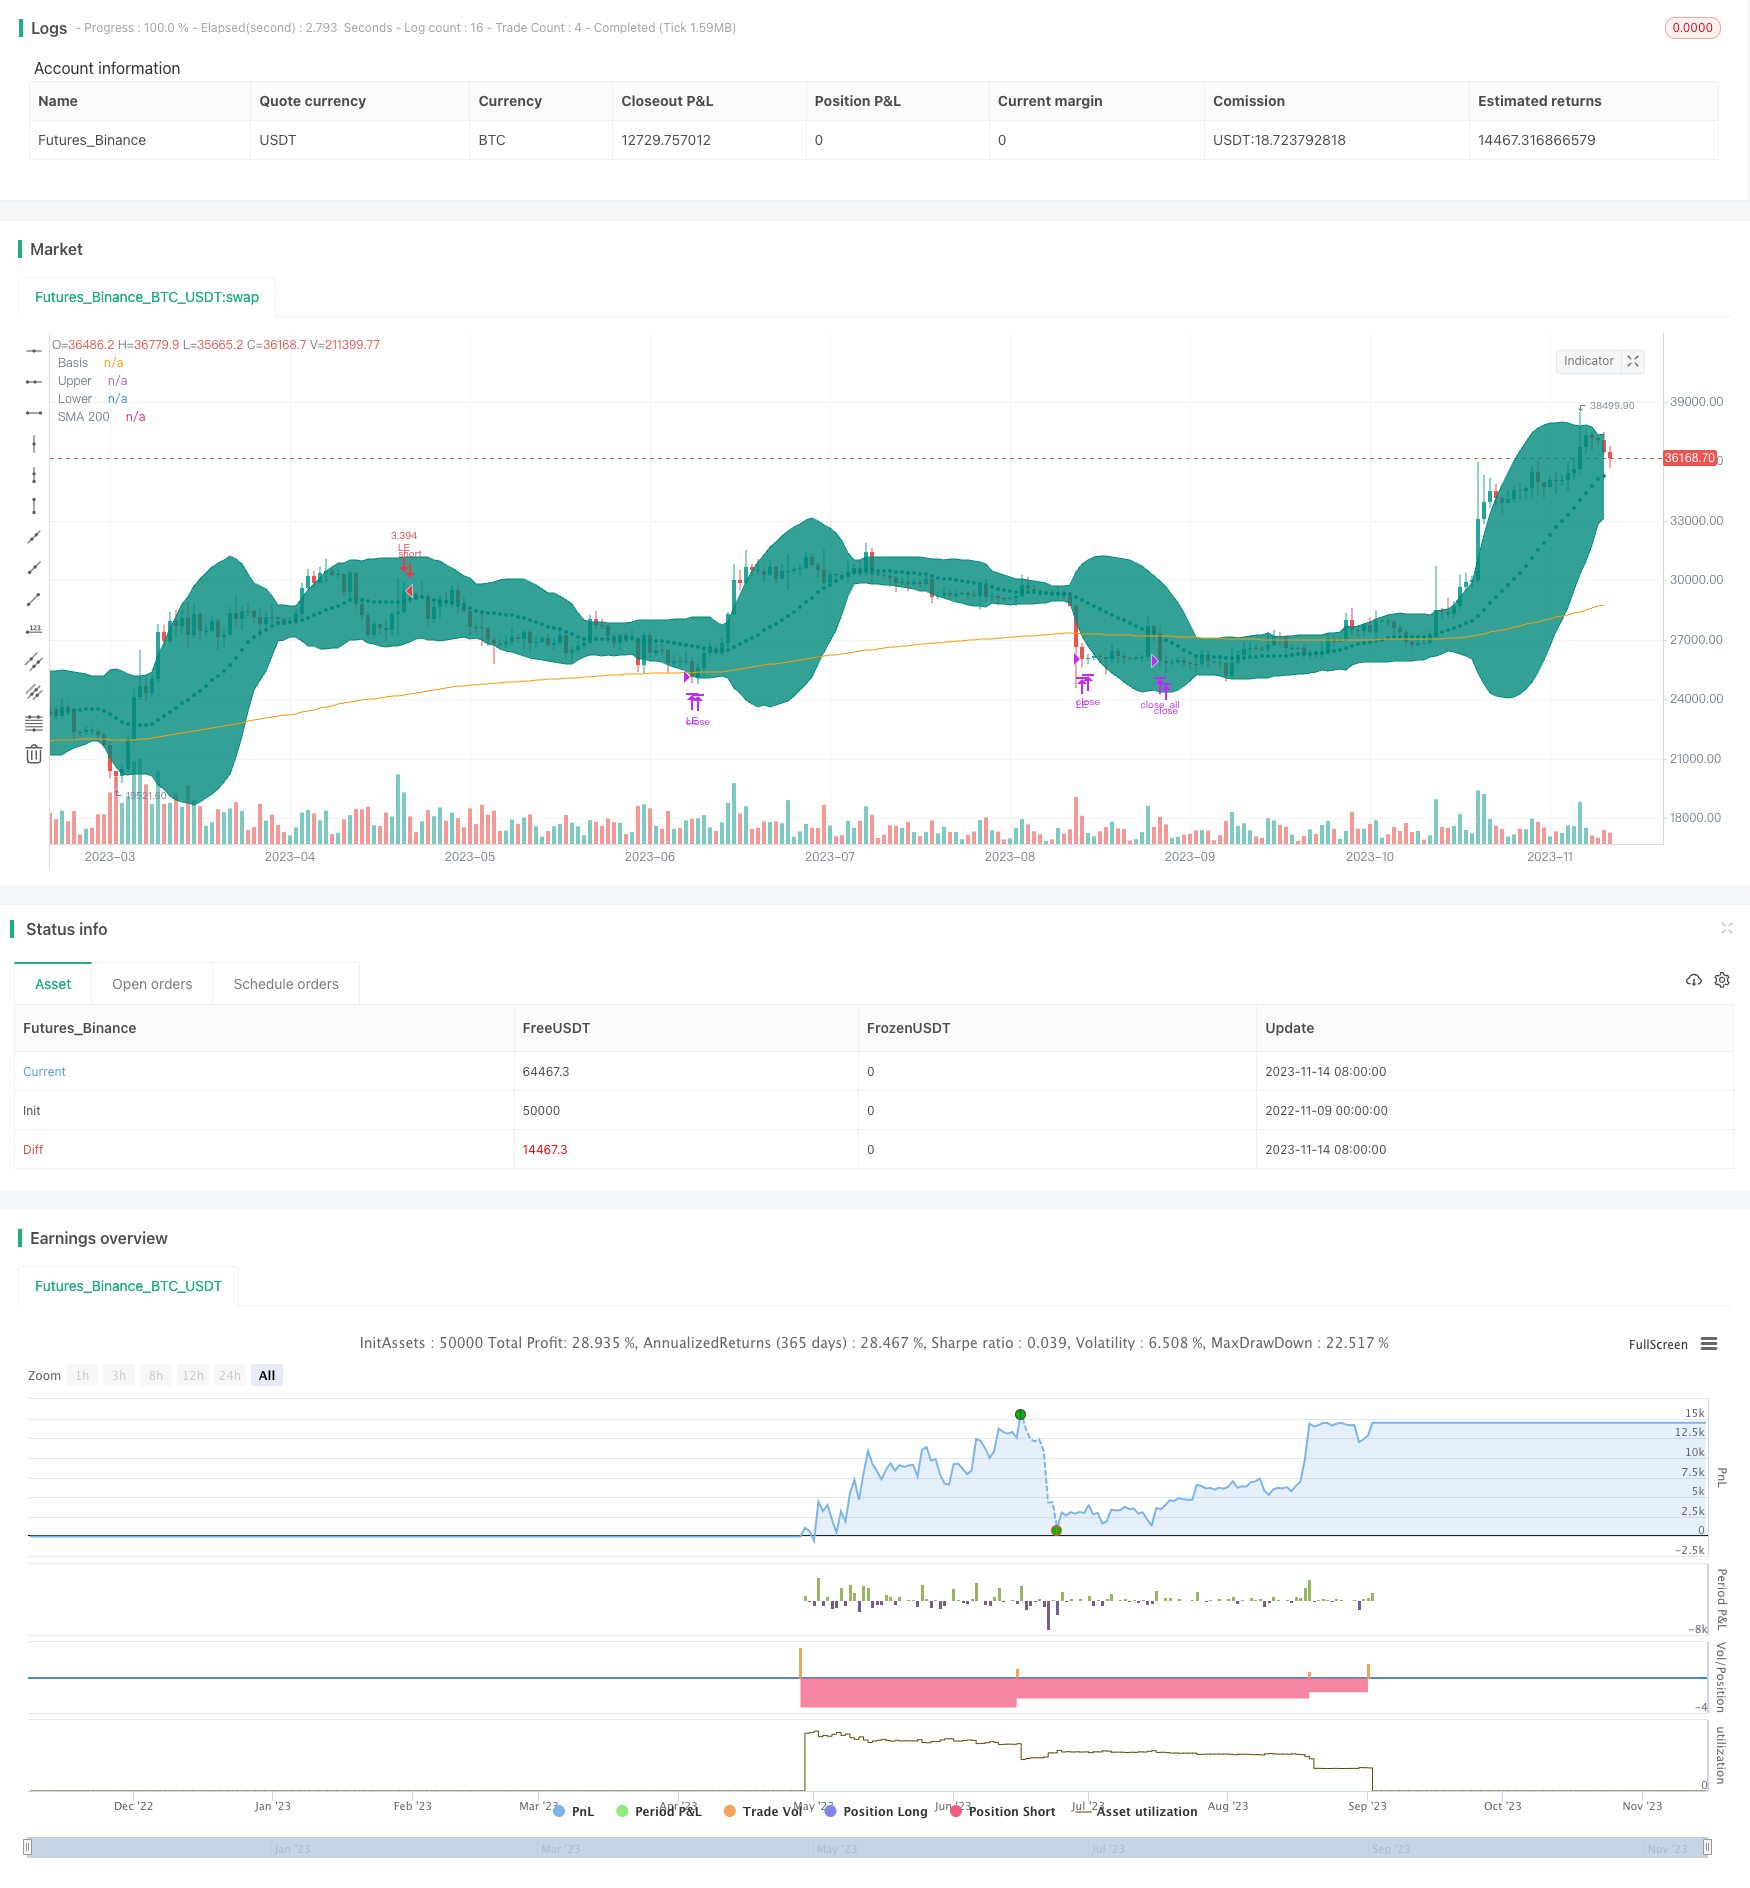
이 전략은 볼링거 밴드와 이동 평균을 결합하여 트레이딩 시스템을 따르는 트렌드를 설계합니다. 가격이 볼링거 밴드의 상단 밴드를 통과하고 하단 밴드가 SMA200보다 높을 때 길게 이동하고, 가격이 하단 밴드를 통과 할 때 부분 포지션을 닫고, 가격이 SMA200 이하로 넘어가면 모두 빠져 나갑니다. 전략은 트렌드를 따라 트렌드가 변할 때 시간적으로 손실을 줄입니다.
전략 논리
- 주요 트렌드를 결정하기 위해 지수적인 이동 평균으로 SMA200를 계산합니다.
- 상단, 중단 및 하단 밴드를 포함하여 볼린거 밴드를 계산하고 수익 범위로 색을 채우십시오.
- 상단 및 하단 양쪽이 SMA200 이상이면 상승 추세를 나타냅니다.
- 가격이 볼링거 밴드의 중간 범위를 넘어올 때, 긴
- 가격이 하위 범위를 넘어서는 경우, 부분 포지션을 닫습니다.
- 가격이 SMA200 아래로 넘어가면 주요 트렌드의 반전을 나타냅니다. 모든 포지션을 닫습니다.
- 과도한 손실을 방지하기 위해 중지 손실 지점을 설정
- 계좌 자본과 수용 가능한 위험에 기초한 거래 규모를 계산합니다.
트렌드를 식별하는 이 전략의 전제는 볼링거 밴드가 SMA200보다 완전히 높아야 하며, 명확한 상승 추세가 나타날 때만 장기화되어야 한다는 것입니다. 하락 추세가 올 때, 위험은 부분적 스톱 손실과 완전한 스톱 손실에 의해 제어됩니다.
이점 분석
- 명확한 트렌드를 식별하기 위해 단일 지표 대신 볼링거 밴드를 사용하십시오.
- SMA200는 주요 트렌드 방향을 결정하고, 범위에 묶인 시장에서 불필요한 거래를 피합니다.
- 트렌드 러닝을 따르는 부분적 스톱 손실
- 손실을 최소화하기 위한 주요 지점에서의 신속한 스톱 로스
- 거래 크기를 계산 한 거래에서 과도한 손실을 방지하기 위해 위험 관리를 도입
위험 분석
- 볼링거 밴드에서 생성된 브레이크아웃 신호는 상대적으로 높은 거짓 신호를 가질 수 있습니다.
- 부분적 스톱 손실 포인트는 조기 스톱 손실을 방지하기 위해 최적화되어야 합니다.
- 스톱 손실 포인트가 너무 좁으면 스톱 손실이 너무 자주 발생 할 수 있습니다.
- SMA 기간을 테스트하고 지연과 감수성을 균형을 맞추기 위해 최적화해야합니다
- 거래 규모를 계산하는 방법은 단일 거래에서 과도한 크기를 방지하기 위해 최적화가 필요할 수 있습니다.
이러한 위험은 볼링거 밴드 매개 변수를 신중하게 테스트하고, 부분 스톱 로스 전략을 최적화하고, SMA 기간을 조정하고, 보다 과학적인 위험 관리 방법을 도입함으로써 감소될 수 있습니다.
최적화 방향
- 잘못된 신호를 낮추기 위해 볼링거 밴드 매개 변수를 테스트하고 최적화합니다.
- 적절한 부분 스톱 손실 포인트를 설정하는 방법을 연구
- 최적의 SMA 기간을 테스트합니다
- 고정 스톱 손실 포인트 대신 적응 스톱을 고려하십시오
- 더 과학적인 거래 규모 계산을 위해 변동성 기반 포지션 사이징을 사용하는 연구
- 실제 거래를 시뮬레이션하기 위해 거래 비용과 백테스트
- 전략의 안정성을 높이기 위해 다른 지표와 결합하는 것을 고려하십시오.
결론
이 전략은 볼링거 밴드와 SMA를 통합하여 비교적 완전한 트렌드 추적 시스템을 설계합니다. 트렌드 존재를 식별하는 데 신뢰할 수 있으며 강력한 트렌드 추적 기능을 가지고 있습니다. 지속적으로 스톱 로스 전략을 최적화하고 신호 오류를 줄이고 과학적 리스크 관리 기술을 도입함으로써 이 전략은 라이브 거래에서 추적 할 수있는 가치있는 시스템이 될 수 있습니다. 양적 거래 전략 설계에 여러 지표를 결합하는 접근 방식을 제공합니다.
/*backtest
start: 2022-11-09 00:00:00
end: 2023-11-15 00:00:00
period: 1d
basePeriod: 1h
exchanges: [{"eid":"Futures_Binance","currency":"BTC_USDT"}]
*/

// This source code is subject to the terms of the Mozilla Public License 2.0 at https://mozilla.org/MPL/2.0/
// © mohanee

//@version=4
strategy(title="BB9_MA200_Strategy", overlay=true, pyramiding=1,     default_qty_type=strategy.cash,  initial_capital=10000, currency=currency.USD)  //default_qty_value=10, default_qty_type=strategy.fixed,


var stopLossVal=0.00

//variables BEGIN
smaLength=input(200,title="MA Length")
bbLength=input(21,title="BB Length")

bbsrc = input(close, title="BB Source")
mult = input(2.0, minval=0.001, maxval=50, title="StdDev")


stopLoss = input(title="Stop Loss%", defval=5, minval=1)

riskCapital = input(title="Risk % of capital  == Based on this trade size is claculated    numberOfShares = (AvailableCapital*risk/100) / stopLossPoints", defval=10, minval=1)


sma200=ema(close,smaLength)

plot(sma200, title="SMA 200", color=color.orange)


//bollinger calculation
basis = sma(bbsrc, bbLength)
dev = mult * stdev(bbsrc, bbLength)
upperBand = basis + dev
lowerBand = basis - dev
offset = input(0, "Offset", type = input.integer, minval = -500, maxval = 500)

//plot bb
plot(basis, "Basis", color=color.teal, style=plot.style_circles , offset = offset)
p1 = plot(upperBand, "Upper", color=color.teal, offset = offset)
p2 = plot(lowerBand, "Lower", color=color.teal, offset = offset)
fill(p1, p2, title = "Background", color=color.teal, transp=95)


strategy.initial_capital = 50000

//Entry---

strategy.entry(id="LE", comment="LE capital="+tostring(strategy.initial_capital + strategy.netprofit ,"######.##"), qty=( (strategy.initial_capital + strategy.netprofit ) * riskCapital / 100)/(close*stopLoss/100) , long=true,  when=strategy.position_size<1 and upperBand>sma200 and lowerBand > sma200 and crossover(close, basis) )     //  // aroonOsc<0  //(strategy.initial_capital * 0.10)/close


barcolor(color=strategy.position_size>=1? color.blue: na)

//partial Exit
tpVal=strategy.position_size>1 ? strategy.position_avg_price * (1+(stopLoss/100) ) : 0.00
strategy.close(id="LE", comment="Partial points="+tostring(close - strategy.position_avg_price, "####.##"),  qty_percent=30 , when=abs(strategy.position_size)>=1 and close>tpVal and crossunder(lowerBand, sma200)   )   //close<ema55 and rsi5Val<20 //ema34<ema55


//close All on stop loss
//stoploss
stopLossVal:=   strategy.position_size>1 ? strategy.position_avg_price * (1-(stopLoss/100) ) : 0.00

strategy.close_all( comment="SL Exit points="+tostring(close - strategy.position_avg_price, "####.##"),  when=abs(strategy.position_size)>=1 and close < stopLossVal  )  //close<ema55 and rsi5Val<20 //ema34<ema55  //close<ema89//

strategy.close_all( comment="BB9 X SMA200 points="+tostring(close - strategy.position_avg_price, "####.##"),  when=abs(strategy.position_size)>=1 and  crossunder(basis, sma200)  )  //close<ema55 and rsi5Val<20 //ema34<ema55  //close<ema89
더 많은
- 하이킨-아시 역전략
- 동적 오스실레이션 브레이크업 전략
- 5분 EMA 크로스오버 전략의 추세
- 전략에 따른 RSI 트렌드
- RSI 격차 전략
- 수량화 된 점진적으로 가중화된 DCA 거래 전략
- 전략에 따른 ATR 지표 트렌드와 결합된 이중 이동 평균 오차
- 멀티 트렌드 전략
- 손익분기 가격 전략
- 단기 거래 전략의 추세
- 모멘텀 이치모쿠 클라우드 거래 전략
- 주말 변동성 거래 전략
- 동력 분출 평균 역전 전략
- 변경된 OBV 및 MACD 양적 거래 전략
- 양량 흐름 지표 기반 트렌드 전략
- 높고 낮은 TEMA 평균의 오스실레이션 전략
- 동적 이동 평균 트렌드 거래 전략
- 평균 역전 동력 전략
- 에너지 지표 거래 전략의 추세
- 성장 생산자 - 전략에 따른 두 가지 RSI 트렌드