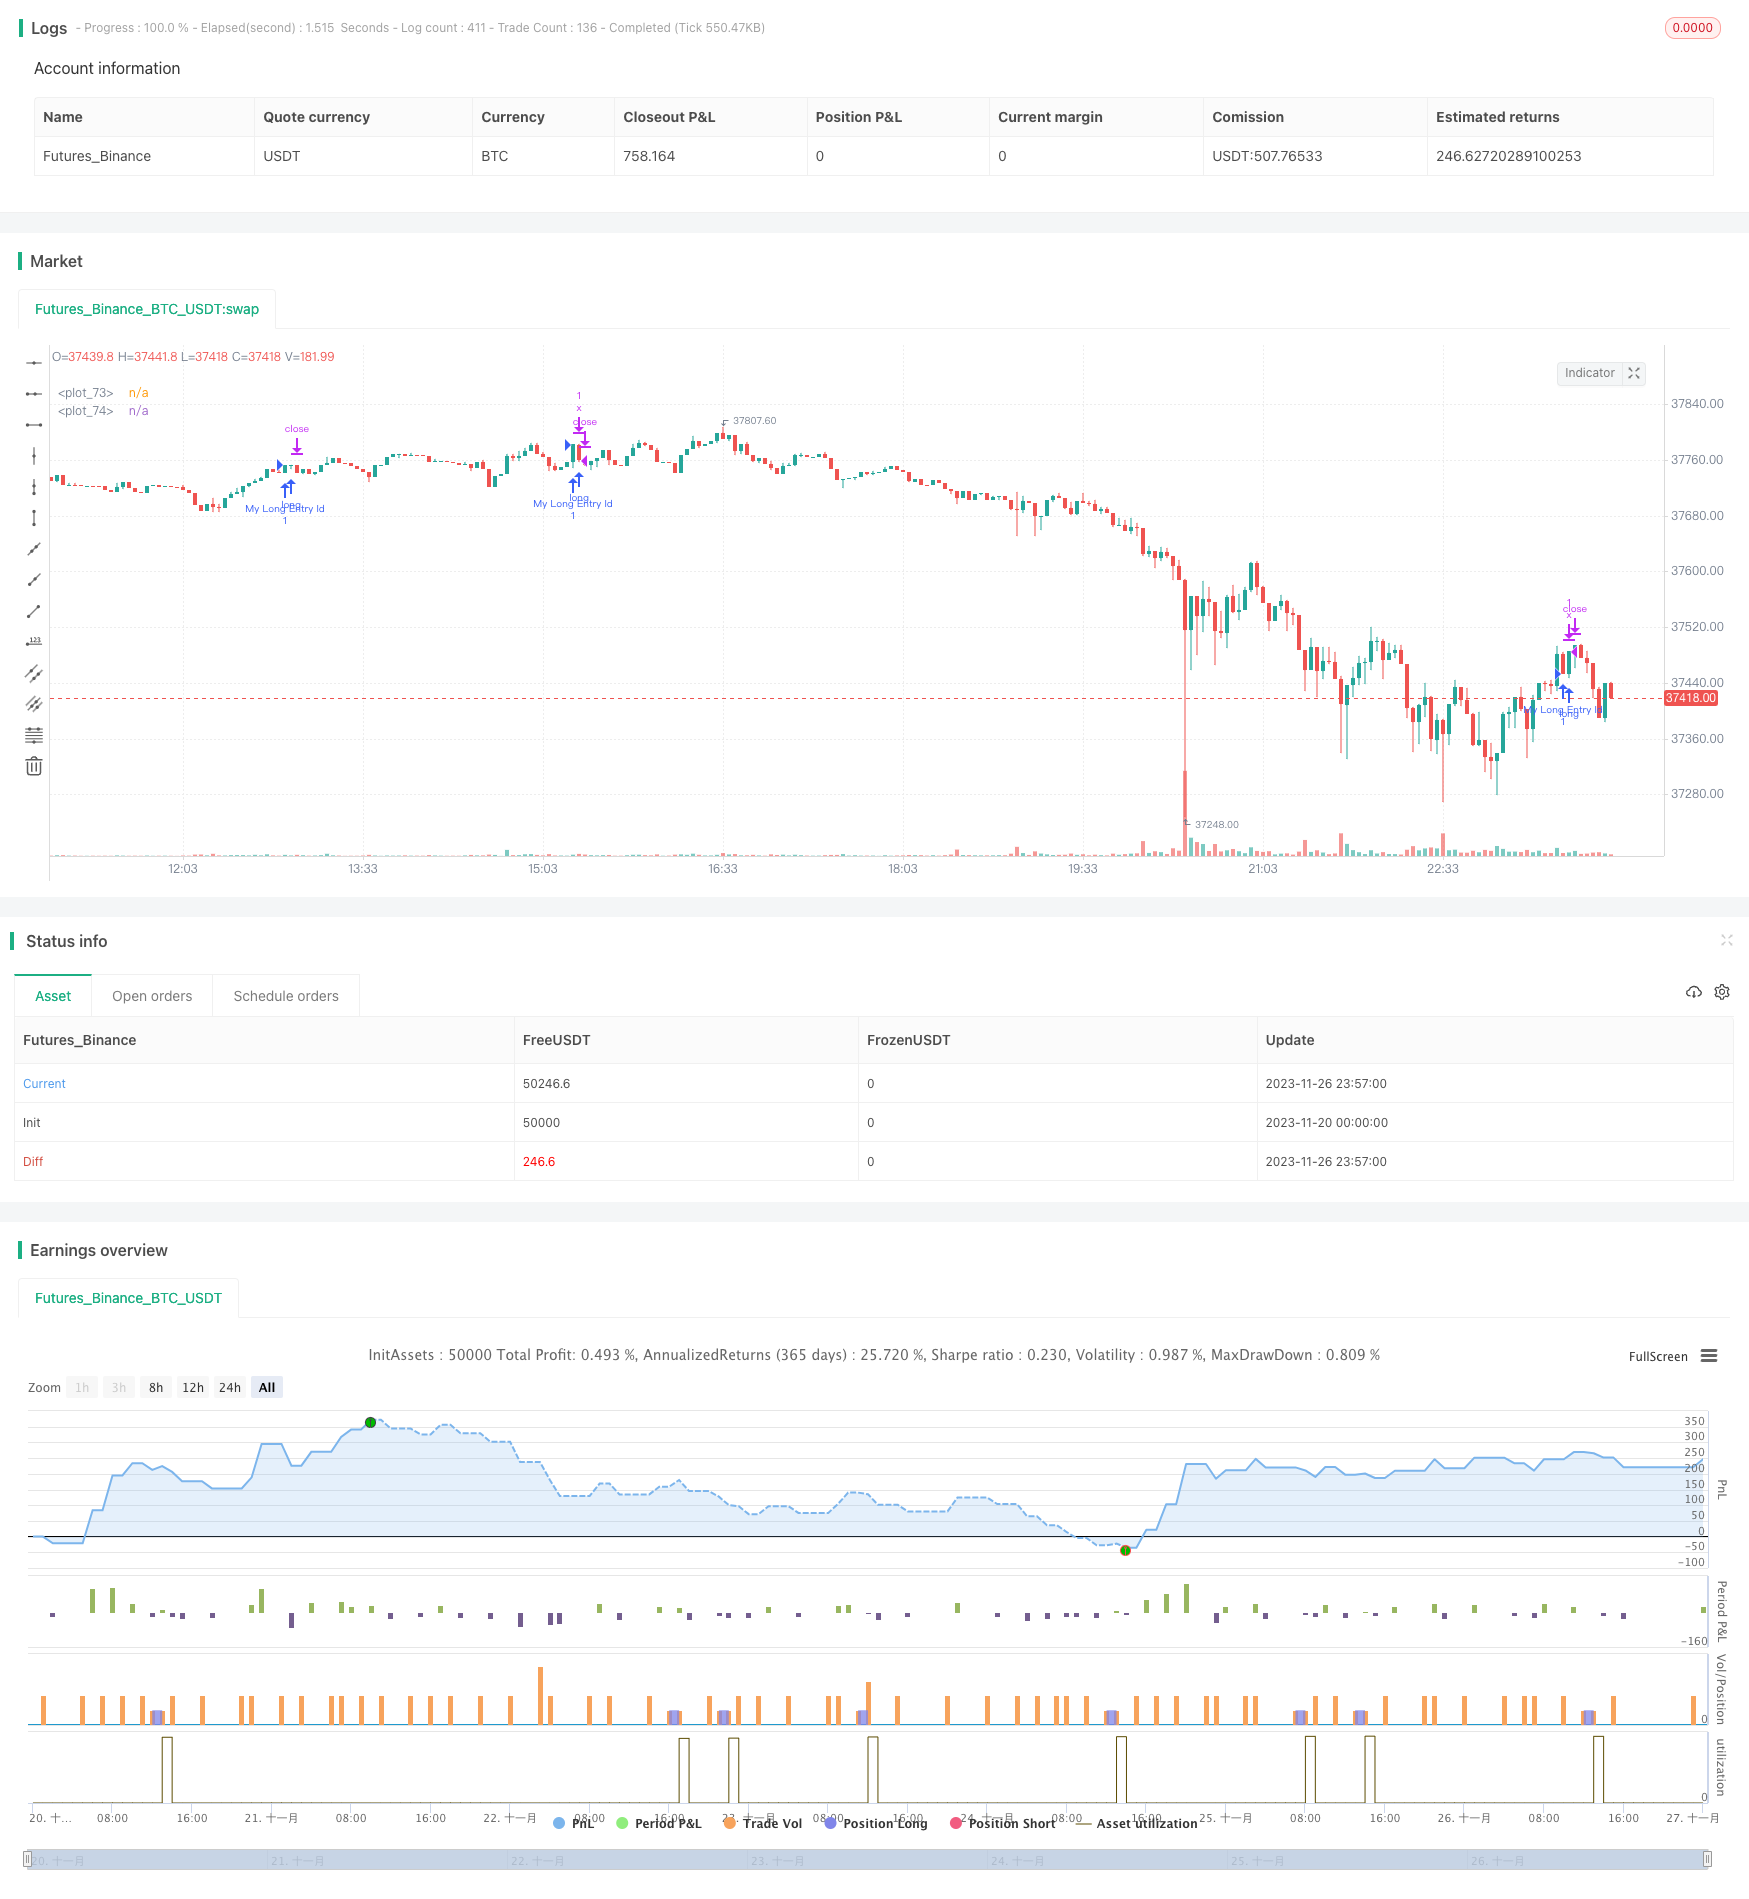
부분 이윤 취득 전략으로 단계적 인 후속 중지
저자:차오장, 날짜: 2023-11-28 16:05:24태그:

전반적인 설명
이것은 부분적 이윤 취득과 함께 단계적 인 트레일링 스톱을 활용하는 출구 전략입니다. 첫 번째 이윤 취득 수준에 도달한 후 스톱 손실을 손익분기 수준으로 이동하고 두 번째 수준에 도달한 후 첫 번째 이윤 취득 수준으로 이동합니다. 이는 수익 잠재력을 유지하면서 일부 이윤을 잠금 할 수 있습니다.
전략 논리
이 전략의 주요 구성 요소는 다음과 같습니다.
- 스톱 로스 3를 설정하면 승률을 점으로 나타냅니다.
- 현재 수익을 계산하기 위한 함수를 정의합니다. 포인트와 스톱 로스 가격으로요.
- 현재 수익 단계를 결정하는 함수를 정의합니다.
- 스톱 로스 가격을 수익 단계에 따라 트레일 가격으로 변경합니다.
구체적으로, 먼저 100 포인트의 스톱 로스를 설정하고 100/200/300 포인트의 이익을 취합니다.curProfitInPts이 함수는 현재 가격과 입시 가격에 기초하여 현재 수익을 계산합니다.calcStopLossPrice이 함수는 점 거리를 기준으로 스톱 로스 가격을 계산합니다.
핵심 논리는getCurrentStage위치가 있는지 확인하고 이익이 각 취득 수익 수준을 초과했는지 확인하는 함수입니다. 예를 들어 단계 2는 100 포인트 수익 후, 단계 3는 200 포인트 수익 후 달성됩니다.
마지막으로, 스톱 손실은 단계에 따라 수정됩니다. 단계 1은 원래 스톱, 단계 2는 브레이크 에븐, 단계 3는 첫 번째 수익 수준을 추적합니다.
이점 분석
이 단계적 트레일링 스톱 전략의 장점:
- 이윤을 확보할 수 있고, 이윤의 잠재력을 유지할 수 있습니다.
- 마감 손실은 가격을 따라가며 마감 가능성을 줄여줍니다.
- 여러 단계의 이익 취득 통제는 한 단계의 이익 취득보다 더 나은 위험입니다.
- 단순하고 명확한 논리
위험 분석
고려해야 할 몇 가지 위험 요소가 있습니다.
- 점진적인 수익 취득은 더 나은 출구 기회를 놓칠 수 있습니다. 수익 취득 수준을 최적화 할 수 있습니다.
- 만약 트레일 스톱 거리가 너무 높다면, 스톱은 조기에 발사될 수 있습니다. 다른 거리를 테스트할 수 있습니다.
- 손실을 줄일 수 없다는 것도 더 큰 손실로 이어질 수 있습니다. 특정 경우에 빠른 중지 손실을 고려하십시오.
최적화
이 전략을 개선할 수 있는 몇 가지 방법:
- 다른 수익을 테스트하고 매개 변수를 최적화하기 위해 거리를 중지합니다.
- 특정 상황에 대한 빠른 중지 손실 메커니즘을 고려하십시오.
- 기술 지표를 사용하여 수익 목표와 정지 수준을 결정합니다.
- 수익성 있는 출구와 정지 거리를 균형 잡으세요.
/*backtest
start: 2023-11-20 00:00:00
end: 2023-11-27 00:00:00
period: 3m
basePeriod: 1m
exchanges: [{"eid":"Futures_Binance","currency":"BTC_USDT"}]
*/

// This source code is subject to the terms of the Mozilla Public License 2.0 at https://mozilla.org/MPL/2.0/
// © adolgov

// @description
// when tp1 is reached, sl is moved to break-even
// when tp2 is reached, sl is moved to tp1
// when tp3 is reached - exit

//@version=4
strategy("Stepped trailing strategy example", overlay=true)

// random entry condition
longCondition = crossover(sma(close, 14), sma(close, 28))
if (longCondition)
    strategy.entry("My Long Entry Id", strategy.long)

// sl & tp in points
sl = input(100)
tp1 = input(100)
tp2 = input(200)
tp3 = input(300)

curProfitInPts() =>
    if strategy.position_size > 0
        (high - strategy.position_avg_price) / syminfo.mintick
    else if strategy.position_size < 0
        (strategy.position_avg_price - low) / syminfo.mintick
    else
        0

calcStopLossPrice(OffsetPts) =>
    if strategy.position_size > 0
        strategy.position_avg_price - OffsetPts * syminfo.mintick
    else if strategy.position_size < 0
        strategy.position_avg_price + OffsetPts * syminfo.mintick
    else
        0

calcProfitTrgtPrice(OffsetPts) =>
    calcStopLossPrice(-OffsetPts)

getCurrentStage() =>
    var stage = 0
    if strategy.position_size == 0
        stage := 0
    if stage == 0 and strategy.position_size != 0
        stage := 1
    else if stage == 1 and curProfitInPts() >= tp1
        stage := 2
    else if stage == 2 and curProfitInPts() >= tp2
        stage := 3
    stage

stopLevel = -1.
profitLevel = calcProfitTrgtPrice(tp3)

// based on current stage set up exit
// note: we use same exit ids ("x") consciously, for MODIFY the exit's parameters
curStage = getCurrentStage()
if curStage == 1
    stopLevel := calcStopLossPrice(sl)
    strategy.exit("x", loss = sl, profit = tp3, comment = "sl or tp3")
else if curStage == 2
    stopLevel := calcStopLossPrice(0)
    strategy.exit("x", stop = stopLevel, profit = tp3, comment = "breakeven or tp3")
else if curStage == 3
    stopLevel := calcStopLossPrice(-tp1)
    strategy.exit("x", stop = stopLevel, profit = tp3, comment = "tp1 or tp3")
else
    strategy.cancel("x")

// this is debug plots for visulalize TP & SL levels
plot(stopLevel > 0 ? stopLevel : na, style = plot.style_linebr)
plot(profitLevel > 0 ? profitLevel : na, style = plot.style_linebr)
더 많은
- 역사적인 데이터에 기초한 동적 지원 및 저항 전략
- 노로의 볼링거 추적 전략
- EMA 반전 구매-판매 전략
- 하라미 폐쇄 가격 전략
- CMO와 WMA를 기반으로 한 모멘텀 거래 전략
- P-Signal 멀티 타임프레임 거래 전략
- 재화 동력 지수 전략
- 이중 거북이 돌파구 전략
- 물결 트렌드 기반의 양적 거래 전략
- 이치모쿠 쿠모 트위스트 금 흡수 전략
- TSI와 CCI Hull 이동평균 트렌드 추적 전략
- 리버스 엔지니어링 RSI 전략
- 이중적 CCI 양적 전략
- 이중 EMA 크로스오버 브레이크아웃 전략
- 멀티 타임프레임 MACD 전략
- RSI와 ATR 통로를 기반으로 한 슈퍼 스칼핑 전략
- 돈치안 트렌드 전략
- 다중SMA 이동평균 크로스오버 전략
- 다중 RSI 지표 거래 전략
- 트래일링 스톱 로스로 슈퍼 트렌드 전략