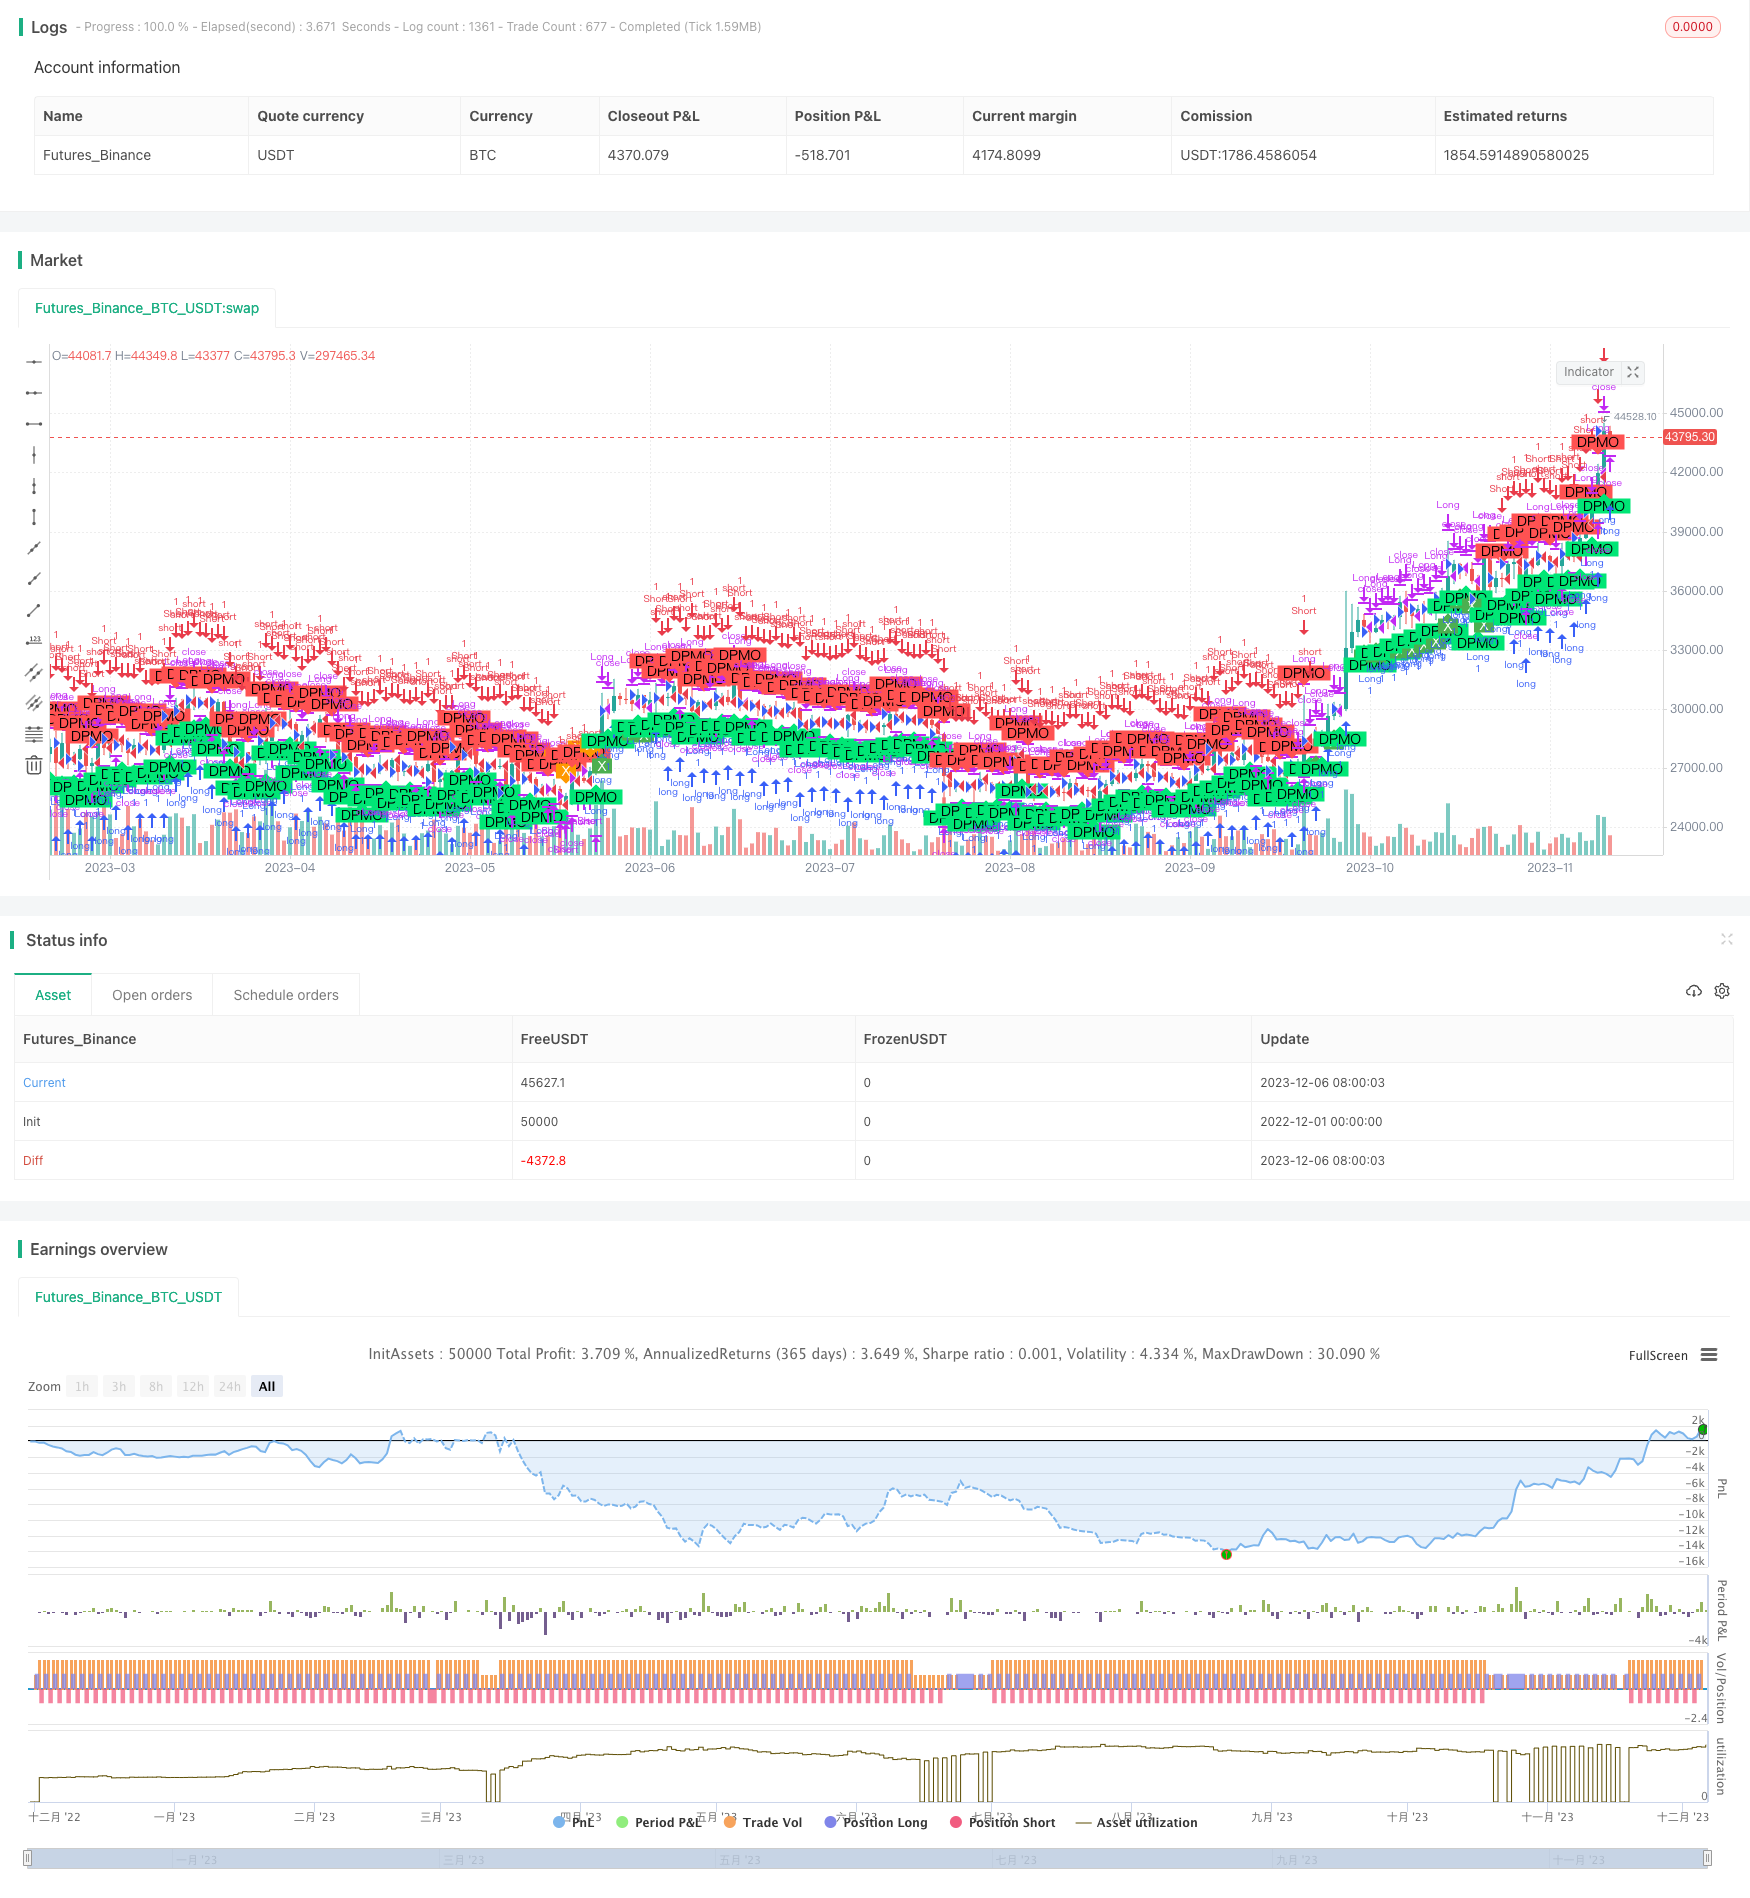
이중 이동 평균에 기초한 가격 변동성 브레이크업 전략
저자:차오장, 날짜: 2023-12-08 16:44:22태그:

전반적인 설명
이 전략의 핵심 아이디어는 가격 변동성을 사용하여 시장 트렌드를 판단하는 것입니다. 변동성이 상승하면 시장이 새로운 트렌드를 형성하고 있음을 의미합니다. 변동성이 감소하면 현재 트렌드가 끝나고 있음을 의미합니다. 전략은 가격의 비율 변화를 계산하고 두 배 이동 평균으로 필터링하여 가격 변동성을 반영하는 지표를 얻습니다. 지표가 신호선을 넘을 때 구매 신호를 생성하고 아래에 넘을 때 신호를 판매합니다.
전략 논리
전략은 먼저 가격의 비율 변화를 계산합니다.
i=(src/nz(src[1], src))*100
그 다음 i를 35주기 이동평균으로 필터링하여 초기 변동성 지표 pmol2를 얻는다. Pmol2는 최종 지표 pmol을 얻기 위해 20주기 이동평균으로 다시 필터링된다. 마지막으로, pmol의 10주기 이동평균을 신호선 pmol로 사용합니다. pmol이 pmol을 넘을 때 구매하고 아래를 넘을 때 판매한다.
이점 분석
- 이중 MA 필터링은 휘발성을 잘 추출하고 소음을 필터합니다.
- 비율 변화를 계산하면 가격 변동이 증폭되고 트렌드 변화가 더 눈에 띄게 됩니다.
- 이윤 모델은 명확합니다. 트렌드 시작에서 구매하고 트렌드 끝에서 판매합니다.
위험 분석
- 이중 필터링은 약간의 지연을 유발합니다.
- 비율 변화 계산은 가격 범위에 민감합니다.
- 황소와 곰의 전환에서 적절한 시간에 출구가 필요합니다.
최적화 방향
- 트렌드 포착을 개선하기 위해 MA 매개 변수를 최적화합니다.
- 다른 가격 변화 계산 방법을 시도하십시오.
- 잘못된 신호를 피하기 위해 필터를 추가합니다.
요약
이 전략은 가격 변동성을 추출하고 트렌드 변화를 판단하기 위해 비율 변화와 이중 MA 필터링을 사용합니다. 비교적 성숙한 기술 지표 전략에 속합니다. 전략은 좋은 트렌드 포착 기능이 있지만 중간 전환점 인식 기능이 있습니다. 매개 변수 조정 및 보조 조건을 추가하여 최적화 할 수 있습니다.
/*backtest
start: 2022-12-01 00:00:00
end: 2023-12-07 00:00:00
period: 1d
basePeriod: 1h
exchanges: [{"eid":"Futures_Binance","currency":"BTC_USDT"}]
*/

//@version=2
strategy("Strategy for DPMO", overlay=true)

src=input(close, title="Source")
length1=input(35, title="First Smoothing")
length2=input(20, title="Second Smoothing")
siglength=input(10, title="Signal Smoothing")
ebc=input(false, title="Enable Bar Colors")

upSign = '↑' // indicates the indicator shows uptrend
downSign = '↓' // incicates the indicator showing downtrend
exitSign ='x' //indicates the indicator uptrend/downtrend ending

calc_csf(src, length) =>
	sm = 2.0/length
	csf=(src - nz(csf[1])) * sm + nz(csf[1])
	csf
i=(src/nz(src[1], src))*100
pmol2=calc_csf(i-100, length1)
pmol=calc_csf( 10 * pmol2, length2)
pmols=ema(pmol, siglength)
d=pmol-pmols
hc=d>0?d>d[1]?lime:green:d<d[1]?red:orange

buyDPMO = hc==lime and hc[1]!=lime
closeBuyDPMO = hc==green and hc[1]!=green
sellDPMO = hc==red and hc[1]!=red
closeSellDPMO = hc==orange and hc[1]!=orange

plotshape(buyDPMO, color=lime, style=shape.labelup, textcolor=#000000, text="DPMO", location=location.belowbar, transp=0)
plotshape(closeBuyDPMO, color=green, style=shape.labelup, textcolor=#ffffff,  text="X", location=location.belowbar, transp=0)
plotshape(sellDPMO, color=red, style=shape.labeldown, textcolor=#000000, text="DPMO", location=location.abovebar, transp=0)
plotshape(closeSellDPMO, color=orange, style=shape.labeldown, textcolor=#ffffff,  text="X", location=location.abovebar, transp=0)
barcolor(ebc?hc:na)


strategy.entry("Long", strategy.long, when=buyDPMO)
strategy.close("Long", when=closeBuyDPMO or sellDPMO)
strategy.entry("Short", strategy.short, when=sellDPMO)
strategy.close("Short", when=closeSellDPMO or buyDPMO)
더 많은
- 이중형 이동평균 거래 전략
- 양적 지표에 기초한 가격 변화 및 평균 가격 전략
- 볼링거 비율 대역 거래 전략
- 이윤을 추적하고 손실을 중단하는 전략
- Y-이익 극대화 전략
- 전략에 따른 파업 추세
- 슈퍼트렌드 기반 트렌드 추적 전략
- 기하급수적인 이동평균 및 MACD 지표에 기초한 전략
- 볼링거 밴드 (Bollinger Band) 에 기초한 지수 거래 전략
- 기하급수적인 이동 평균 반등 전략
- 슈퍼트렌드 및 DEMA 기반 트렌드 다음 전략
- 월말 200일 이동평균 전략의 파업
- 코인룰 스크립트에 기반한 OBV 피라미드 전략
- 이동평균 앙플로프와 ATR 트레일링 스톱에 기초한 양적 거래
- ADX 크로스오버 트렌드 거래 전략
- 암호화 토크 러닝 추적 전략
- 슈퍼트렌드
글링 전략 - ADX 기반 한 시간 TENKAN KIJUN 크로스 트렌드 추적 전략
- MACD 이동 평균 황소 곰 전환 전략
- 이동 평균 크로스오버 전략