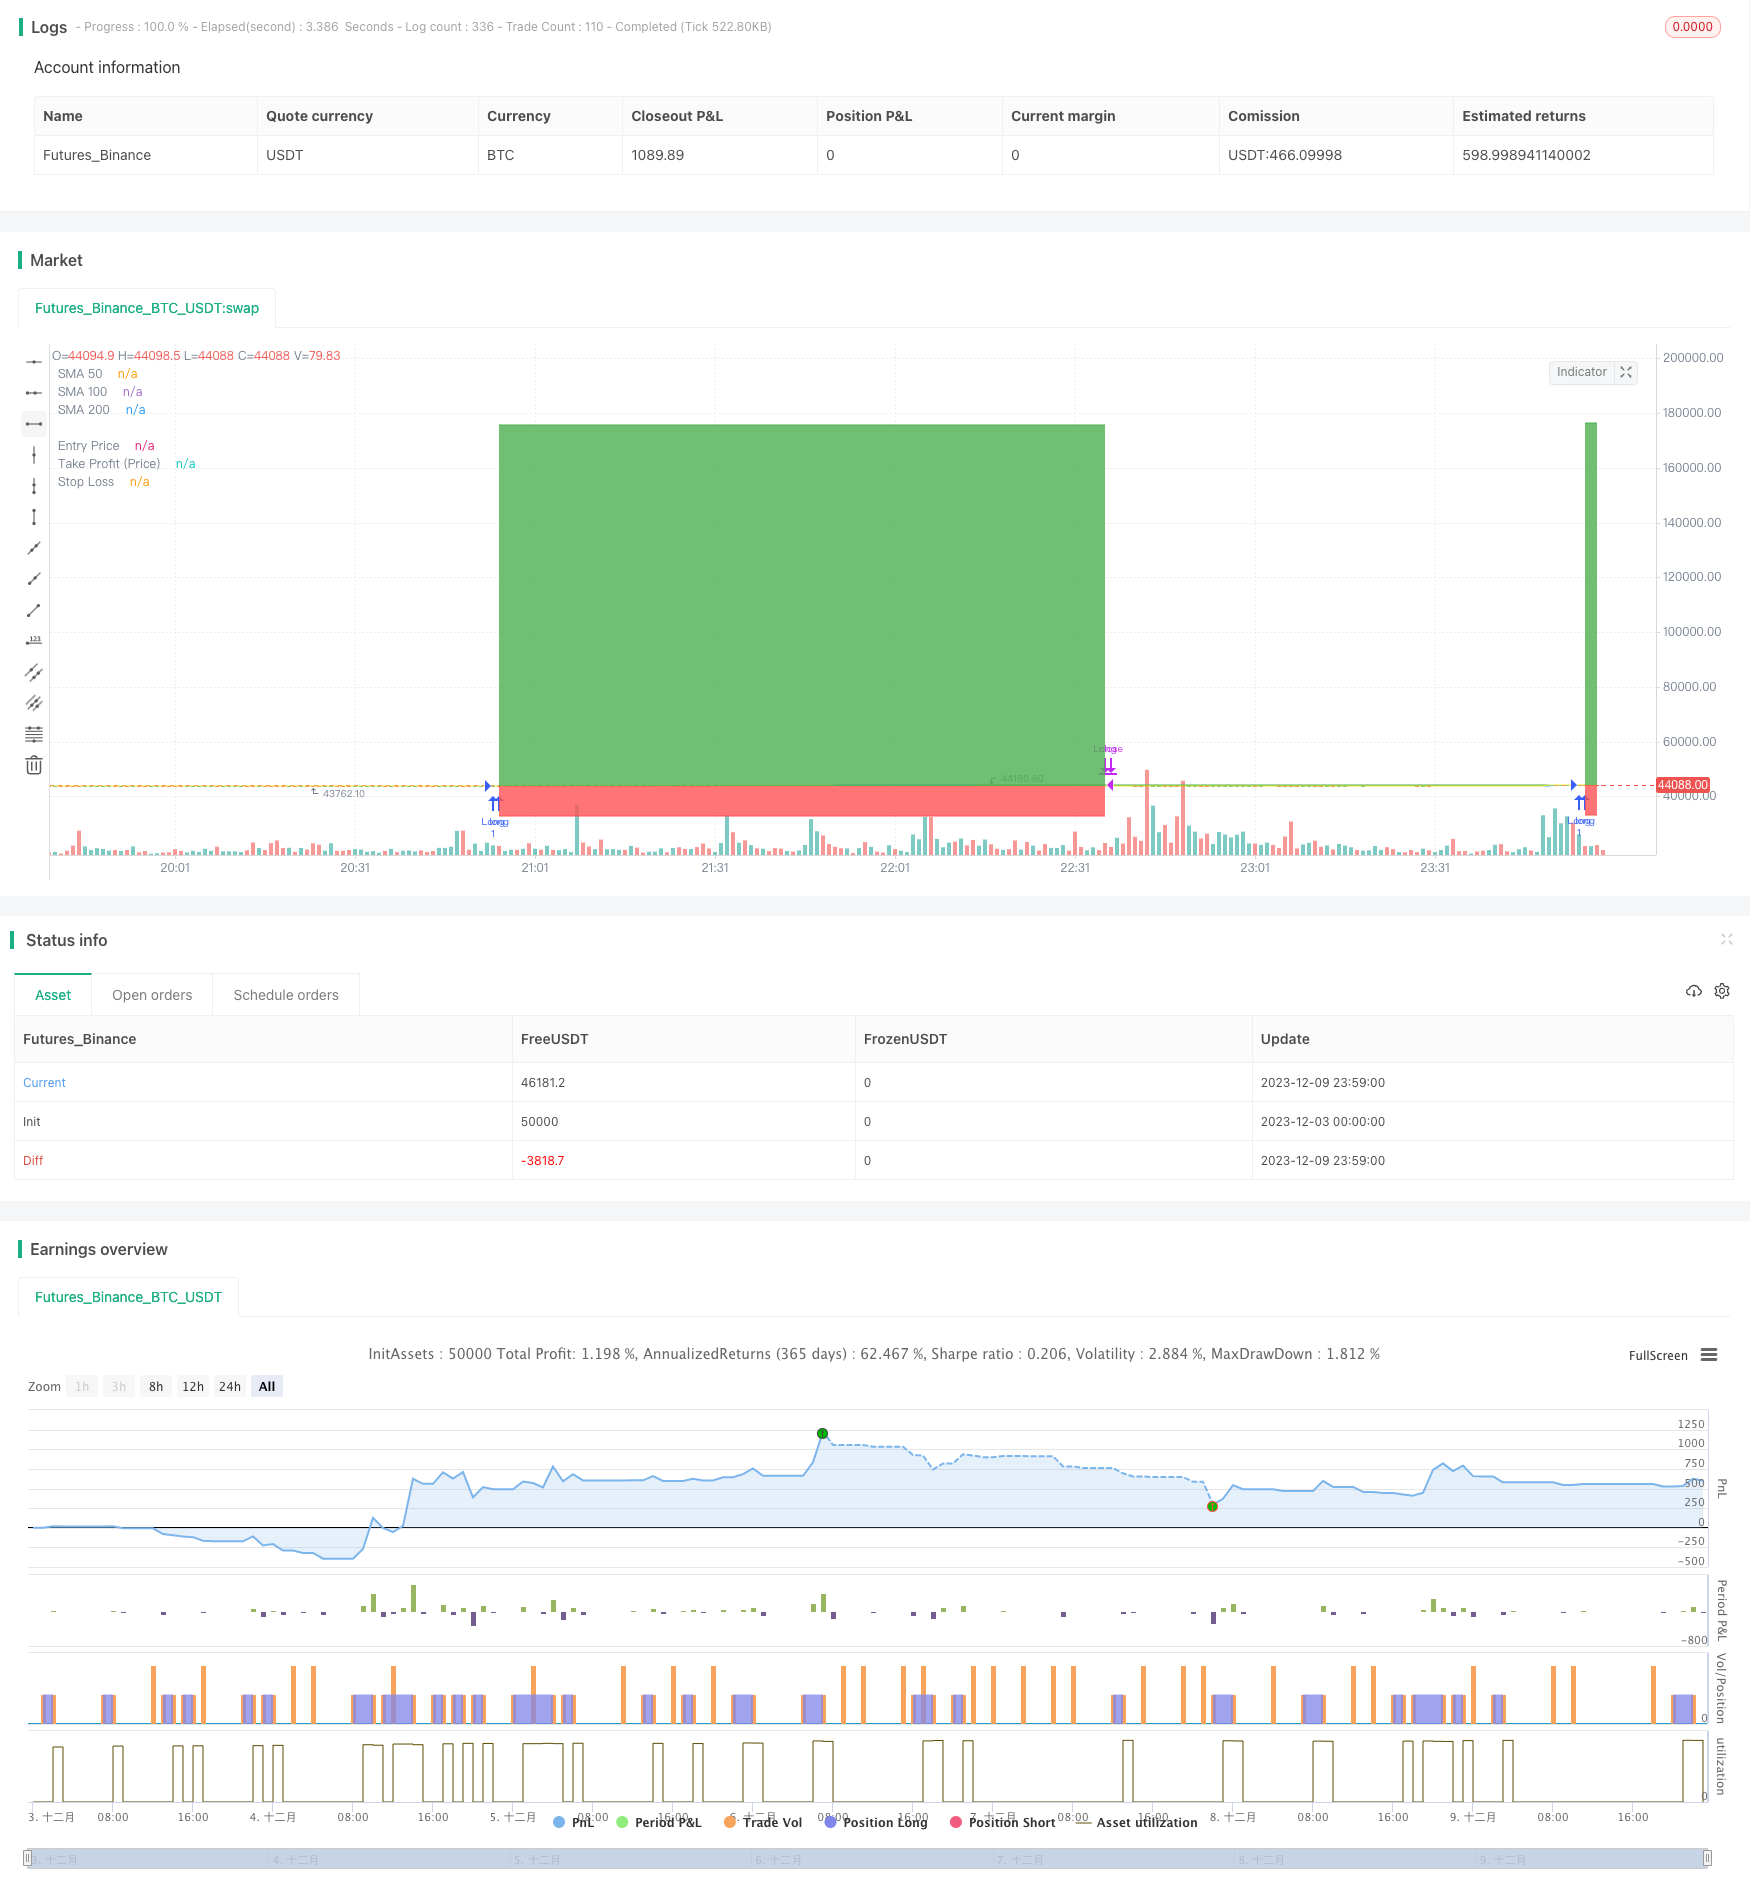
개요
골든 크로스 이동 평균 거래 전략은 비교적 고전적인 양적 거래 전략이다. 이 전략은 다른 주기의 이동 평균을 사용하여 시장 추세를 판단하여 더 많은 공백을 한다. 단기 이동 평균 상에서 더 긴 주기 이동 평균을 통과하면 구매 신호로 간주되며, 단기 이동 평균 아래에서 장기 이동 평균을 통과하면 판매 신호로 간주된다.
전략 원칙
이 전략은 세 개의 다른 기간의 간단한 이동 평균 (SMA) 을 기반으로 합니다: 50 일선, 100 일선 및 200 일선. 구체적인 거래 논리는 다음과 같습니다:
진입 신호: 50 일 이동 평균에 100 일 이동 평균을 착용 할 때, 더 많은 진입을하십시오.
출구 신호: 50일 이동 평균 아래 100일 이동 평균을 통과할 때, 평지 상태에서 출구; 또는 100일 이동 평균 이하의 종결 가격에서 출구; 또는 100일 이동 평균 아래 200일 이동 평균을 통과할 때, 출구.
정지 손실: 이동식 정지 및 고정 정지 손실을 설정한다.
이 전략은 이동 평균이 시장의 평균 가격을 효과적으로 판단할 수 있는 특징을 이용한다. 단기 평균 위에 장기 평균을 뚫을 때, 시장의 단계 상승 트렌드의 신호로 간주되고, 따라서 더 많이 한다. 단기 평균 아래에 장기 평균을 뚫을 때, 시장의 단계 하강 채널로 간주되어, 따라서 더 많이 한다. 이 방법으로, 시장의 추세를 효과적으로 잡을 수 있다.
전략적 이점
동작이 간단하고 구현하기 쉽다. 이 전략의 논리는 단지 3개의 다른 주기의 이동 평균을 사용하여 구축할 수 있다.
강한 안정성. 이동 평균 자체는 소음 제거 기능을 가지고 있으며, 시장의 무작위 변동이 거래에 미치는 영향을 효과적으로 제거하여 신호를 더 안정적이고 신뢰할 수있게 만듭니다.
큰 트렌드를 쉽게 파악할 수 있다. 이동 평균은 시장의 평균 가격 변화의 트렌드를 효과적으로 반영할 수 있으며, 긴 짧은 주기선을 교차하여 큰 시장 변화를 판단한다.
커스터마이징이 높다. 이동 평균의 주기적 조합을 직접 결정할 수 있으며, 다양한 수준의 위험 통제를 구현한다.
전략적 위험
더 많은 가짜 신호를 생성할 수 있다. 단기 및 장기 이동 평균이 너무 가까워지면, 빈번한 교차가 발생할 수 있으며, 무효 신호를 많이 생성한다.
급격한 사건에 신속하게 대응할 수 없습니다. 이동 평균은 가격 변화에 대한 반응이 느리고, 시장의 급격한 소식과 중요한 사건에 대한 실시간 반응이 없습니다.
수익을 올릴 수 없는 시장의 소규모 변동. 이동 평균의 무소 특성은 시장의 소규모 변동을 포착하여 수익을 올릴 수 없다는 것을 의미합니다.
매개 변수 설정은 상대적으로 주관적이다. 이동 평균 주기 선택은 상대적으로 주관적이며, 다른 시장에 따라 최적의 매개 변수를 결정해야 한다.
전략 최적화 방향
필터링 조건을 추가하여 너무 많은 가짜 신호를 발생하지 않도록하십시오. 예를 들어, 가격 변동 범위를 필터로 설정하여 특정 범위를 돌파 할 때만 거래 신호를 발생시킵니다.
다른 지표와 결합하여 사용한다. 예를 들어, 변동률 지표, 거래량 지표와 함께 사용하면 신호의 정확도를 향상시킬 수 있다.
적응 최적화 모듈을 추가한다. 기계 학습과 같은 기술을 통해 이동 평균의 주기 변수를 동적으로 최적화하여 외부 시장 환경의 변화에 적응할 수 있도록 한다.
딥러닝 모델과 결합. 이동 평균을 더 진보된 딥러닝 모델로 대체하고, 더 강력한 특징 추출 및 모델링 능력을 갖는다.
요약하다
골드 크로스 일평선 거래 전략은 비교적 전형적인 트렌드 따라가는 전략이다. 그것은 시장 가격의 평균 변화 경향을 반영하고, 간단하고 실용적이며, 초보자 학습에 적합하다. 동시에, 이 전략에는 결함이 있으며, 신호 품질을 향상시키고, 다른 기술 지표와 조합하고, 적응 메커니즘을 도입하는 등 여러 가지 측면에서 최적화 할 수 있다. 전략이 더 복잡한 시장 환경에 적응하도록 한다.
/*backtest
start: 2023-12-03 00:00:00
end: 2023-12-10 00:00:00
period: 1m
basePeriod: 1m
exchanges: [{"eid":"Futures_Binance","currency":"BTC_USDT"}]
*/

// This source code is subject to the terms of the Mozilla Public License 2.0 at https://mozilla.org/MPL/2.0/
// © CJDeegan

//@version=4
strategy(title = "[LIVE] Golden Cross", overlay=true)

// ------------Functions------------

//Percent to Decimal Conversion
perToDec(a) => a * 0.01
//Price Difference to Tick
diffToTick(a,b) => (a - b) / syminfo.mintick


// ------------Strategy Inputs------------
takeProfitInput = input(300, "Take Profit Price (% Gain)")
stopLossInput = input(25, "Stop Loss (% Loss)")


startDate = input(title="Start Date", type=input.integer,
     defval=1, minval=1, maxval=31)
startMonth = input(title="Start Month", type=input.integer,
     defval=1, minval=1, maxval=12)
startYear = input(title="Start Year", type=input.integer,
     defval=2018, minval=1800, maxval=2100)

endDate = input(title="End Date", type=input.integer,
     defval=1, minval=1, maxval=31)
endMonth = input(title="End Month", type=input.integer,
     defval=1, minval=1, maxval=12)
endYear = input(title="End Year", type=input.integer,
     defval=2031, minval=1800, maxval=2100)

inDateRange = (time >= timestamp(syminfo.timezone, startYear,
         startMonth, startDate, 0, 0)) and
     (time < timestamp(syminfo.timezone, endYear, endMonth, endDate, 0, 0))


// ------------Populate Indicators------------

//EMA
sma50 = sma(close,50)
sma100 = sma(close,100)
sma200 = sma(close,200)


// ------------Entry Logic------------
//Guards
entryGuard = true
//Triggers
entryTrigger = crossover(sma50,sma100)
//Conditions
entryCondition = entryGuard and entryTrigger
//Calculations
//Execution
if (inDateRange and entryCondition)
    strategy.entry("Long", strategy.long, when = entryCondition, comment = "Entry")

//------------Exit Logic------------

//Guards
//Triggers
exitTrigger = crossunder(sma50,sma100) or close < sma100 or crossunder(sma100,sma200)
//Conditions
exitCondition = exitTrigger

//Calculations
//Take Profit
takeProfitPrice = strategy.position_avg_price + (strategy.position_avg_price * perToDec(takeProfitInput))
//Take Profit Ticks
takeProfitTicks = diffToTick(takeProfitPrice, strategy.position_avg_price)
//StopLoss
stopLossPrice = strategy.position_avg_price - (strategy.position_avg_price * perToDec(stopLossInput))

//Execution
if (inDateRange)
    strategy.close("Long", when = exitCondition, comment = "Sell Trigger")
    strategy.exit("Exit", "Long", comment="Stop", profit=takeProfitTicks, stop=stopLossPrice)

//Plots
plot(sma50, "SMA 50", color = color.blue)
plot(sma100, "SMA 100", color = color.green)
plot(sma200, "SMA 200", color = color.yellow)
entry = plot(strategy.position_size <= 0 ? na : strategy.position_avg_price, "Entry Price", color = color.yellow, style = plot.style_linebr)
profit = plot(strategy.position_size <= 0 ? na : takeProfitPrice, "Take Profit (Price)", color = color.green, style = plot.style_linebr)
stop = plot(strategy.position_size <= 0 ? na : stopLossPrice, "Stop Loss", color = color.red, style = plot.style_linebr)
fill(entry,profit, color=color.green)
fill(entry,stop, color=color.red)