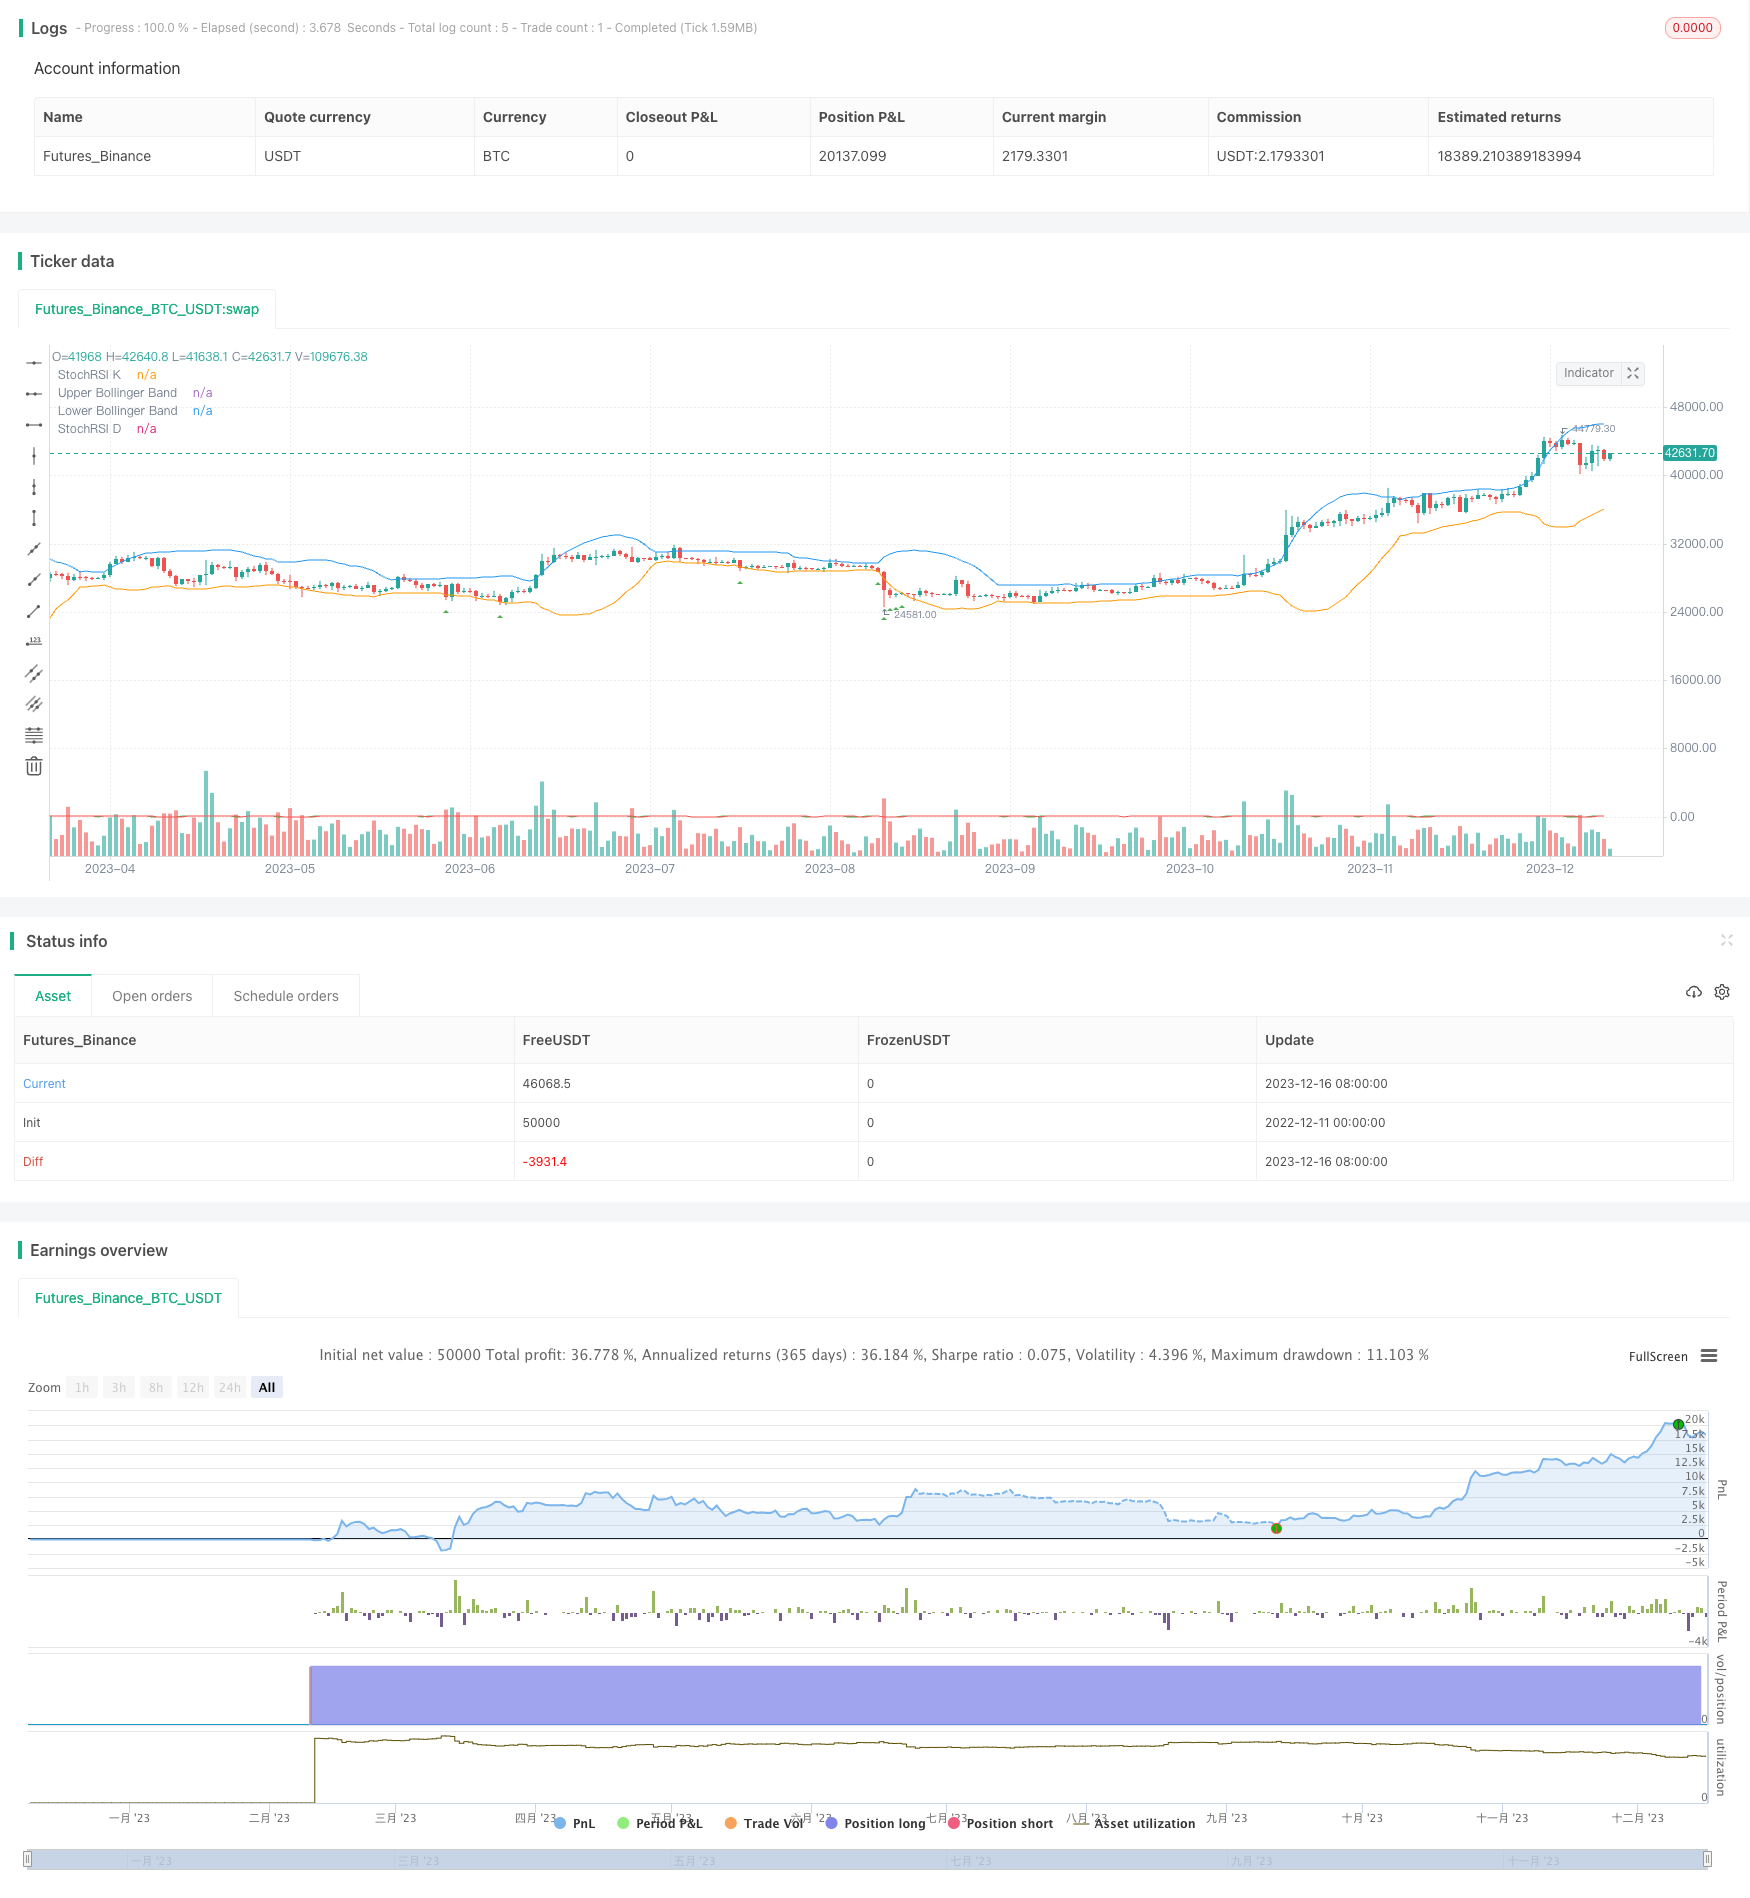
볼링거 밴드 및 스톡RSI 지표에 기초한 고주파 거래 전략
저자:차오장, 날짜: 2023-12-18 10:16:49태그:

전략 개요
이 전략은
전략 논리
지표 계산
첫째, 볼링거 밴드 상단, 중단 및 하단은 사용자 정의 길이와 표준 편차 매개 변수에 기초하여 계산됩니다. 중단은 폐쇄 가격의 간단한 이동 평균을 나타냅니다. 상단과 하단은 가격 변동의 표준 편차를 나타냅니다.
그 다음, 스토카스틱 RSI 지표는 StochRSI에 대한 선택 된 길이, K 기간 및 D 기간 매개 변수에 기초하여 계산됩니다. 이 지표는 자산 가격의 동력을 측정하기 위해 RSI 및 스토카스틱 지표의 특성을 결합합니다.
구매 조건
구매 조건은 종료 가격이 볼링거 밴드 하단 범위를 넘어지면 시작됩니다. 이것은 가격이 최근 변동성의 하단 범위에 있음을 암시하며 잠재적 인 구매 기회를 제공합니다.
출입 및 출입
매수 조건이 충족되면 전략은 기회를 찾기 위해 긴 지위에 들어갑니다.
코드는 출구 논리를 포함하지 않습니다. 이 논리는 거래자가 직접 설정해야 합니다. 제품과 수익을 취하거나 손실을 멈추는 시간 틀에 따라 말이죠.
이점 분석
- 잠재적인 가격 반전 지점을 식별하기 위해 볼링거 밴드를 사용합니다.
- StochRSI는 추가적인 추진력 판단을 제공합니다.
- 스칼핑 전략에 적합한 높은 주파수 거래
- 길게 가는 것만으로도 단순함
- 더 나은 성능을 위해 매개 변수를 최적화하는 유연성
위험 분석
- 과잉 구매 및 과잉 판매 조건의 위험
- 거래 비용에 취약한 높은 거래 빈도
- 이윤을 취하거나 손실을 중지하기 위해 출구 논리 설정이 필요합니다.
- 엄격한 자본 관리가 필요합니다.
이방향 거래, 매개 변수 최적화, 스톱 로스 및 영리 설정, 비용 헤지 평가 등을 추가함으로써 위험을 줄일 수 있습니다.
최적화 방향
- 양방향 거래를 가능하게 판매 조건을 추가
- 잘못된 신호를 줄이기 위해 매개 변수 혼합을 최적화
- 트렌드 지표 필터를 추가합니다
- 위험 관리를 보장하기 위해 스톱 로스를 설정하고 수익을 취합니다.
결론
이 전략은 볼링거 밴드 및 스톡RSI 지표에 기반한 고주파 거래에 대한 틀을 제공합니다. 거래자는 거래 목표와 시장 조건에 따라 매개 변수를 조정하고 위험 관리 조치를 추가하여 전략을 최적화하여 빈번한 거래의 요구를 충족시킬 수 있습니다.
//@version=5
strategy("High Frequency Strategy", overlay=true)

// Define your Bollinger Bands parameters
bollinger_length = input.int(20, title="Bollinger Bands Length")
bollinger_dev = input.float(2, title="Bollinger Bands Deviation")

// Calculate Bollinger Bands
sma = ta.sma(close, bollinger_length)
dev = bollinger_dev * ta.stdev(close, bollinger_length)

upper_band = sma + dev
lower_band = sma - dev

// Define your StochRSI parameters
stoch_length = input.int(14, title="StochRSI Length")
k_period = input.int(3, title="K Period")
d_period = input.int(3, title="D Period")

// Calculate StochRSI
rsi = ta.rsi(close, stoch_length)
k = ta.sma(ta.stoch(rsi, rsi, rsi, k_period), k_period)
d = ta.sma(k, d_period)

// Define a buy condition (Long Only)
buy_condition = close < lower_band

// Place orders based on the buy condition
if (buy_condition)
    strategy.entry("Buy", strategy.long)

// Optional: Plot buy signals on the chart
plotshape(buy_condition, color=color.green, style=shape.triangleup, location=location.belowbar, size=size.small)

// Plot Bollinger Bands on the chart
plot(upper_band, title="Upper Bollinger Band", color=color.blue)
plot(lower_band, title="Lower Bollinger Band", color=color.orange)
plot(k, title="StochRSI K", color=color.green)
plot(d, title="StochRSI D", color=color.red)
- 이동평균에 기초한 고정 비율의 스톱 로스 및 영업 전략
- 이중 EMA 및 가격 변동 지수에 기초한 양적 거래 전략
- 모멘텀 브레이크오웃 양방향 추적 전략
- 슈퍼 트렌드 LSMA 장기 전략
- 세 바와 네 바 브레이크업 역전 전략
- 적응적인 기하급수적 이동평균 라인에 기초한 적응적인 SMI 에르고딕 거래 전략
- 스팟 거래에 대한 SMA 및 PSAR 전략
- SMA 및 RSI 단장 전략
- 이중 이동 평균 반전 브레이크업 전략
- 이치모쿠 클라우드 기반의 트렌드 다음 전략
- 이중 회환 균형 전략
- HYE 평균 회전 SMA 전략
- 이중 이동 평균 역전 전략
- 쌍방향 가격 돌파 이동 평균 시점 거래 전략
- 볼링거 브레이크아웃 주식 전략
- 7개의 촛불 오시슬레이션 돌파구 전략
- 골든 데드 크로스 트렌드 추적 전략
- TRSI 및 SUPER 트렌드 지표에 기초한 양적 거래 전략
- 다중 지표 조건 필터링에 기반한 양적 전략을 따르는 일내 트렌드
- 볼링거 밴드 및 RSI 짧은 판매 전략