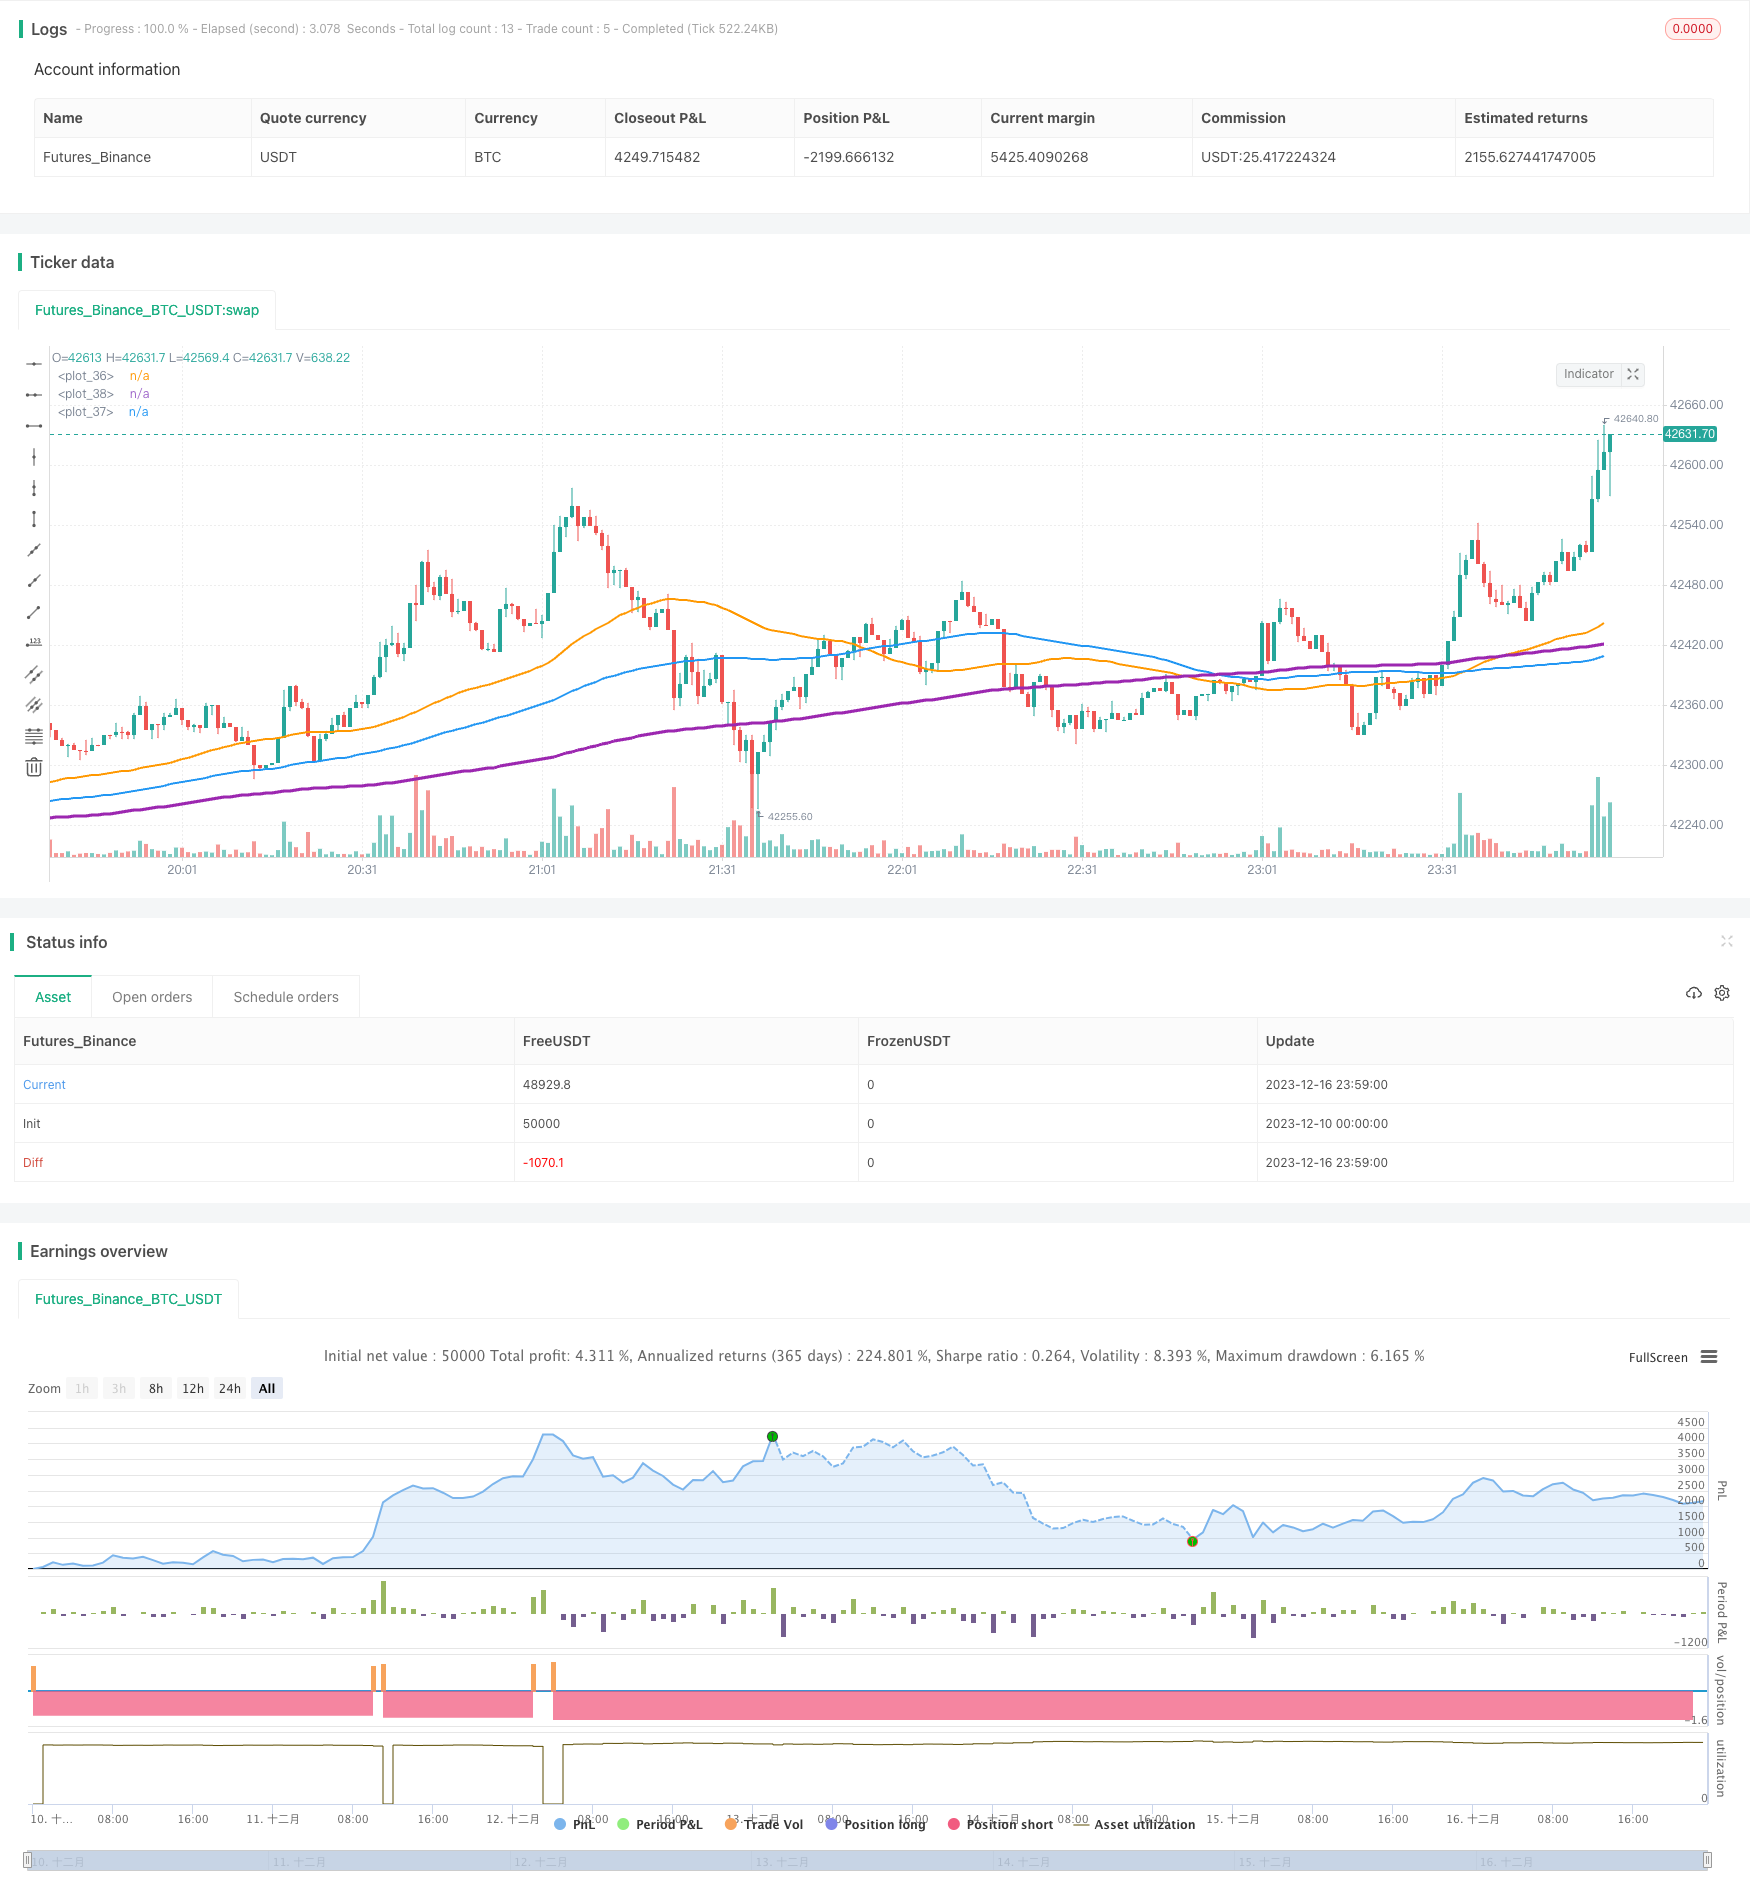
개요
이 전략은 낮은 변동성을 지향하는 구매 중지 손실 전략이라고 한다. 그것은 이동 평균의 교차를 구매 신호로 사용하고, 중지 중지 손실과 결합하여 수익을 잠금화한다. 낮은 변동 영역의 통화에 적용한다.
전략 원칙
이 전략은 3개의 다른 주기의 이동 평균을 사용한다: 50주기, 100주기 및 200주기. 그것의 구매 논리는: 50주기 라인에서 100주기 라인을 통과할 때, 그리고 100주기 라인에서 200주기 라인을 통과할 때, 더 많은 입장을 한다.
이 신호는 시장이 낮은 변동 영역에서 돌파하고 트렌드 상태에 들어가기 시작한다는 것을 나타냅니다. 50 주기의 급격한 상승은 단기 내력의 급격한 증가를 나타내고, 중장선을 위로 끌어올리기 시작합니다. 100 주기의 선은 또한 중장력의 합류를 나타내고, 안정적인 추세 상승을 나타냅니다.
입문 후, 전략은 스톱 스톱 손실 방식을 사용하여 수익을 잠금한다. 스톱 스톱 목표는 입문 가격의 8%이며, 스톱 스톱 라인은 입문 가격의 4%이다. 스톱 스톱은 스톱 스톱보다 크며, 손실보다 이익을 얻는 데 도움이 되며, 전략의 전반적인 수익성을 보장한다.
우위 분석
이 전략은 다음과 같은 장점을 가지고 있습니다.
- 낮은 변동 영역에서 발생하는 트렌드 기회를 정확하게 잡을 수 있습니다.
- 이동 평균은 쉽게 계산하고 재측정할 수 있고, 논리는 간단하고 명확하다.
- 정지 손실 설정은 합리적이고 안정적인 수익을 얻는데 도움이 됩니다.
- 구성 가능한 매개 변수는 유연하고 쉽게 최적화할 수 있다.
위험 분석
이 전략에는 몇 가지 위험도 있습니다.
- 잘못된 뚫림 신호는 손실을 초래할 수 있다.
- 시장이 뒤집을 때 손해를 막기 힘들다.
- 정지 손실 변수 설정이 잘못되면 수익에 영향을 미칠 수 있습니다.
대책:
- 다른 지표와 함께 필터링 신호를 통해 뚫고 넘어가는 효과를 보장합니다.
- 적당히 단축한 정지주기를 통해 역전으로 인한 손실을 줄여주십시오.
- 다양한 스티드 스톱 손실 비율을 테스트하여 최적의 파라미터를 찾습니다.
최적화 방향
이 전략은 다음과 같은 측면에서 최적화될 수 있습니다.
- 다양한 이동 평균 주기 변수를 테스트하여 최적의 조합을 찾습니다.
- 트렌드 브레이크를 확인하기 위해 거래량과 같은 지표를 추가하십시오.
- 동적으로 정지 손실을 조정한다.
- 기계학습과 같은 방법을 사용하여 돌파구 성공률을 예측한다.
- 다른 시장 조건과 통화에 따라 변수를 조정한다.
종합적으로, 이 전략은 전체적인 운영 논리가 명확하며, 이동 평균 주기 및 스톱 스톱 손실 폭을 구성하여 낮은 위험 수익을 얻을 수 있으며, 양적 거래에 유연하게 적용할 수 있다. 이후에는 입점 신호, 스톱 손실 방식 등 측면에서 최적화하여 파라미터를 조정하여 최적의 효과를 찾을 수 있다.
/*backtest
start: 2023-12-10 00:00:00
end: 2023-12-17 00:00:00
period: 1m
basePeriod: 1m
exchanges: [{"eid":"Futures_Binance","currency":"BTC_USDT"}]
*/

//@version=4
strategy(shorttitle='Low volatility Buy w/ TP & SL (by Coinrule)',title='Low volatility Buy w/ TP & SL', overlay=true, initial_capital = 1000, process_orders_on_close=true, default_qty_type = strategy.percent_of_equity, default_qty_value = 100)

//Backtest dates
fromMonth = input(defval = 1,    title = "From Month",      type = input.integer, minval = 1, maxval = 12)
fromDay   = input(defval = 10,    title = "From Day",        type = input.integer, minval = 1, maxval = 31)
fromYear  = input(defval = 2019, title = "From Year",       type = input.integer, minval = 1970)
thruMonth = input(defval = 1,    title = "Thru Month",      type = input.integer, minval = 1, maxval = 12)
thruDay   = input(defval = 1,    title = "Thru Day",        type = input.integer, minval = 1, maxval = 31)
thruYear  = input(defval = 2112, title = "Thru Year",       type = input.integer, minval = 1970)

showDate  = input(defval = true, title = "Show Date Range", type = input.bool)

start     = timestamp(fromYear, fromMonth, fromDay, 00, 00)        // backtest start window
finish    = timestamp(thruYear, thruMonth, thruDay, 23, 59)        // backtest finish window
window()  => time >= start and time <= finish ? true : false       // create function "within window of time"

//MA inputs and calculations
movingaverage_fast = sma(close, input(50))
movingaverage_slow = sma(close, input(200))
movingaverage_normal= sma(close, input(100))


//Entry
strategy.entry(id="long", long = true, when = movingaverage_slow > movingaverage_normal and movingaverage_fast > movingaverage_normal)

//Exit
longStopPrice  = strategy.position_avg_price * (1 - 0.04)
longTakeProfit = strategy.position_avg_price * (1 + 0.08)

strategy.close("long", when = close < longStopPrice or close > longTakeProfit and window())

//PLOT

plot(movingaverage_fast, color=color.orange, linewidth=2)
plot(movingaverage_slow, color=color.purple, linewidth=3)
plot(movingaverage_normal, color=color.blue, linewidth=2)