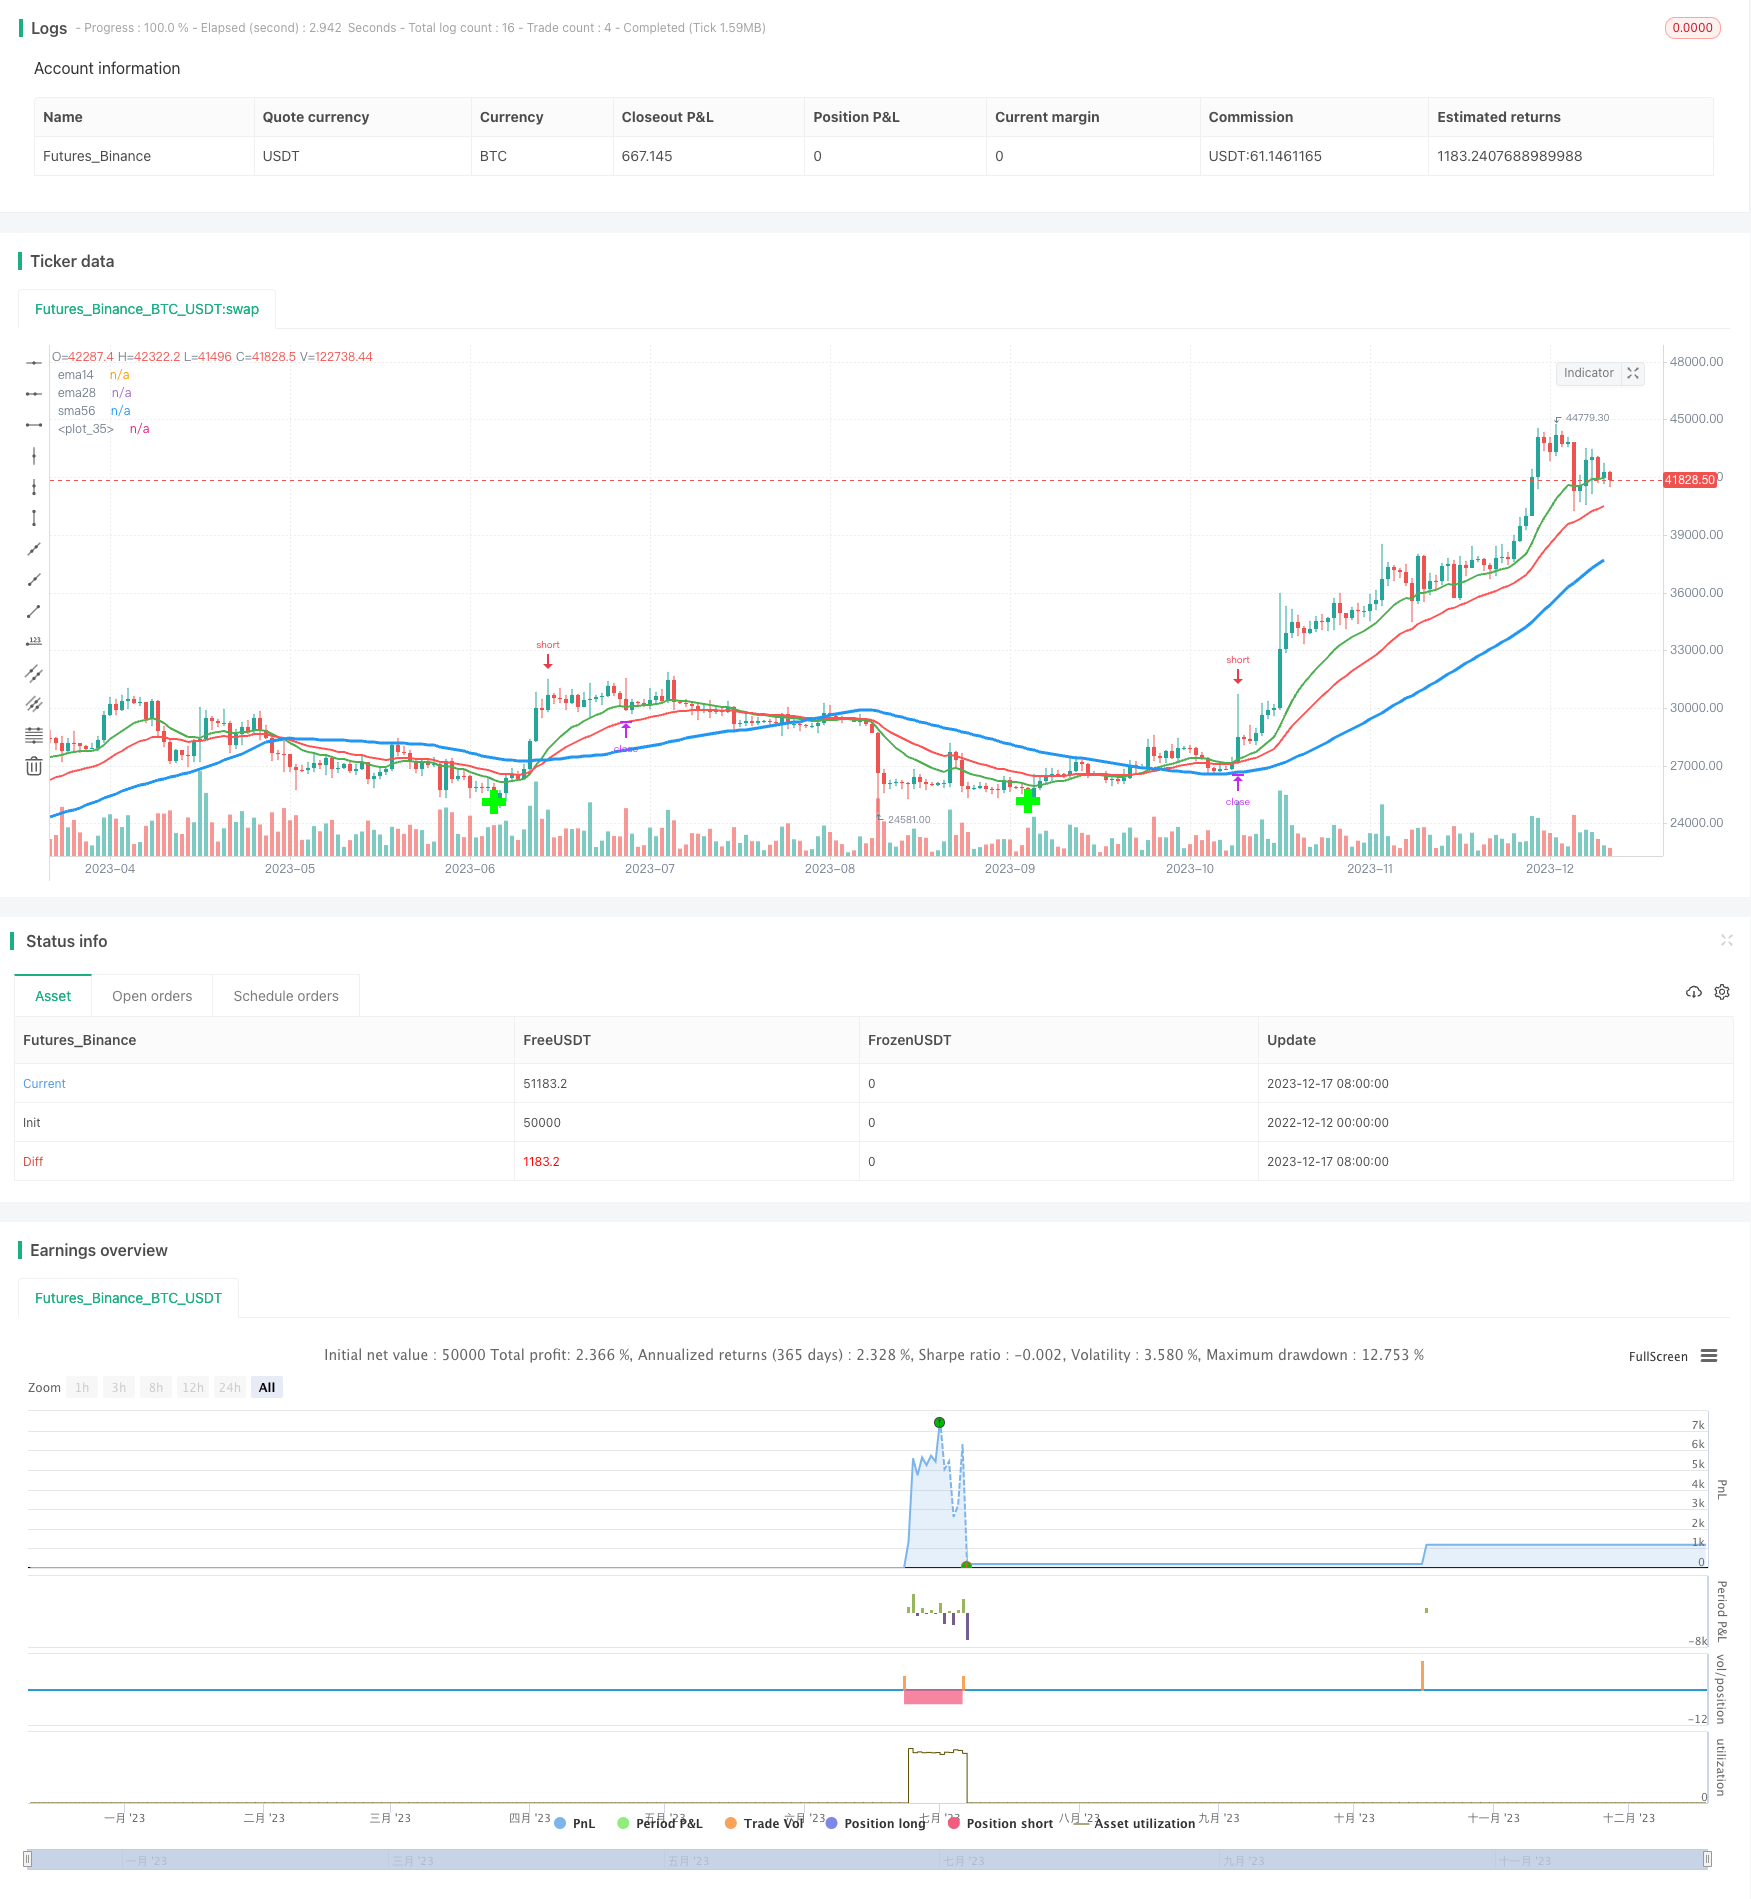
이동 평균 회전 전략
저자:차오장, 날짜: 2023-12-19 11:55:25태그:

전반적인 설명
이동 평균 인화 전략은 가격 이동 평균의 교차점을 추적하고, 황금 교차가 발생했을 때 역 트렌드 거래를 할 수있는 인화 기회를 식별합니다. 이 전략은 피보나치 인화 라인을 사용하여 단기 가격 인화를 포착하기 위해 엔트리 및 스톱 손실 / 이익 취득 수준을 설정합니다.
전략 논리
이 전략의 핵심은 14일 EMA와 56일 SMA라는 두 개의 이동 평균을 포함합니다. 14일 EMA가 56일 SMA를 밑에서 넘을 때 구매 신호를 유발합니다. 그 후 전략은 20일 후로 돌아서서 지지로 스윙 로프를 찾습니다. 크로스오버 포인트에서 닫는 가격과 결합하여 피보나치 풀백 라인이 그려집니다. 1.272 풀백 라인이 입점과 0.618 출구로 나타납니다. 따라서 전략은 골든 크로스 후에 짧은 진입 지점을 설정하고 가격이 실제로 0.618 라인에 다시 당겨지면 이익을 취합니다.
이 전략의 핵심 단계는 다음과 같습니다.
- 14일 EMA와 56일 SMA를 계산합니다.
- EMA가 SMA 황금 십자 신호 위에 넘어가는지 확인합니다.
- 뒷걸음을 돌아보며 낮은 스윙을 찾아서
- 낮은 점과 교차점을 가진 피보나치 회귀선을 그래프로 그려라.
- 1.272 회전선에서 짧은 엔트리를 설정합니다.
- 0.618 회수선에서 수익을 취하는 정지 설정
위의 설명은 이 인하 전략의 주요 작업 흐름과 논리를 설명합니다. 그것은 가격이 단기적으로 역전될 때 기회를 포착하는 것을 목표로합니다.
장점
이 이동 평균 회수 전략의 주요 장점은 다음과 같습니다.
- 전략 아이디어는 간단하고 이해하기 쉽습니다.
- 피보나치 이론을 활용하여 더 나은 위험 통제를 설정합니다.
- 좋은 수익을 위한 단기적 역전 기회를 포착할 수 있습니다.
- 진입을 촉발하기 위해서는 이동 평균의 황금 십자만 필요합니다.
요약하자면, 이것은 단기 평균회전 스타일 거래에 매우 적합합니다. 이윤을 얻는 인회 기회를 포착합니다. 전략은 또한 간단하고 직접적으로 구현됩니다.
위험성
이 전략의 장점에도 불구하고 다음과 같은 위험 요소가 있습니다.
- 장기 보유는 엄청난 손실을 초래할 수 있습니다.
- 회수 규모가 너무 작아서 수익을 얻을 수 없습니다.
- 너무 공격적인 철수선 설정.
위험을 줄이기 위해, 우리는 손실을 제어하기 위해 짧은 스톱 로스 시간 프레임을 설정할 수 있습니다. 또한 합리적인 수익 목표를 목표로 인출 라인 범위를 최적화 할 수 있습니다.
더 나은 기회
이 이동 평균 인하 전략을 최적화 할 수있는 많은 공간이 있습니다.
-
이동 평균 기간, 룩백 데이, 피보나치 배수 등과 같은 항목에 대한 다양한 매개 변수 설정을 테스트하여 최적을 찾습니다.
-
스톱 로스 메커니즘을 추가하여 여러 스톱이나 트레일링 스톱을 사용하여 위험을 더 잘 제어합니다.
-
부적절한 시장 조건을 피하기 위해 다른 지표를 필터로 도입합니다.
-
포지션 크기와 위험 관리 규칙을 최적화합니다.
엄격한 테스트와 최적화를 통해 이 거래 전략에 대한 상당한 개선이 이루어질 수 있습니다.
결론
이동 평균 인하 전략은 매우 실용적인 단기 거래 전략이다. 그것은 가격이 단기적으로 인하 될 때 평균 인하 기회를 포착한다. 전략 아이디어는 간단하고 이해하기 쉽습니다. 최적화와 위험 통제를 통해 해결해야 할 위험이 여전히 있습니다. 전반적으로 이것은 추가 연구와 응용에 가치가있는 유망한 수치 전략입니다.
/*backtest
start: 2022-12-12 00:00:00
end: 2023-12-18 00:00:00
period: 1d
basePeriod: 1h
exchanges: [{"eid":"Futures_Binance","currency":"BTC_USDT"}]
*/

//@version=2
strategy("MAC Pullback", overlay=true)

// Setting up timeperiod for testing
startPeriodYear = input(2014, "Backtest Start Year")
startPeriodMonth = input(1, "Backtest Start Month")
startPeriodDay = input(2, "Backtest Start Day")
testPeriodStart = timestamp(startPeriodYear, startPeriodMonth, startPeriodDay, 0, 0)

stopPeriodYear = input(2035, "Backtest Stop Year")
stopPeriodMonth = input(12, "Backtest Stop Month")
stopPeriodDay = input(30, "Backtest Stop Day")
testPeriodStop = timestamp(stopPeriodYear, stopPeriodMonth, stopPeriodDay, 0, 0)

// Moving Averages
ema14 = ema(close, 14)
ema28 = ema(close, 28)
sma56 = sma(close, 56)

// Plot
plot(ema14, title="ema14", linewidth=2, color=green)
plot(ema28, title="ema28", linewidth=2, color=red)
plot(sma56, title="sma56", linewidth=3, color=blue)


// Strategy
goLong = cross(ema14, sma56) and ema14 > ema28
goShort = cross(ema14, sma56) and ema14 < ema28


// Locate Swing Lows
leftBars = input(20)
rightBars=input(20)
swinglow = pivotlow(close, leftBars, rightBars)
plot(swinglow, style=cross, linewidth=8, color=#00FF00, offset=-rightBars)

if goLong == true and time >= testPeriodStart and time <= testPeriodStop
    // We try to make sure that we're catching the first Pullback after the crossover
    if ema14[12] < sma56[12]
        pivotpoint = lowest(40)[0] //lowest value of the month as our swing low

        // We calculate a Fib 1.272 extension (from the previous swing low to
        // the crossover long entry's open) and use this as our entry target to short the Pullback
        extensiontarget = ((close[1] - pivotpoint) * 1.27) + pivotpoint
        shorttarget = ((close[1] - pivotpoint) * 0.618) + pivotpoint

        strategy.order("Pullback", strategy.short, 5.0, limit=extensiontarget)
        // I would like to use a trailing stop but for know we just hope to get
        // filled if the pullback reaches all the way down to the 0.618.
        // We also place a tight stop loss since we trying to short an uptrend
        strategy.exit("Pullback Exit", "Pullback", limit=shorttarget, loss=400)
- 동력을 추적하는 것은 반전 전략을 의미합니다.
- 방향 이동 지수 쌍방향 거래 전략
- 볼링거 밴드 브레이크업 거래 전략
- 라구에르 RSI 거래 전략
- 역동적인 재입구 구매 전용 전략
- 바위처럼 단단한 VIP 양자 전략
- 골든 크로스 최적화 이동 평균 크로스오버 거래 전략
- 이동평균을 가로질러 전략
- 라지 베어 기반의 웨이브 트렌드 트레이딩 전략
- 8일 연장 전략
- 동적 MA 크로스오버 트렌드 전략
- 스토카스틱 이동 평균 전략
- 모멘텀 오스실레이션 이동 평균 전략으로 볼링거 밴드를 가로질러
- RSI 볼링거 밴드 단기 거래 전략
- 슈퍼 트렌드 추적 중지 손실 전략
- Intraday 전략에 따른 MACD 트렌드
- 이중 요인 평균 반전 추적 전략
- 트렌드 추적 전략
- 다중 지표 조합 적응 트렌드 전략
- 촛불 패턴 거래 전략