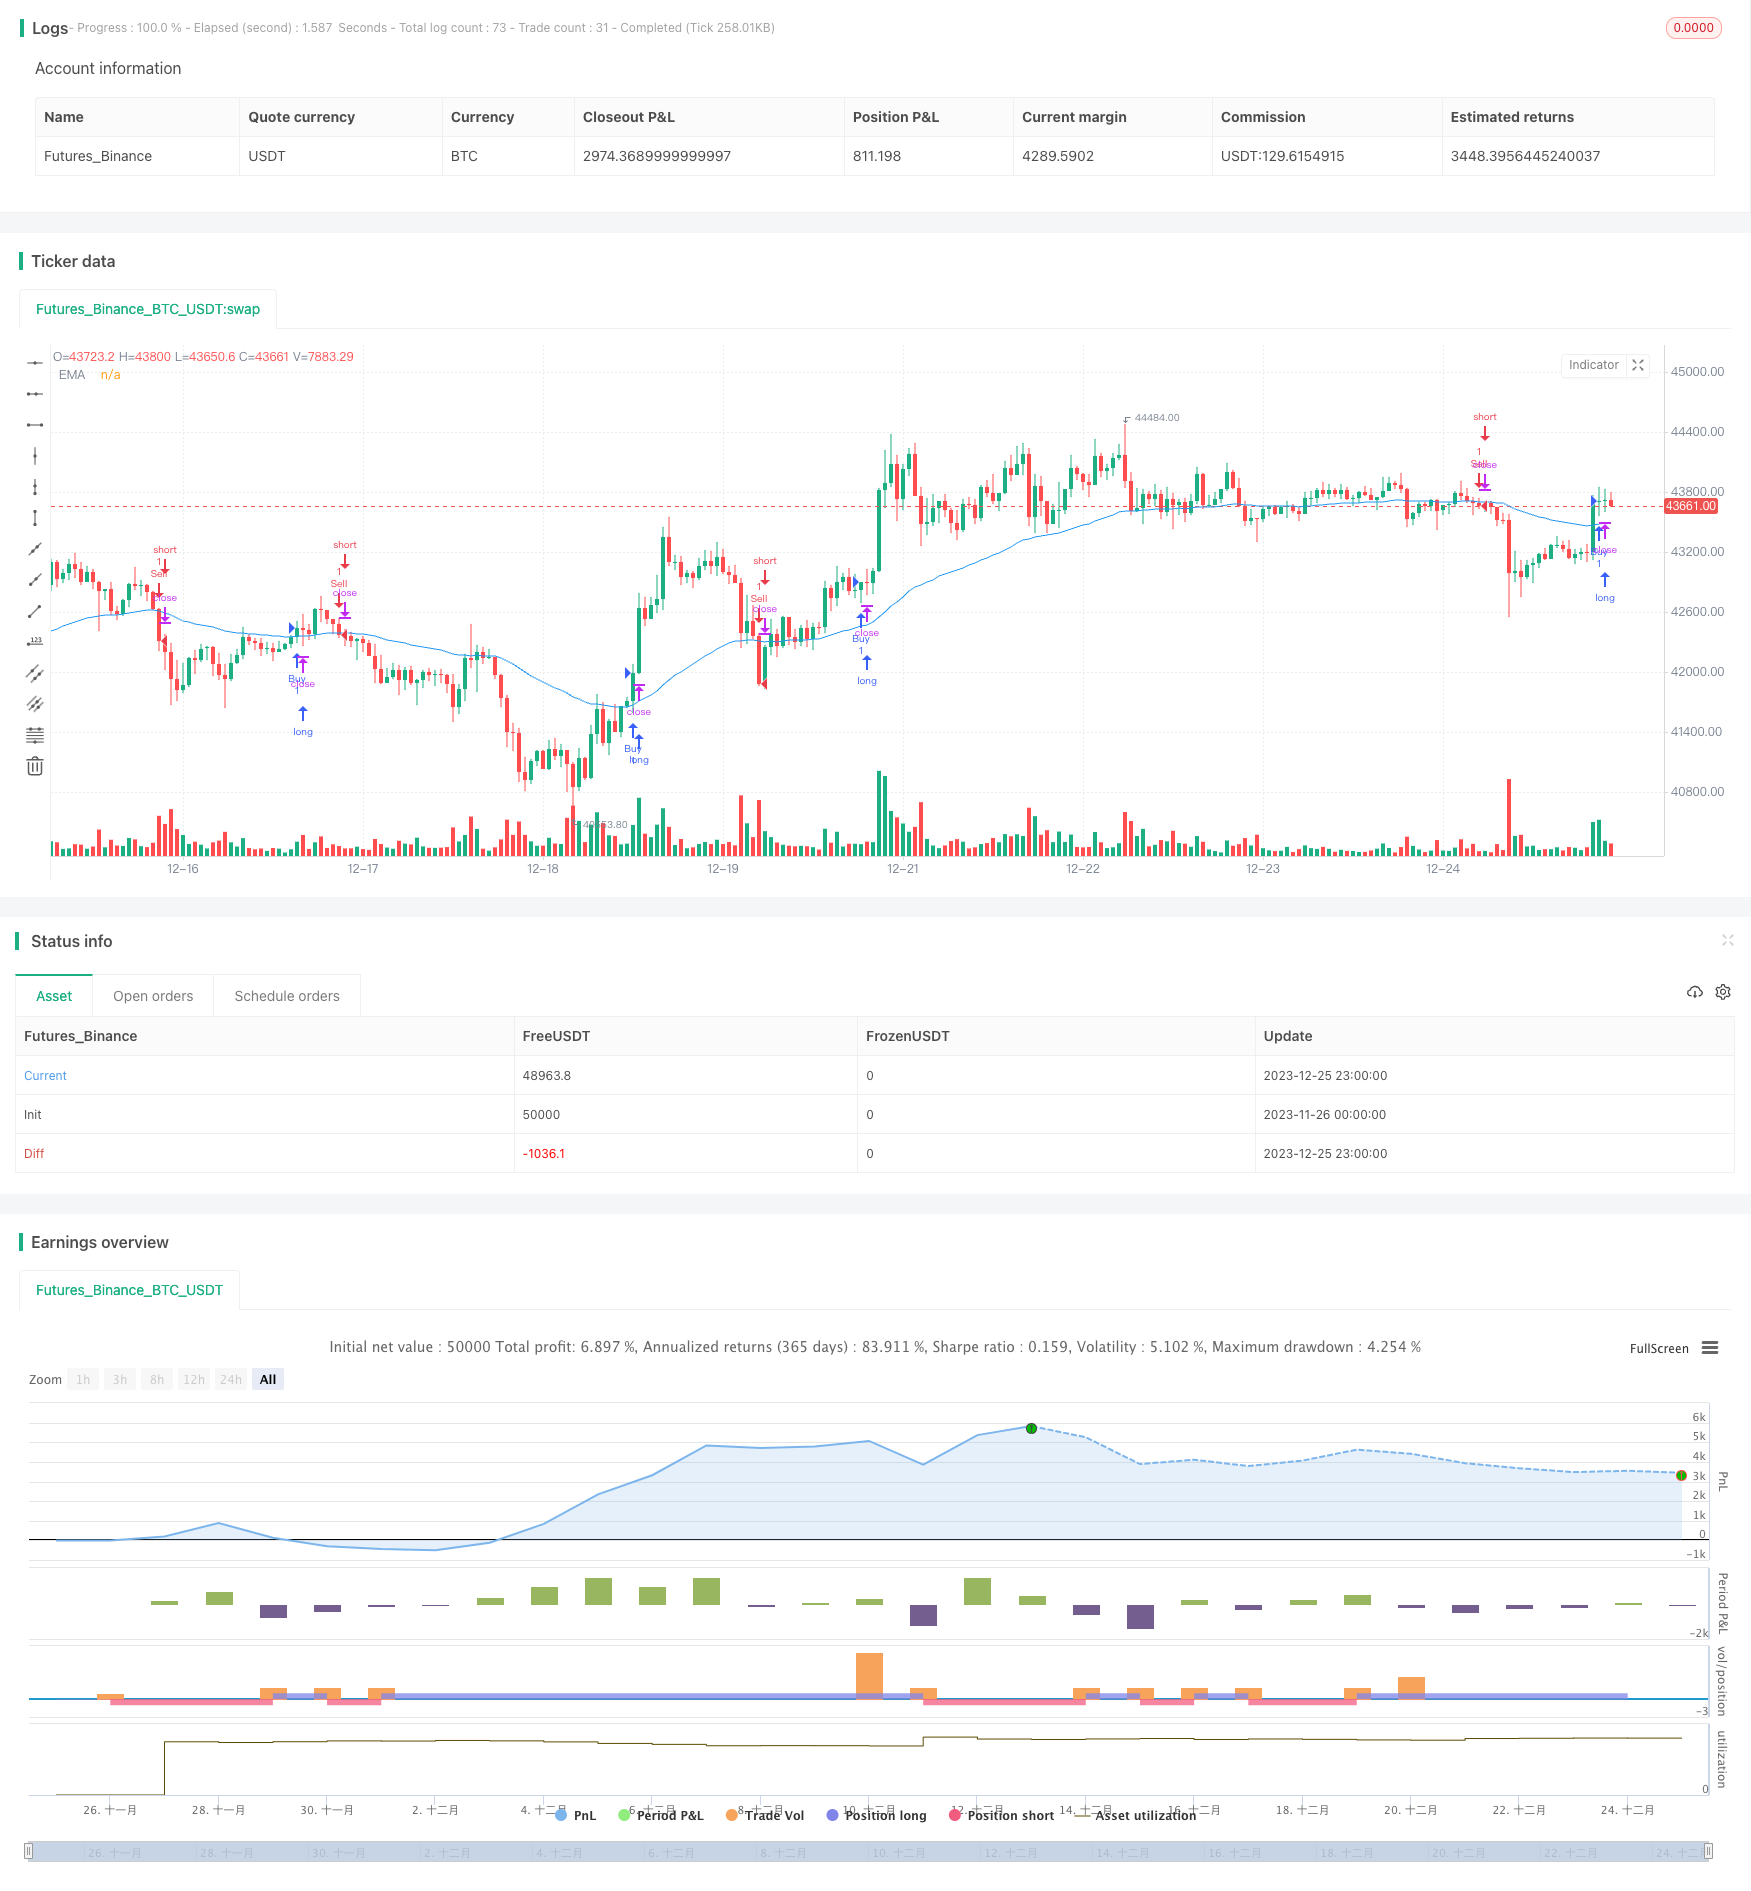
EMA 필터와 세션 타임프레임과 함께 상위 대 하위 클로즈 촛불 전략
저자:차오장, 날짜: 2023-12-27 14:38:28태그:

1. 전략 개요
이 전략은 EMA 필터와 세션 시간 프레임과 함께
2. 전략 논리
핵심 논리는 최근 룩백 기간 동안
세부적인 논리:
긴 신호는: inSession true (거래 세션에서) 와 upCloseCount > downCloseCount (더 많은 가까운 촛불) 와 close > ema (EMA보다 높은 닫기 가격) 과 currentSignal가
짧은 신호는: inSession true and downCloseCount > upCloseCount (더 아래로 닫는 촛불) 및 close < ema (EMA보다 낮은 닫는 가격) 및 currentSignal가
3. 이점 분석
- 시장 정서와 추세를 캡처 하 고 닫기 / 다운 닫기 촛불 역사를 비교
- EMA 필터를 사용 하 여 다양한 시장에서 거래를 피합니다.
- 세션을 설정하여 주요 거래 시간 이외의 잡음을 피하십시오.
- 트렌드 추종과 거래 빈도 사이의 균형
4. 위험 분석
- 옆 시장에서 오도 될 수 있습니다.
- 부적절한 EMA 매개 변수는 비효율적인 필터를 일으킬 수 있습니다.
- 부적절하게 설정된 세션에서 놓친 기회
- 이벤트로 인한 공백을 캡처할 수 없습니다
해결책:
- EMA 매개 변수를 최적화
- 거래 세션 최적화
- ATR를 기준으로 스톱 로스를 추가합니다.
- 사건들을 파악하고, 틈을 피하세요
5. 최적화 방향
- 거래 세션 최적화
- EMA 매개 변수를 최적화
- ATR 기반 스톱 손실을 추가합니다.
- 사건들을 파악하고, 틈을 피하세요
- 더 나은 필터를 위해 다른 지표와 결합
- 제품별 테스트 및 조정
6. 요약
이 전략은 미리 설정된 거래 세션 내에서,
/*backtest
start: 2023-11-26 00:00:00
end: 2023-12-26 00:00:00
period: 1h
basePeriod: 15m
exchanges: [{"eid":"Futures_Binance","currency":"BTC_USDT"}]
*/

//@version=5
strategy("Up vs Down Close Candles Strategy with EMA and Session Time Frames", shorttitle="UvD Strat EMA Session", overlay=true)

// User input to define the lookback period, EMA period, and session strings for time frames
int lookback = input(20, title="Lookback Period")
int emaPeriod = input(50, title="EMA Period")
string session1 = input("0900-1200", title="Time Frame 1 Session")
string session2 = input("1300-1600", title="Time Frame 2 Session")

// Calculate the EMA
float ema = ta.ema(close, emaPeriod)

// State variable to track the current signal
var string currentSignal = na

// Counting up-close and down-close candles within the lookback period
int upCloseCount = 0
int downCloseCount = 0

if barstate.isnew
    upCloseCount := 0
    downCloseCount := 0
    for i = 0 to lookback - 1
        if close[i] > close[i + 1]
            upCloseCount += 1
        else if close[i] < close[i + 1]
            downCloseCount += 1

// Define the long (buy) and short (sell) conditions with EMA filter and session time frame
bool inSession = time(timeframe.period, session1) or time(timeframe.period, session2)
bool longCondition = inSession and upCloseCount > downCloseCount and close > ema and currentSignal != "long"
bool shortCondition = inSession and downCloseCount > upCloseCount and close < ema and currentSignal != "short"

// Enter or exit the market based on conditions
if longCondition
    currentSignal := "long"
    strategy.entry("Buy", strategy.long)

if shortCondition
    currentSignal := "short"
    strategy.entry("Sell", strategy.short)

// Exit logic for long and short positions
if currentSignal == "long" and strategy.position_size <= 0
    strategy.close("Sell")

if currentSignal == "short" and strategy.position_size >= 0
    strategy.close("Buy")

plot(ema, color=color.blue, title="EMA")
- 전략에 따른 평탄한 하이킨 아시 트렌드
- 동력 방향 격차 전략
- 일내 트렌드 다중 스톱 로스 전략
- 이동 평균과 지원 저항에 기초한 카나 촛불의 브레이크업 전략
- 트리플 슈퍼트렌드 이치모쿠 클라우드 양적 거래 전략
- 이중 전략 조합
스토카스틱 느리고 상대적 강도 지수 - JBravo 양적 동향 전략
- 켈트너 채널 철회 전략
- 트렌딩 다바스 박스 양적 거래 전략
- MFI 및 MA 기반의 양적 역전 전략
- 이중 RSI 돌파구 전략
- 크로스 페어 볼링거 밴드 크로스 오버 양적 전략
- 부일시 삼키기 구매 및 판매 전략
- 퀀트 비트코인 거래 전략 MACD, RSI 및 FIB를 결합
- 이중 이동 평균 금십자 양적 전략
- 마진 콜 리스크 관리 전략과 함께 레버리지 포지션 사이징
- 이치모쿠 균형선 전략
- 이치모쿠 클라우드, 이중 이동 평균 크로스오버 전략
- ATR 및 브레이크아웃에 기반한 ETF 거래 전략
- 슈퍼트렌드 전략 추적