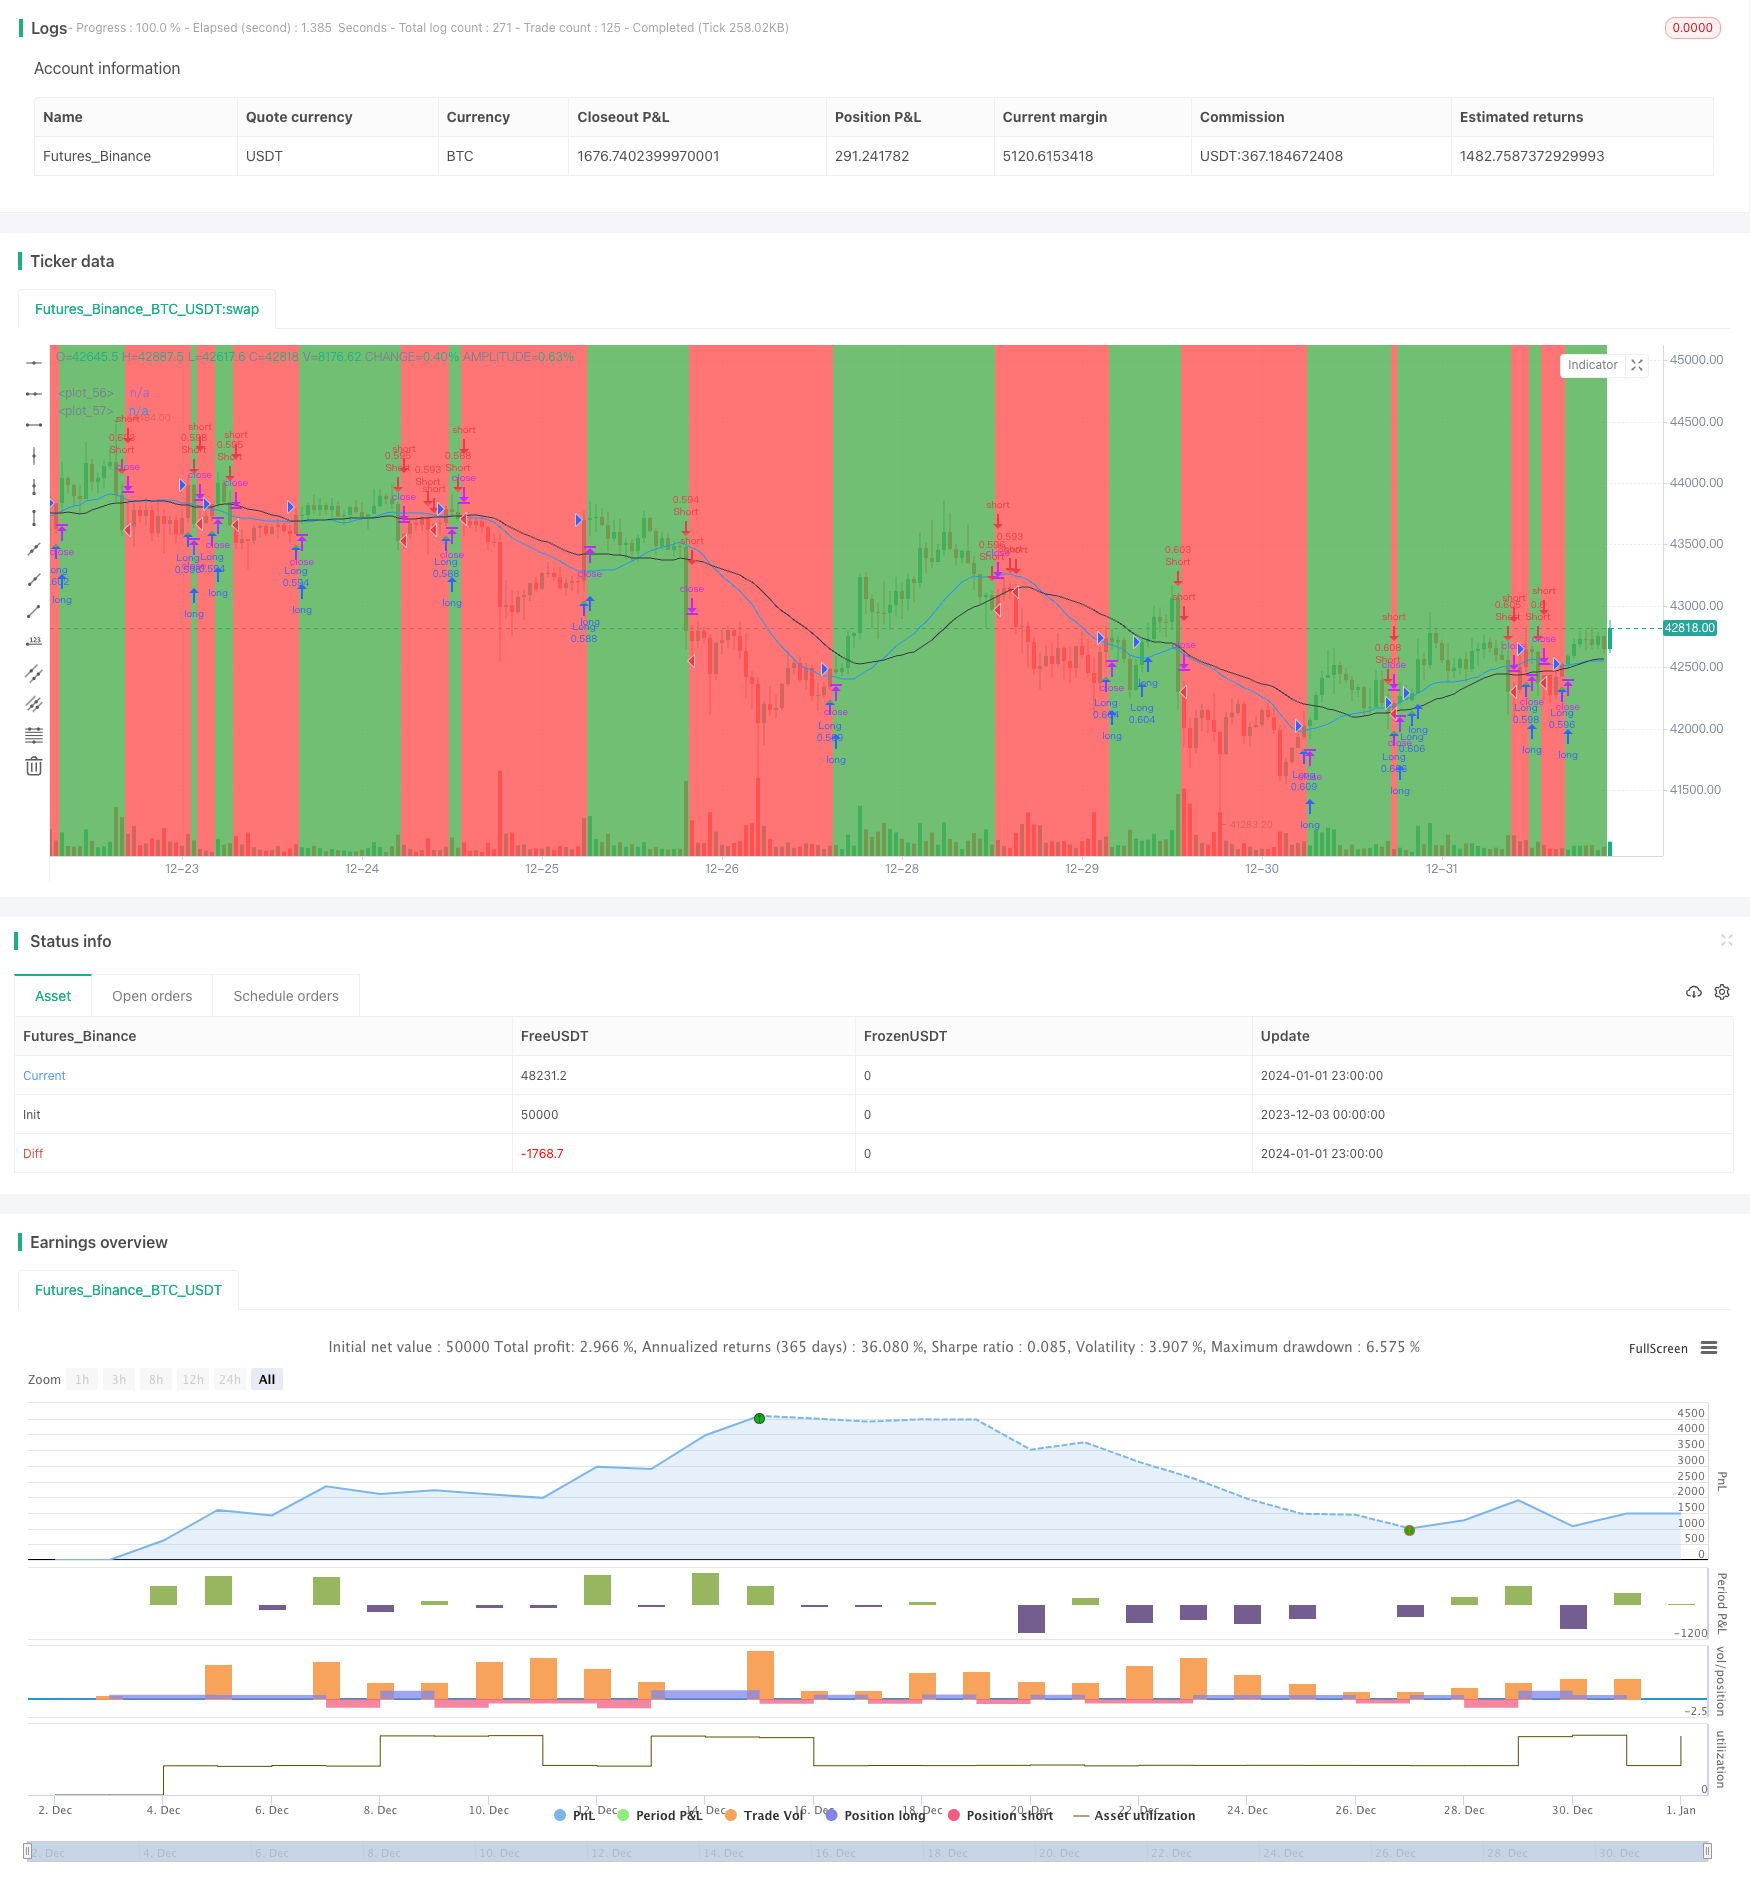
이동 평균 크로스오버 시스템
저자:차오장, 날짜: 2024-01-03 16:22:18태그:

전반적인 설명
이것은 이동 평균 크로스오버 신호에 기반한 트렌드-추천 전략이다. 빠른 이동 평균이 아래에서 느린 이동 평균을 넘을 때 구매 신호가 생성됩니다. 빠른 이동 평균이 위에서 느린 이동 평균을 넘을 때 판매 신호가 생성됩니다.
전략 논리
이 전략은 20주기 간단한 이동 평균과 30주기 간단한 이동 평균, 두 개의 이동 평균을 사용합니다. 20주기 MA가 30주기 MA를 넘을 때 구매 신호가 생성됩니다. 20주기 MA가 30주기 MA를 넘을 때 판매 신호가 유발됩니다.
이동 평균 자체는 트렌드 지표로 작용하여 시장 트렌드 방향을 효과적으로 나타냅니다. 크로스오버 원칙은 전략이 트렌드 반전 지점을 적시에 파악하고 거래 신호를 생성 할 수 있습니다. 20 일 및 30 일 기간은 소음에 너무 민감하지 않고 시장 트렌드를 반영하도록 적절하게 설정됩니다.
이점 분석
이 전략의 주요 장점은 다음과 같습니다.
- 논리는 간단하고 명확하고, 이해하기 쉽고 실행하기 쉽고, 초보자에도 적합합니다.
- 트렌드에 따라 거래하면 트렌드에 반대되는 포지션과 불필요한 손실을 피할 수 있습니다.
- 이동 평균은 시장 소음을 제거하고 잘못된 신호를 피하기 위해 필터링 효과를 가지고 있습니다.
- 패러미터 설정은 너무 민감하지 않도록 합리적입니다.
위험 분석
이 전략의 주요 위험은 다음과 같습니다.
- 이동평균의 크로스오버가 자주 발생하면 시장 연립 중에 자주 스톱 로스 오더가 발사될 수 있습니다.
- 강력한 추세에 따라 이동 평균의 후진 특성으로 인해 일부 수익을 놓치고 있습니다.
- 부적절한 매개 변수 설정이 안정성에 영향을 줄 수 있습니다.
해결책:
- 이동 평균 기간을 조정하고, 곡선을 매끄럽히고 교차 빈도를 줄이기 위해 삼각형 이동 평균 등을 사용합니다.
- 추세를 결정하기 위해 다른 지표를 사용하고, 통합 중 거래를 피하십시오.
- 가장 좋은 조합을 찾기 위해 매개 변수를 최적화하세요.
최적화 방향
전략의 최적화를 위한 주요 측면:
- 가동 평균의 다른 종류를 테스트, 가중화 가동 평균, 삼각형 가동 평균 등;
- 다른 기술적 지표를 추가하여 통합 과정에서 신호를 피합니다.
- 트렌드를 결정하기 위해 엘리엇 파동, 채널 이론과 같은 다른 분석 기술을 포함합니다.
- 매개 변수를 동적으로 최적화하기 위해 기계 학습 모델을 채택합니다.
- 양자 도구를 활용하고 금전 관리를 정비하기 위해 손해를 멈추고/이익을 취하는 기술을 적용하십시오.
결론
이동 평균 크로스오버 시스템은 트렌드를 따르는 간단하고 효과적인 전략이다. 논리는 명확하고 이해하기 쉽고 초보자도 배우기에 매우 적합하다. 트렌드를 따라 트레이딩하는 이동 평균 크로스오버와 수익을 기반으로 거래 신호를 생성한다. 전략은 더 안정적이고 효율적이 되기 위해 여러 가지 방법으로 최적화 될 수 있다.
/*backtest
start: 2023-12-03 00:00:00
end: 2024-01-02 00:00:00
period: 1h
basePeriod: 15m
exchanges: [{"eid":"Futures_Binance","currency":"BTC_USDT"}]
*/

// This source code is subject to the terms of the Mozilla Public License 2.0 at https://mozilla.org/MPL/2.0/
// © gliese581d

//@version=4
strategy(title="Moving Averages Testing", overlay=true, precision=2, calc_on_every_tick=false, max_bars_back=5000, pyramiding=2,
 default_qty_type=strategy.percent_of_equity, default_qty_value=50, commission_type=strategy.commission.percent, initial_capital=10000)


//SETTINGS

longs_on = input(title="Long Trades enabled", defval=true)
shorts_on = input(title="Short Trades enabled", defval=true)

long_cond = input(title="Buy/Long Crossover Condition", defval="price x MA1", options=["price x MA1", "price x MA2", "MA1 x MA2"])
short_cond = input(title="Sell/Short Crossunder Condition", defval="price x MA2", options=["price x MA1", "price x MA2", "MA1 x MA2"])

ma1_type = input(title="Moving Average 1 Type", defval="SMA", options=["SMA", "EMA"])
ma1_len = input(defval=20, title="Moving Average 1 Len", type=input.integer, minval=1, maxval=1000, step=1)
ma2_type = input(title="Moving Average 2 Type", defval="SMA", options=["SMA", "EMA"])
ma2_len = input(defval=30, title="Moving Average 2 Len", type=input.integer, minval=1, maxval=1000, step=1)


//MOVING AVERAGES

ma_1 = ma1_type == "EMA" ? ema(close, ma1_len) : sma(close, ma1_len)
ma_2 = ma2_type == "EMA" ? ema(close, ma2_len) : sma(close, ma2_len)


//STRATEGY

//trade entries
long_entry = long_cond == "price x MA1" ? crossover(close, ma_1) : long_cond == "price x MA2" ? crossover(close, ma_2) : long_cond == "MA1 x MA2" ? crossover(ma_1, ma_2) : false
short_entry = short_cond == "price x MA1" ? crossunder(close, ma_1) : short_cond == "price x MA2" ? crossunder(close, ma_2) : short_cond == "MA1 x MA2" ? crossunder(ma_1, ma_2) : false

start_month = input(defval=4, title="Strategy Start Month", type=input.integer, minval=1, maxval=12, step=1)
start_year = input(defval=2018, title="Strategy Start Year", type=input.integer, minval=2000, maxval=2025, step=1)
end_month = input(defval=12, title="Strategy End Month", type=input.integer, minval=1, maxval=12, step=1)
end_year = input(defval=2020, title="Strategy End Year", type=input.integer, minval=2000, maxval=2025, step=1)

in_time =true

strategy.entry("Long", strategy.long, when=longs_on and in_time and long_entry)
strategy.close("Long", when=longs_on and not shorts_on and short_entry)

strategy.entry("Short", strategy.short, when=shorts_on and in_time and short_entry)
strategy.close("Short", when=shorts_on and not longs_on and long_entry)


//PLOTTING

//color background
last_entry_was_long = nz(barssince(long_entry)[1], 5000) < nz(barssince(short_entry)[1], 5000)
bgcol = (longs_on and last_entry_was_long) ? color.green : (shorts_on and not last_entry_was_long) ? color.red : na
bgcolor(color=bgcol, transp=90)

plot((long_cond == "price x MA1" or long_cond == "MA1 x MA2") or (short_cond == "price x MA1" or short_cond == "MA1 x MA2") ? ma_1 : na, color=color.blue)
plot((long_cond == "price x MA2" or long_cond == "MA1 x MA2") or (short_cond == "price x MA2" or short_cond == "MA1 x MA2") ? ma_2 : na, color=color.black)
plotshape(long_entry, style=shape.triangleup, location=location.belowbar, color=color.green)
plotshape(short_entry, style=shape.triangledown, location=location.abovebar, color=color.red)
더 많은
- 이동평균 시스템에 기반한 그리드 거래 전략
- 추진력 역전 전략
- 크로싱 이동 평균 트렌드 추적 전략
- 피보나치 황금 비율 및 상대적 강도 RSI 전략
- 복합 전략에 기반한 인버스 및 중력 중심 통합 거래 전략
- 이중 및 삼중 기하급수적 이동 평균 교차 전략
- 볼링거 밴드 브레이크업 스윙 거래 전략
- 트렌드 추적 역전 전략
- AlexInc의 바 v1.2 의미있는 바 필터링에 기초한 브레이크아웃 축적 전략
- 지수 이동 평균과 후속 스톱 손실 및 비율 스톱 손실을 결합하는 주식 양 거래 전략
- 다음 오픈 이윤 취득 전략
- 이동 중지 손실 추적 전략
- 가른 미 분석 지표에 기초한 단기 트렌드 추적 전략
- 가우스 이동 평균 거래 전략
- 적응적인 카우프만 이동 평균 트렌드 전략
- 대역 패스 필터링 트렌드 추출 전략
- 이중 반전 높은-저기 전략
- 하이핑 이동 평균 트렌드 전략
- 멀티 타임프레임 이동 평균 및 MACD를 기반으로 한 긴 및 짧은 오픈 전략
- 모멘텀 인디케이터 RSI 역전 거래 전략