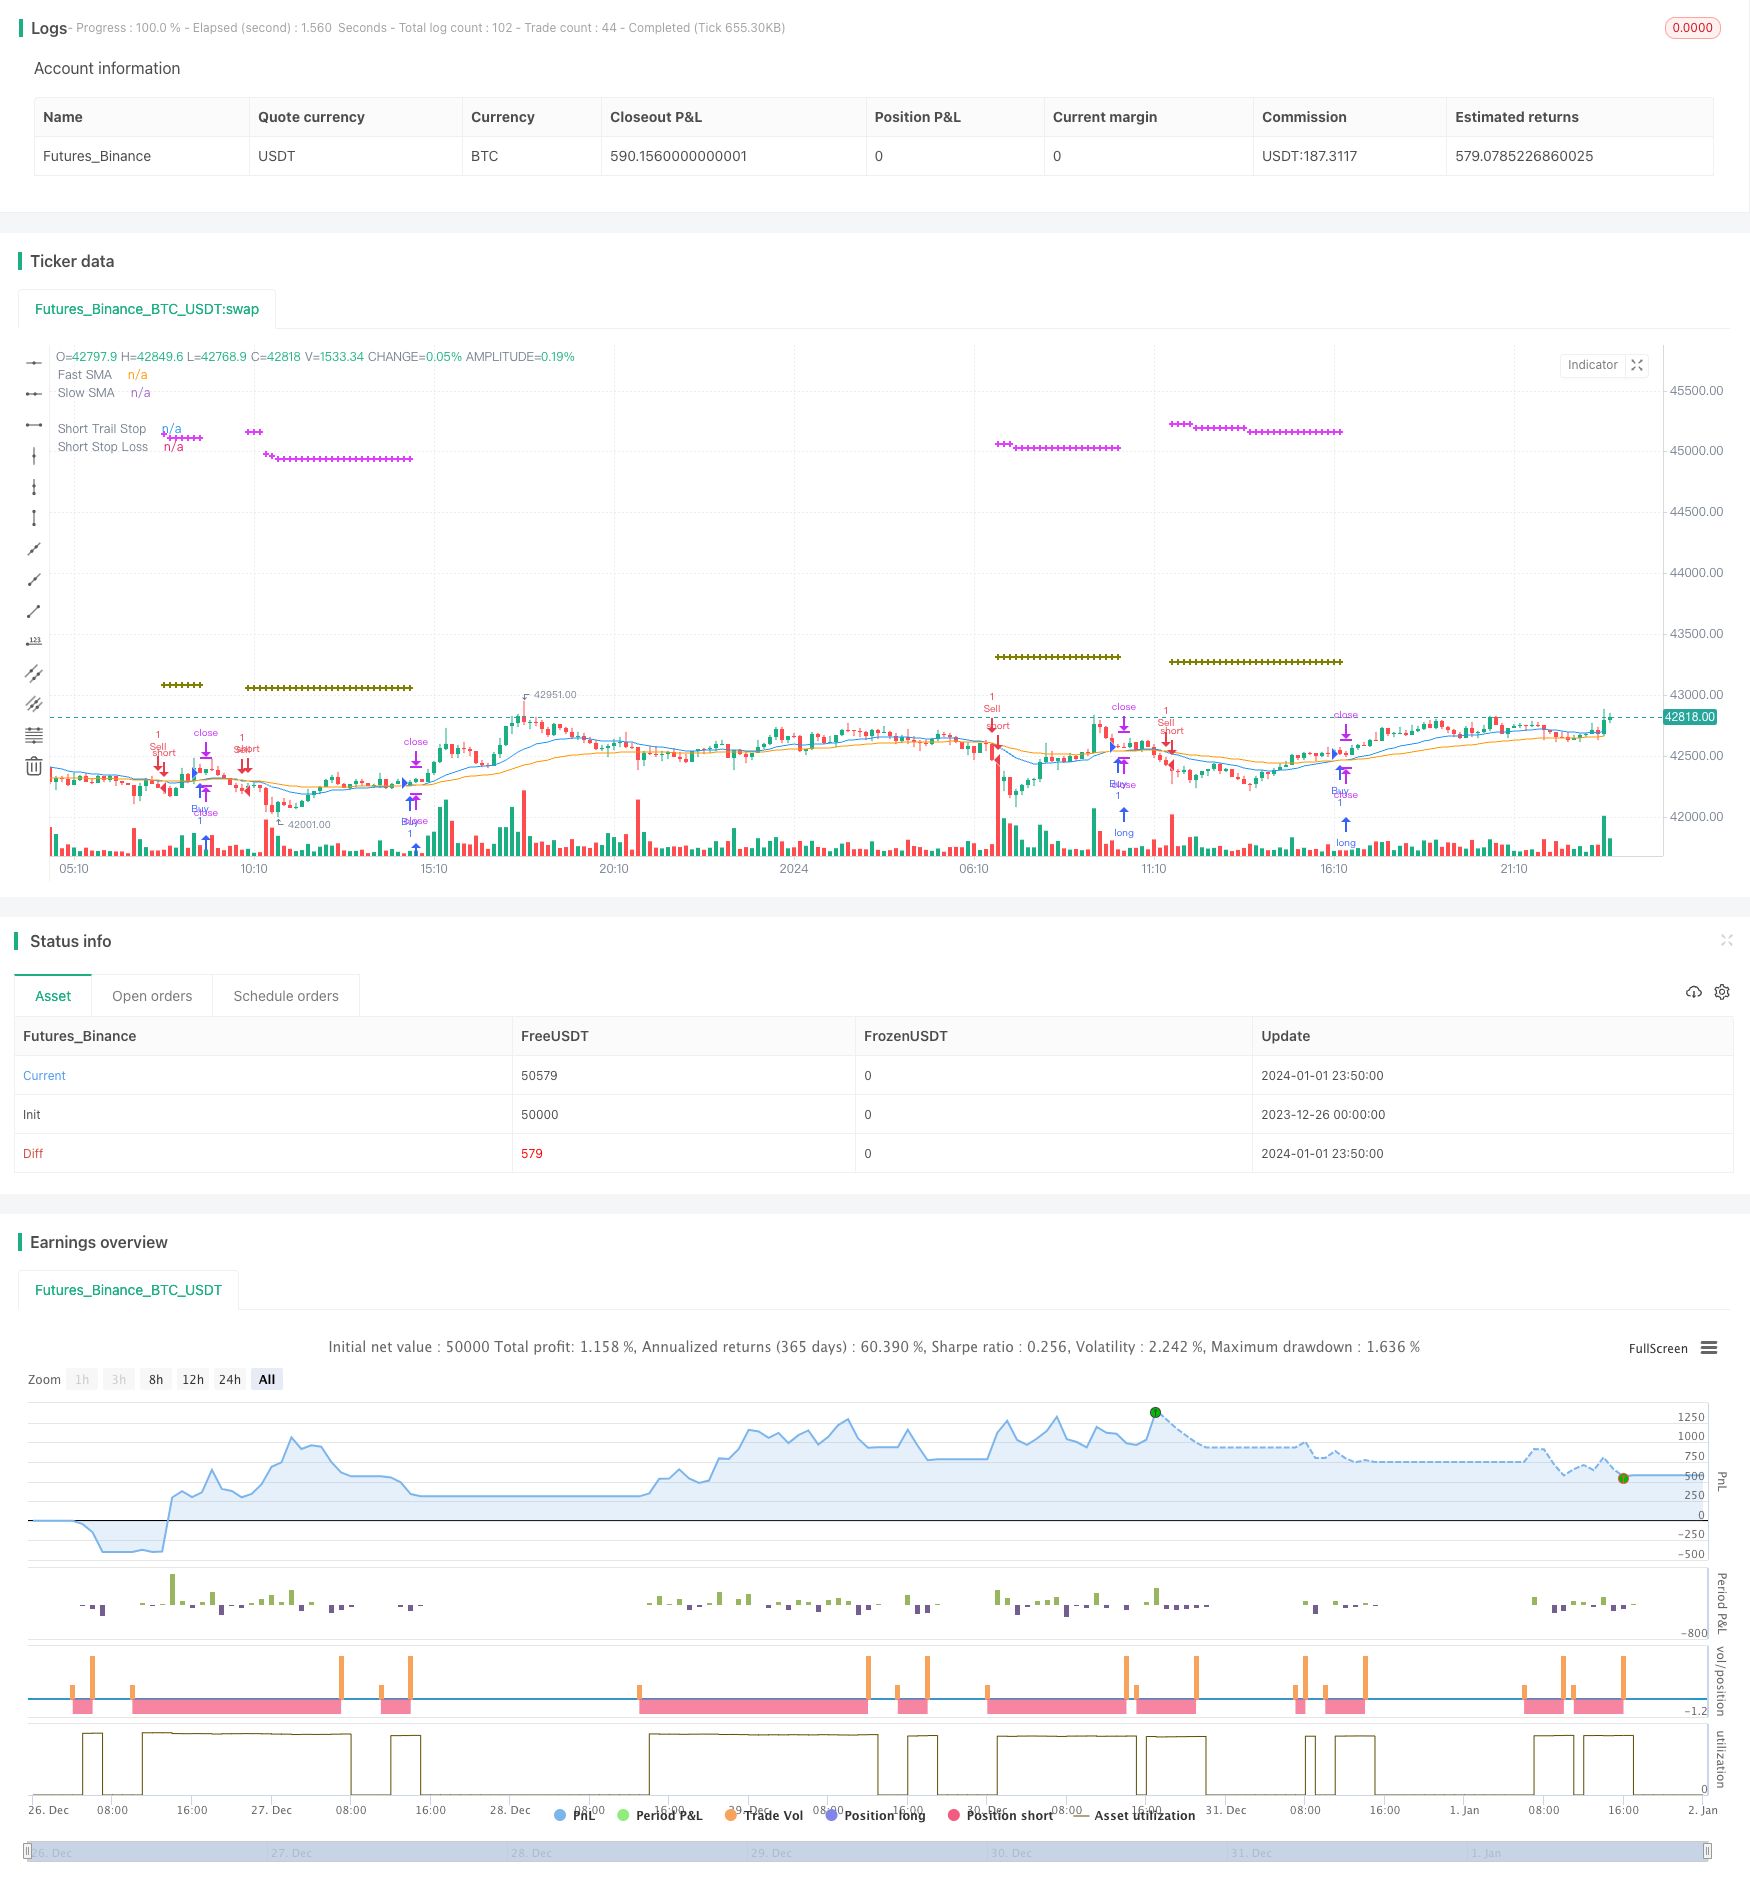
지수 이동 평균과 후속 스톱 손실 및 비율 스톱 손실을 결합하는 주식 양 거래 전략
저자:차오장, 날짜: 2024-01-03 16:25:54태그:

전반적인 설명
이 전략의 핵심은 기하급수적인 이동 평균 크로스오버를 거래 신호로 사용하여 수익을 차단하고 위험을 제어하기 위해 후속 스톱 손실과 퍼센트 스톱 손실을 결합합니다. 전략은 구현이 간단하고 양적 거래에 대한 주식 및 기타 금융 제품에 적용됩니다.
전략 논리
-
빠른 EMA와 느린 EMA를 계산합니다. 빠른 EMA 기간은 20일이고 느린 EMA 기간은 50일입니다. 빠른 EMA가 느린 EMA를 넘을 때 구매 신호를 생성하고 빠른 EMA가 느린 EMA를 넘을 때 판매 신호를 생성합니다.
-
진입 후, 보유 방향에 따라 후속 스톱 손실을 설정합니다. 예를 들어, 긴 포지션의 7%와 짧은 포지션의 7%입니다. 후속 스톱 손실은 가능한 최대 이익을 잠금하기 위해 모든 바를 조정합니다.
-
동시에 입상 가격과 보유 방향에 따라 스톱 로스 가격을 설정합니다. 예를 들어, 긴 거래의 입상 가격보다 2% 낮고 짧은 거래의 입상 가격보다 2% 높습니다. 과도한 손실을 방지하기 위해 스톱 로스 가격은 변경되지 않습니다.
-
후속 스톱 가격과 스톱 손실 가격을 비교하고, 이 거래의 최종 스톱 손실로 시장 가격에 더 가까운 것을 사용하여, 스톱 손실 명령을 보내십시오.
장점
-
간단하고 실행하기 쉬운 이동 평균 거래 신호입니다.
-
트래일링 스톱 로스는 가능한 한 큰 범위에서 이익을 잠금하고 잘못된 신호로 인한 불필요한 손실을 피합니다.
-
% Stop Loss는 직관적이고 거래당 최대 손실을 제어하기 위해 쉽게 조정됩니다.
-
트레일링 스톱과 고정 스톱을 결합하면 이윤을 확보하고 위험을 조절합니다.
위험 과 대책
-
이동평균은 잘못된 신호를 쉽게 생성할 수 있습니다. 부피와 같은 추가 필터를 추가합니다.
-
트레일링 스톱은 너무 일찍 발사되기도 합니다. 트레일링 퍼센트를 좀 느리게 합니다.
-
부적절한 고정 스톱 손실 설정은 너무 공격적이거나 보수적일 수 있습니다.
-
기계적 스톱 손실 출구는 시장 반전 기회를 놓칠 수 있습니다. 스톱 트리거를 판단하는 기술적 지표를 포함합니다.
최적화 방향
-
최적의 균형을 찾기 위해 다른 EMA 조합을 시도해보세요.
-
부진 신호를 필터링하기 위해 부피와 같은 지표를 추가합니다.
-
더 많은 주식을 테스트하여 적절한 스톱 로스 비율을 찾으십시오.
-
시장 조건에 맞게 적응식 정지기를 시도해보세요.
-
RSI와 같은 지표를 포함해서 스톱 로스 타이밍을 결정합니다.
요약
이 전략은 이동 평균 거래 신호, 트레일링 스톱 및 비율 스톱을 통합합니다. 매개 변수 최적화를 통해 다양한 주식 및 상품에 대한 엄격한 위험 통제와 함께 안정적인 수익을 얻을 수 있습니다. 양 트레이더에 대한 연구와 지속적인 개선이 가치가 있습니다.
/*backtest
start: 2023-12-26 00:00:00
end: 2024-01-02 00:00:00
period: 10m
basePeriod: 1m
exchanges: [{"eid":"Futures_Binance","currency":"BTC_USDT"}]
*/

// This source code is subject to the terms of the Mozilla Public License 2.0 at https://mozilla.org/MPL/2.0/
// © wouterpruym1828

//@version=5
strategy(title=" Combining Trailing Stop and Stop loss (% of instrument price)",
     overlay=true, pyramiding=1, shorttitle="TSL&SL%")

//INDICATOR SECTION

// Indicator Input options+
i_FastEMA = input.int(title = "Fast EMA period", minval = 0, defval = 20)
i_SlowEMA = input.int(title = "Slow EMA period", minval = 0, defval = 50)

// Calculate moving averages
fastEMA = ta.ema(close, i_FastEMA)
slowEMA = ta.ema(close, i_SlowEMA)

// Plot moving averages
plot(fastEMA, title="Fast SMA", color=color.blue)
plot(slowEMA, title="Slow SMA", color=color.orange)


//STRATEGY SECTION

// Calculate trading conditions
buy  = ta.crossover(fastEMA, slowEMA)
sell = ta.crossunder(fastEMA, slowEMA)

// STEP 1:
// Configure trail stop loss level with input options (optional)

longTrailPerc = input.float(title="Long Trailing Stop (%)", minval=0.0, step=0.1, defval=7) * 0.01

shortTrailPerc = input.float(title="Short Trailing Stop (%)", minval=0.0, step=0.1, defval=7) * 0.01

//Configure stop loss level with input options (optional)

longStopPerc = input.float(title="Long Stop Loss (%)", minval=0.0, step=0.1, defval=2)*0.01

shortStopPerc = input.float(title="Short Stop Loss (%)", minval=0.0, step=0.1, defval=2)*0.01


// STEP 2:
// Determine trail stop loss prices
longTrailPrice = 0.0, shortTrailPrice = 0.0

longTrailPrice := if (strategy.position_size > 0)
    stopValue = high * (1 - longTrailPerc)
    math.max(stopValue, longTrailPrice[1])
else
    0

shortTrailPrice := if (strategy.position_size < 0)
    stopValue = low * (1 + shortTrailPerc)
    math.min(stopValue, shortTrailPrice[1])
else
    999999

// Determine stop loss prices
entryPrice = 0.0

entryPrice := strategy.opentrades.entry_price(strategy.opentrades - 1)


longLossPrice = entryPrice * (1 - longStopPerc)

shortLossPrice = entryPrice * (1 + shortStopPerc)


// Plot stop loss values for confirmation

plot(series=(strategy.position_size > 0) ? longTrailPrice : na,
     color=color.fuchsia, style=plot.style_cross,
     linewidth=2, title="Long Trail Stop")
plot(series=(strategy.position_size < 0) ? shortTrailPrice : na,
     color=color.fuchsia, style=plot.style_cross,
     linewidth=2, title="Short Trail Stop")

plot(series=(strategy.position_size > 0) ? longLossPrice : na,
     color=color.olive, style=plot.style_cross,
     linewidth=2, title="Long Stop Loss")
plot(series=(strategy.position_size < 0) ? shortLossPrice : na,
     color=color.olive, style=plot.style_cross,
     linewidth=2, title="Short Stop Loss")

// Submit entry orders
if (buy)
    strategy.entry("Buy", strategy.long)

if (sell)
    strategy.entry("Sell", strategy.short)


//Evaluating trailing stop or stop loss to use

longStopPrice = longTrailPrice < longLossPrice ? longLossPrice : longTrailPrice

shortStopPrice = shortTrailPrice > shortLossPrice ? shortLossPrice : shortTrailPrice

// STEP 3:
// Submit exit orders for stop price

if (strategy.position_size > 0)
    strategy.exit(id="Buy Stop", stop=longStopPrice)

if (strategy.position_size < 0)
    strategy.exit(id="Sell Stop", stop=shortStopPrice)
- 가격 동력 추적 전략
- 이동평균 시스템에 기반한 그리드 거래 전략
- 추진력 역전 전략
- 크로싱 이동 평균 트렌드 추적 전략
- 피보나치 황금 비율 및 상대적 강도 RSI 전략
- 복합 전략에 기반한 인버스 및 중력 중심 통합 거래 전략
- 이중 및 삼중 기하급수적 이동 평균 교차 전략
- 볼링거 밴드 브레이크업 스윙 거래 전략
- 트렌드 추적 역전 전략
- AlexInc의 바 v1.2 의미있는 바 필터링에 기초한 브레이크아웃 축적 전략
- 이동 평균 크로스오버 시스템
- 다음 오픈 이윤 취득 전략
- 이동 중지 손실 추적 전략
- 가른 미 분석 지표에 기초한 단기 트렌드 추적 전략
- 가우스 이동 평균 거래 전략
- 적응적인 카우프만 이동 평균 트렌드 전략
- 대역 패스 필터링 트렌드 추출 전략
- 이중 반전 높은-저기 전략
- 하이핑 이동 평균 트렌드 전략
- 멀티 타임프레임 이동 평균 및 MACD를 기반으로 한 긴 및 짧은 오픈 전략