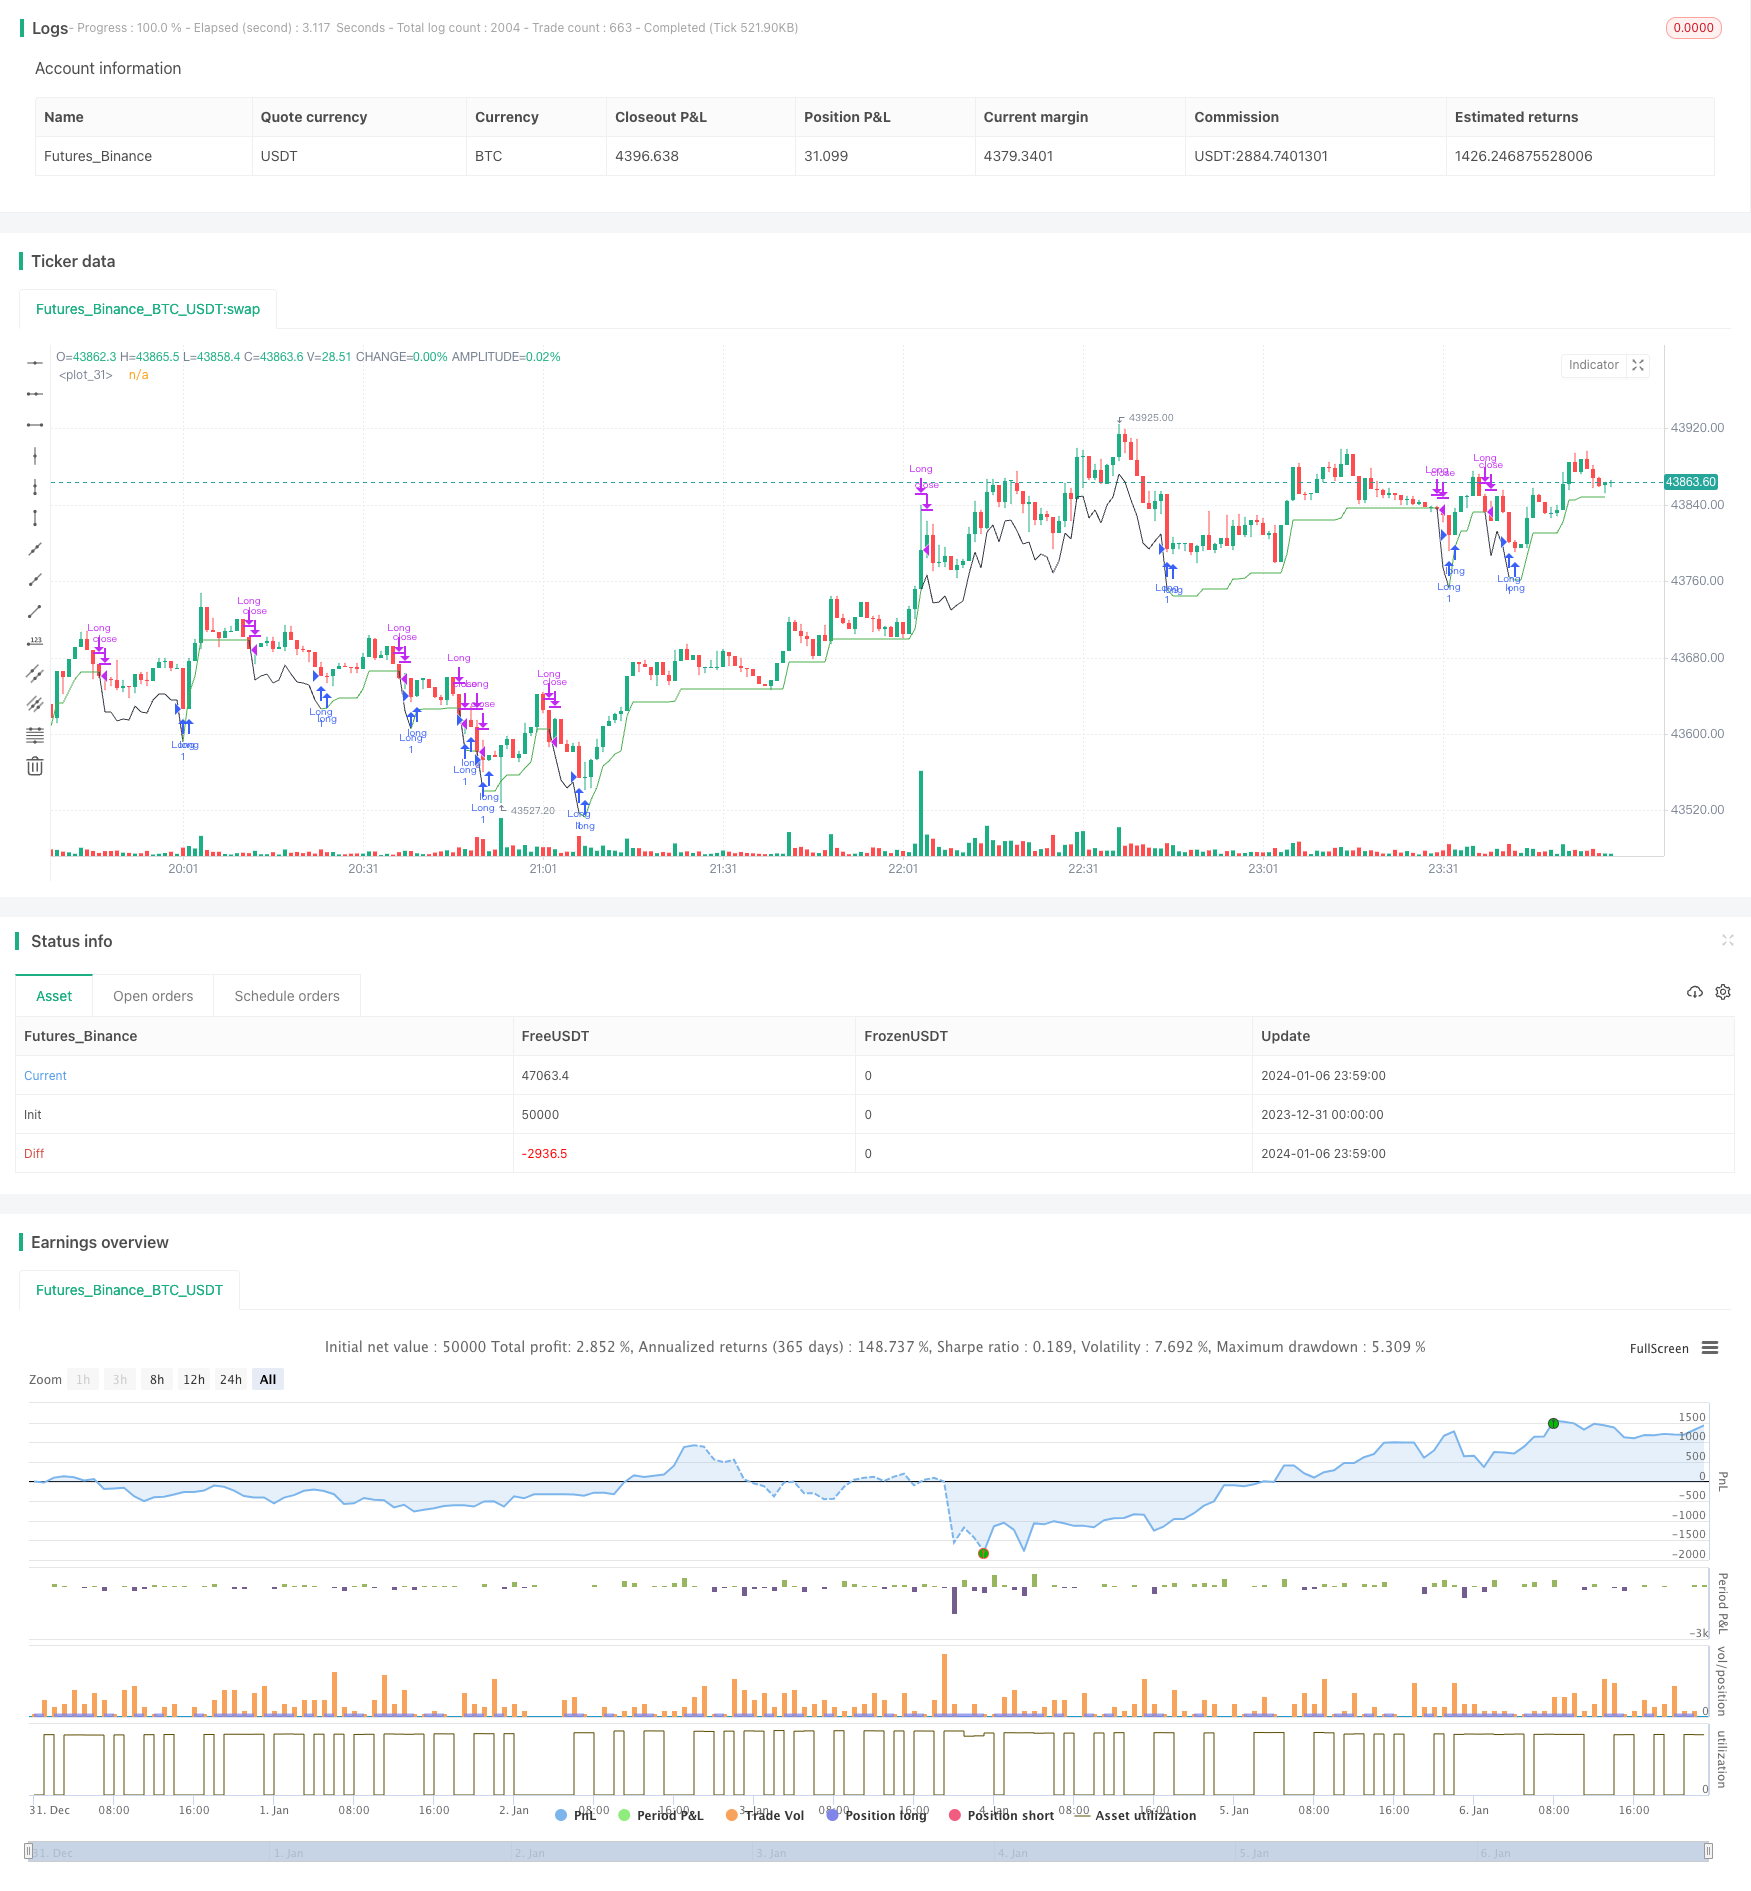
개요
이 전략의 이름은 ?? RSI 지표 기반의 쌍로 돌파 전략 ?? 이다. 이 전략은 RSI 지표의 쌍로 조합을 이용하여 판단하고, 저가입 고가매를 달성하기 위한 목적이다. RSI 지표가 설정된 낮은 궤도 (기본 40) 보다 낮으면 구매 신호로 간주하고, 이 때 RSI10이 RSI14보다 낮으면 구매를 추가로 확인한다.
전략 원칙
이 전략의 핵심 논리는 RSI 지표의 이중 궤도를 사용하여 판단하는 것입니다. RSI 지표는 일반적으로 14 주기로 설정되어 있으며, 14 일 가까이의 주식의 강점을 나타냅니다. 이 전략은 RSI10을 보조 판단 지표로 추가합니다.
RSI14가 40 궤도를 넘었을 때, 주가가 약점으로 떨어질 때, 지지부진의 기회가 발생할 수 있다고 생각합니다. 이 시점에 RSI10이 RSI14보다 작다면, 단기 추세가 여전히 하향으로, 하향 신호를 추가로 확인 할 수 있습니다. 따라서 RSI14 <= 40과 RSI10 < RSI14을 충족하면 구매 신호가 발생합니다.
RSI14이 70 궤도를 넘었을 때, 주가가 단기 강점 영역에 들어갔다고 생각하면, 역조정이 일어날 가능성이 있다. 이 시점에서는 RSI10이 RSI14보다 크면, 단기 추세가 계속 상승하는 것을 의미하며, 부자 신호를 추가로 확인할 수 있다. 따라서 RSI14 >= 70과 RSI10 > RSI14이 충족되면 판매 신호가 발생한다.
따라서, RSI14와 RSI10의 조합 판단은 이중 경로 전략의 핵심 논리를 구성한다.
전략적 이점
- 이중 RSI 지표 포트폴리오를 사용하여 구매/판매 지점을 더 정확하게 파악할 수 있습니다.
- 이동식 중지 메커니즘을 사용하여 최대 손실을 제어할 수 있습니다.
- 목표 수익을 달성한 후에 탈퇴할 수 있는 차단 탈퇴 메커니즘을 설정하여 수익 회귀를 방지한다
전략적 위험
- RSI 지표는 잘못된 신호를 유발할 수 있으며 손실을 완전히 피할 수 없습니다.
- 스톱포인트가 너무 가까이 설정되면 초과될 수 있고, 너무 크고 통제하기 어려운 위험을 설정할 수 있습니다.
- 급격한 점프와 같은 비정상적인 행동으로 인한 피해가 발생할 수 있습니다.
이 전략을 최대한 활용하려면 RSI 파라미터를 적절하게 조정하고, 스톱 포지션을 엄격하게 제어하고, 너무 많은 작업을 피하고, 안정적이고 지속적인 수익성을 추구 할 수 있습니다.
전략 최적화 방향
- KDJ, MACD 등과 함께 조합하여 다중 지표 검증을 고려할 수 있습니다.
- 다양한 품종에 대해 RSI 파라미터를 설정하여 그 품종 특성에 더 가깝게 설정할 수 있습니다.
- 동적 스톱을 설정하고 ATR과 같은 지표에 따라 실시간으로 스톱을 조정할 수 있습니다.
- 기계 학습 기술을 통해 RSI 매개 변수를 자동으로 최적화 할 수 있습니다.
요약하다
이 전략은 RSI의 이중 궤도 사고를 바탕으로 판단하고, 어느 정도까지는 일부 잡음 신호를 필터링한다. 그러나 어떤 단일 지표 전략도 완벽할 수 없으며, RSI 지표는 오해의 소지가 있어 주의해야 한다. 이 전략에는 위험을 제어하기 위해 이동 상쇄 및 중지 메커니즘이 포함되어 있습니다.
/*backtest
start: 2023-12-31 00:00:00
end: 2024-01-07 00:00:00
period: 1m
basePeriod: 1m
exchanges: [{"eid":"Futures_Binance","currency":"BTC_USDT"}]
*/

// This source code is subject to the terms of the Mozilla Public License 2.0 at https://mozilla.org/MPL/2.0/
// © DojiEmoji

//@version=4
strategy("[KL] RSI 14 + 10 Strategy",overlay=true)

backtest_timeframe_start = input(defval = timestamp("01 Jan 2015 13:30 +0000"), title = "Backtest Start Time", type = input.time)
//backtest_timeframe_end = input(defval = timestamp("19 Mar 2021 19:30 +0000"), title = "Backtest End Time", type = input.time)
TARGET_PROFIT_MODE = input(false,title="Exit when Risk:Reward met")
REWARD_RATIO = input(3,title="Risk:[Reward] (i.e. 3) for exit")
// Trailing stop loss {
TSL_ON = input(true,title="Use trailing stop loss")
var entry_price = float(0)
ATR_multi_len = 26
ATR_multi = input(2, "ATR multiplier for stop loss")
ATR_buffer = atr(ATR_multi_len) * ATR_multi
plotchar(ATR_buffer, "ATR Buffer", "", location = location.top)
risk_reward_buffer = (atr(ATR_multi_len) * ATR_multi) * REWARD_RATIO
take_profit_long = low > entry_price + risk_reward_buffer
take_profit_short = low < entry_price - risk_reward_buffer
var bar_count = 0 //number of bars since entry
var trailing_SL_buffer = float(0)
var stop_loss_price = float(0)
stop_loss_price := max(stop_loss_price, close - trailing_SL_buffer)
// plot TSL line
trail_profit_line_color = color.green
showLine = strategy.position_size == 0
if showLine
    trail_profit_line_color := color.black
    stop_loss_price := close - trailing_SL_buffer
plot(stop_loss_price,color=trail_profit_line_color)
// }
// RSI
RSI_LOW = input(40,title="RSI entry")
RSI_HIGH = input(70,title="RSI exit")
rsi14 = rsi(close, 14)
rsi10 = rsi(close, 10)

if true// and time <= backtest_timeframe_end
    buy_condition = rsi14 <= RSI_LOW and rsi10 < rsi14
    exit_condition = rsi14 >= RSI_HIGH and rsi10 > rsi14
    //ENTRY:
    if strategy.position_size == 0 and buy_condition
        entry_price := close
        trailing_SL_buffer := ATR_buffer
        stop_loss_price := close - ATR_buffer
        strategy.entry("Long",strategy.long, comment="buy")
        bar_count := 0
    else if strategy.position_size > 0
        bar_count := bar_count + 1

    //EXIT:
    // Case (A) hits trailing stop
    if TSL_ON and strategy.position_size > 0 and close <= stop_loss_price
        if close > entry_price
            strategy.close("Long", comment="take profit [trailing]")
            stop_loss_price := 0
        else if close <= entry_price and bar_count
            strategy.close("Long", comment="stop loss")
            stop_loss_price := 0
        bar_count := 0
    // Case (B) take targeted profit relative to risk
    if strategy.position_size > 0 and TARGET_PROFIT_MODE
        if take_profit_long
            strategy.close("Long", comment="take profits [risk:reward]")
            stop_loss_price := 0
        bar_count := 0
    // Case (C)
    if strategy.position_size > 0 and exit_condition
        if take_profit_long
            strategy.close("Long", comment="exit[rsi]")
            stop_loss_price := 0
        bar_count := 0