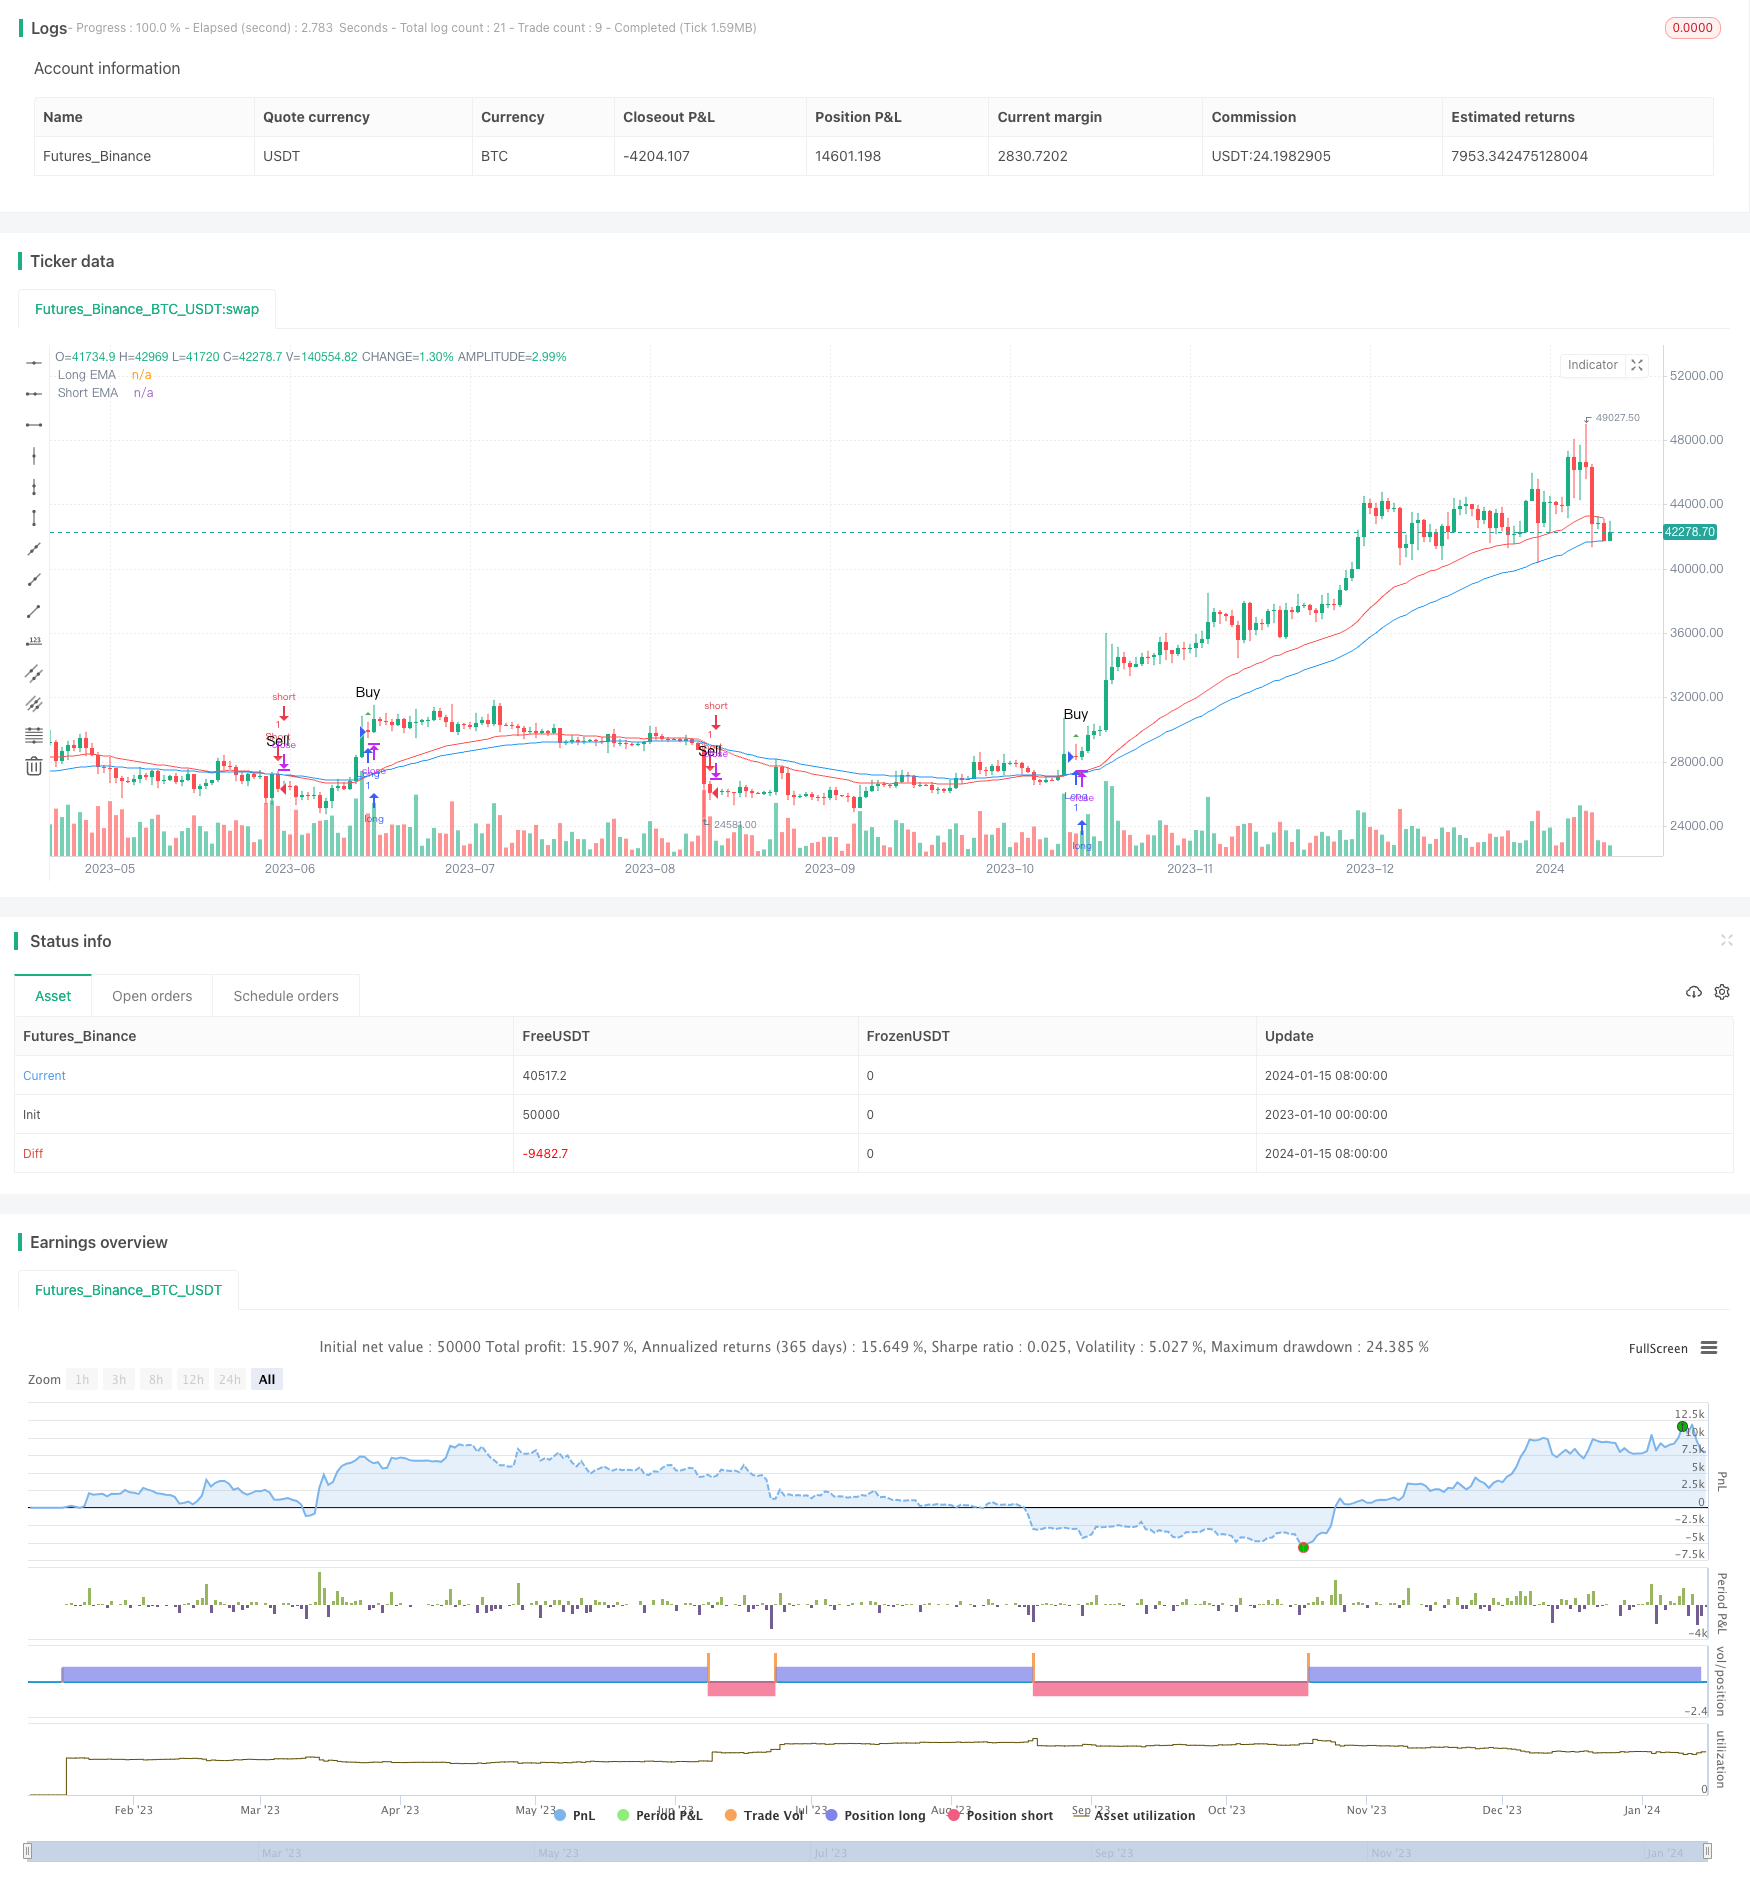
개요
이 전략은 평행선 교차에 기반한 동적 거래 전략이다. 이 전략은 두 개의 다른 주기의 지수 이동 평균 ((EMA) 을 사용하여 매매 신호를 식별한다. 빠른 EMA 라인이 아래에서 느린 EMA 라인을 통과하면 매매 신호를 생성한다. 빠른 EMA 라인이 위에서 아래에서 느린 EMA 라인을 통과하면 매매 신호를 생성한다.
원칙
이 전략의 핵심 논리는 평균선 교차 시스템을 기반으로 한다. EMA는 기하급수적인 이동 평균을 의미한다. EMA의 계산 공식은 다음과 같다: $\(EMA_t=\frac{P_t \times k}{1+k}+\frac{EMA_{t-1}\times(1-k)}{1+k}\)\( 그 중, \)Pt\(는 당일 종점 가격을 나타내고, \)EMA{t-1}\(는 전날의 EMA 값을 나타내고, \)k=\frac{2}{n+1}$는 EMA의 시간주기를 나타낸다.
이 전략의 빠른 EMA 주기가 55이고, 느린 EMA 주기가 34이다. 짧은 기간의 EMA가 아래에서 긴 기간의 EMA를 통과하면, 단기 평균선이 긴 기간의 평균선을 위로 이끌기 시작한다는 것을 나타냅니다. 금색 포크 신호에 속하며, 구매 기회를 만듭니다. 반대로, 짧은 기간의 EMA가 위에서 아래로 긴 기간의 EMA를 통과하면, 단기 평균선이 긴 기간의 평균선 아래로 뒤쳐지기 시작한다는 것을 나타냅니다.
장점
이 전략은 다음과 같은 장점을 가지고 있습니다.
- 원칙은 간단하고, 이해하기 쉽고, 실행하기 쉽습니다.
- 거래 신호가 명확하고, 지표 조합이 잘 작동합니다.
- 다양한 시장 환경에서 고주파 및 저주파 거래에 대해 유연하게 사용할 수 있습니다.
- 가짜 신호를 방지하기 위해 EMA 변수를 조정하여 최적화 할 수 있습니다.
위험과 해결책
이 전략에는 다음과 같은 위험도 있습니다.
- 더 많은 가짜 신호를 생성할 수 있다. 해결책은 EMA 변수를 조정하여 보다 안정적인 변수 조합을 사용하는 것이다.
- 위기 상황에서는 쉽게 잡힐 수 있다. 해결책은 트렌드 지표와 함께 필터링하는 것이다.
- 시장의 실제 움직임을 판단할 수 없는 경우 거래 위험이 있습니다. 해결책은 기본 분석과 수량 가격 지표와 함께 사용하는 것입니다.
최적화 방향
이 전략은 다음과 같은 부분에서 최적화될 수 있습니다.
- EMA 사이클 최적화. 더 많은 파라미터 조합을 테스트하여 더 적합한 빠른 느린 EMA 사이클을 찾을 수 있다.
- 손해 제도를 늘립니다. 이동 손해 제도를 설정할 수 있고, 단위 손해를 제어할 수 있습니다.
- 결합량 지표. 교역량, 브린띠 등 지표에 필터링을 추가하여 가짜 신호를 줄일 수 있다.
- 다중 시간 프레임 검증. 신호를 더 높은 수준의 시간 프레임에서 검증하여, 함정을 피한다.
요약하다
이 전략은 전체적으로 매우 고전적이고 실용적인 단선 거래 전략이다. 그것은 간단한 명확한 거래 신호와 유연한 응용 공간을 가지고 있다. 매개 변수 최적화, 지표 필터링, 위험 제어와 같은 수단을 통해 이 전략의 효과를 지속적으로 향상시킬 수 있으며, 이는 일일 고주파 거래의 중요한 도구 중 하나로 만들 수 있다.
/*backtest
start: 2023-01-10 00:00:00
end: 2024-01-16 00:00:00
period: 1d
basePeriod: 1h
exchanges: [{"eid":"Futures_Binance","currency":"BTC_USDT"}]
*/

//@version=5
strategy("mohammad tork strategy", overlay=true)

// Input parameters
lengthShortEMA = input(55, title="Short EMA Length")
lengthLongEMA = input(34, title="Long EMA Length")

// Calculate EMAs
emaShort = ta.ema(close, lengthShortEMA)
emaLong = ta.ema(close, lengthLongEMA)

// Conditions for Long Signal
longCondition = ta.crossover(emaLong, emaShort)

// Conditions for Short Signal
shortCondition = ta.crossunder(emaLong, emaShort)

// Execute Long Signal
strategy.entry("Long", strategy.long, when = longCondition)

// Execute Short Signal
strategy.entry("Short", strategy.short, when = shortCondition)

// Plot EMAs on the chart
plot(emaShort, color=color.blue, title="Short EMA")
plot(emaLong, color=color.red, title="Long EMA")

// Plot Long Signal Icon with Buy Label
plotshape(series=longCondition, title="Long Signal", color=color.green, style=shape.triangleup, location=location.abovebar, size=size.small, text="Buy")

// Plot Short Signal Icon with Sell Label
plotshape(series=shortCondition, title="Short Signal", color=color.red, style=shape.triangledown, location=location.abovebar, size=size.small, text="Sell")