개요
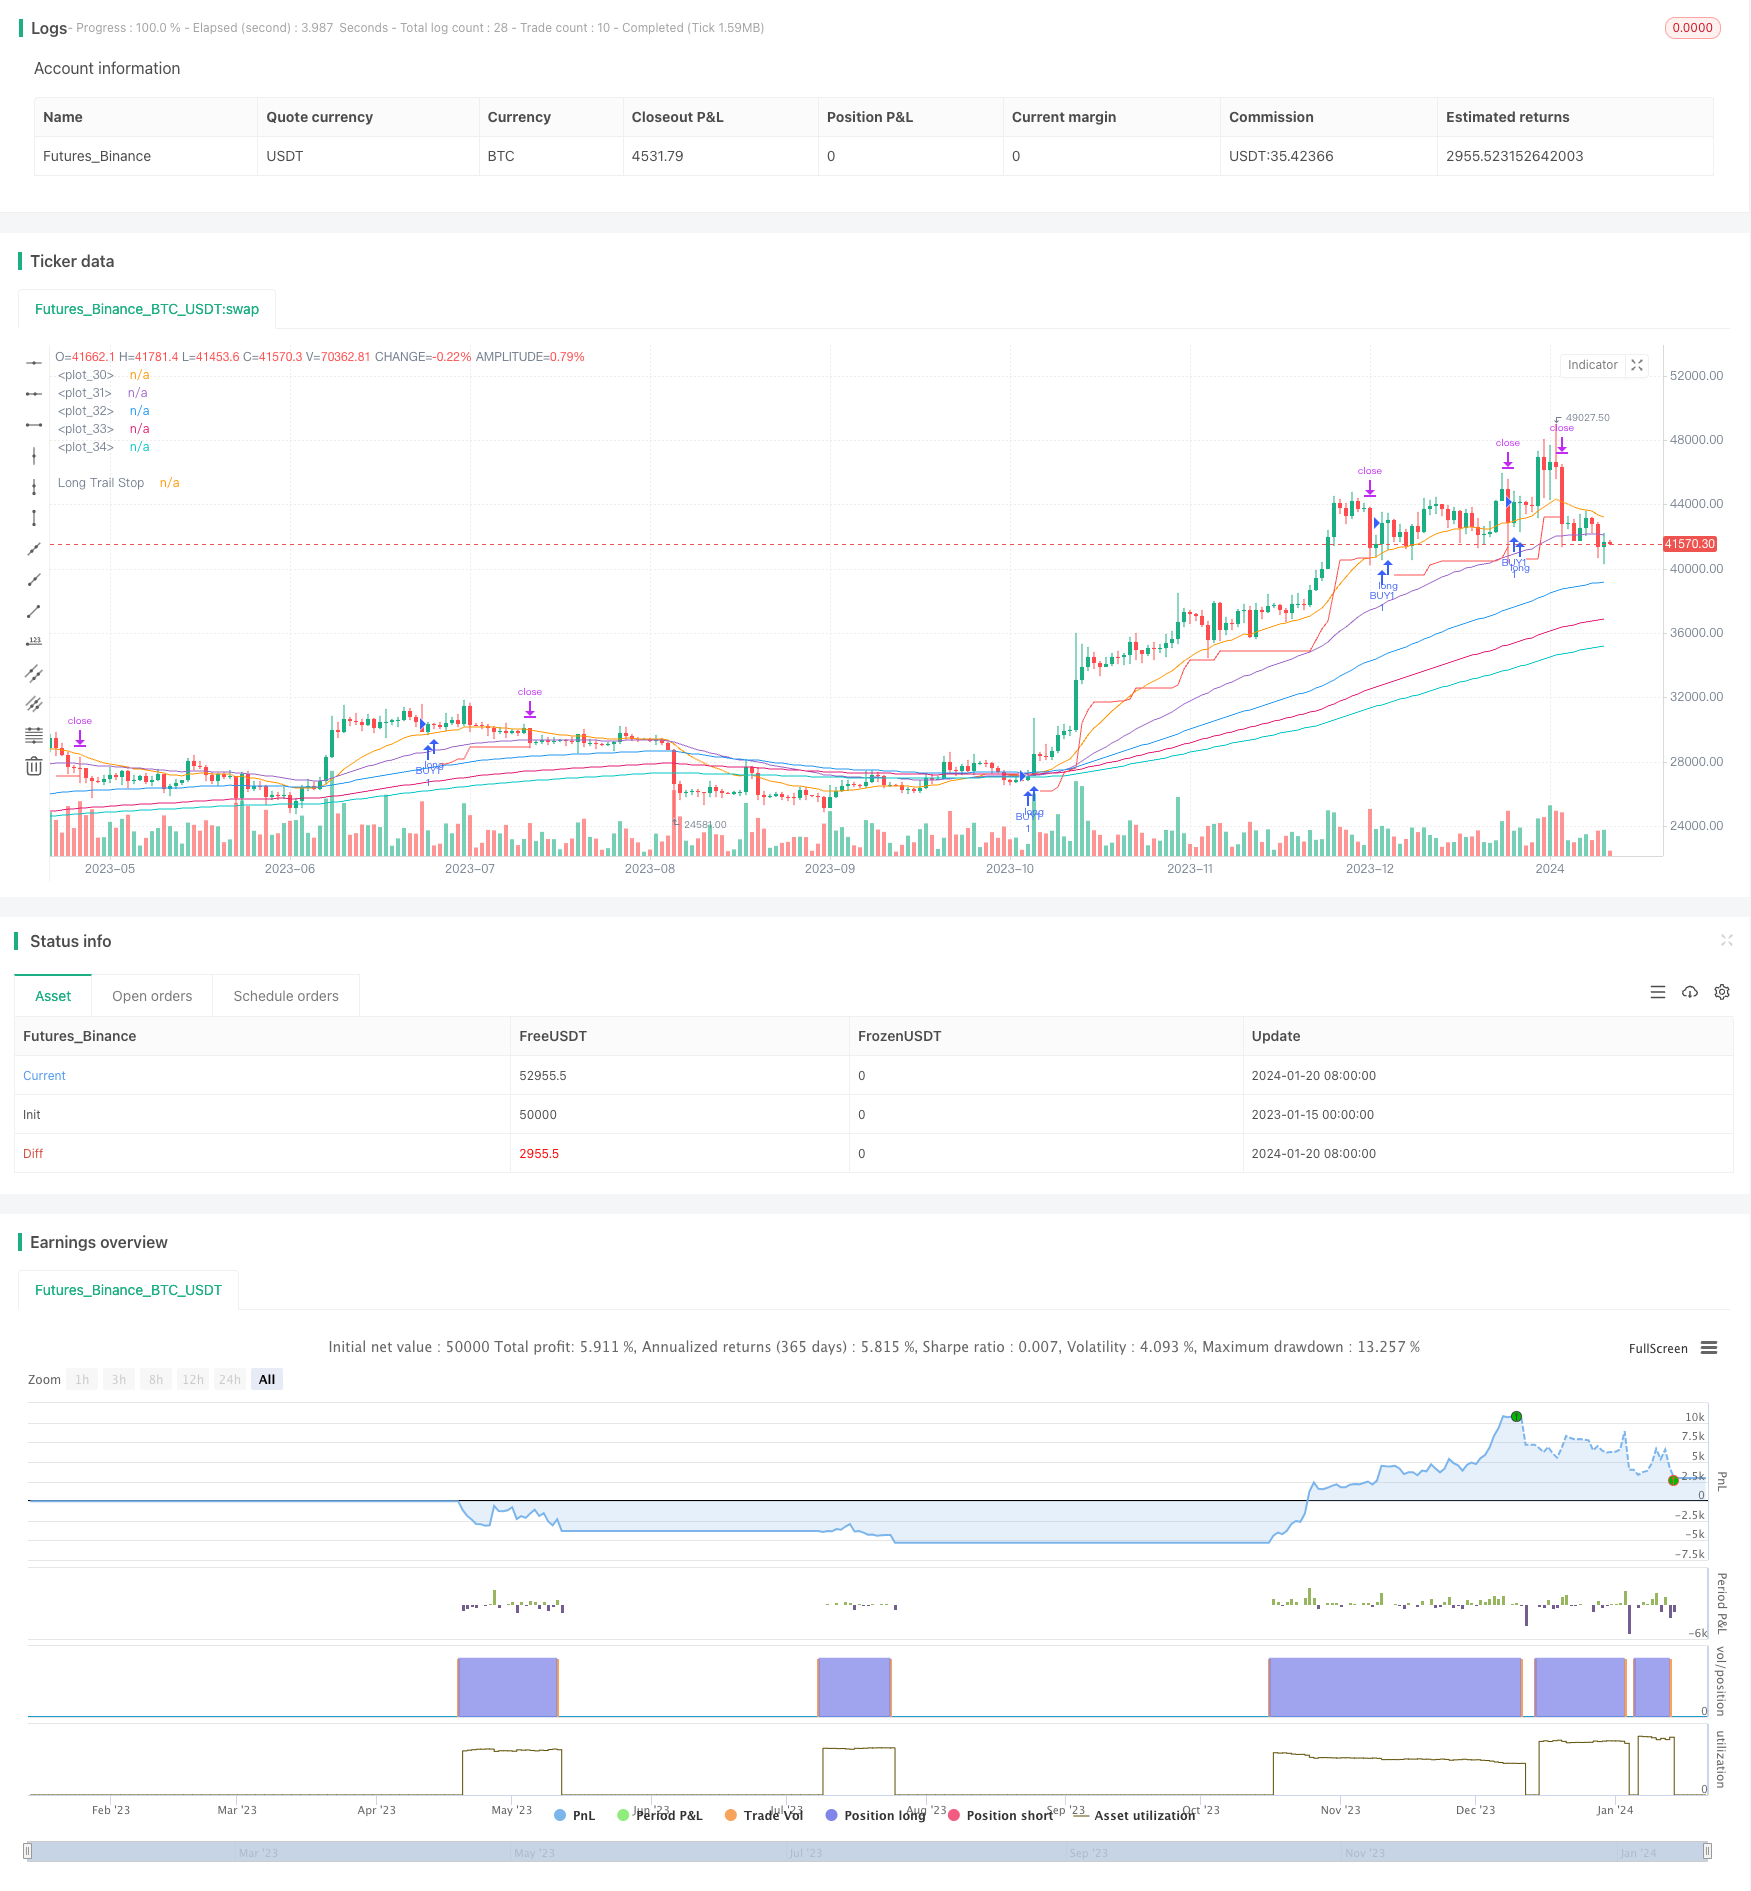
다중 평균선 다중 머리 트렌드 전략은 여러 개의 다른 주기의 지수 이동 평균 (EMA) 을 기반으로 판단을 구축하는 트렌드 추적 전략이다. 그것은 가격이 10 일 EMA를 돌파하고 다른 더 긴 주기의 EMA 라인이 다중 머리 배열을 나타낼 때 더 많이 한다. 그리고 8%의 추적 손실을 사용하여 이익을 잠금한다.
전략 원칙
이 전략은 10일, 20일, 50일, 100일, 150일, 200일 6개의 다른 주기적인 EMA선을 사용한다. 이 EMA선은 시장이 현재 어떤 주기적 단계에 있는지 판단하는데 사용된다. 단기 EMA선 (예: 10일선) 이 더 긴 주기적인 EMA선 (예: 20일, 50일선) 을 가로질러 시장이 다단계 트렌드에 들어가는 마커프 단계로 간주된다.
특히, 전략은 다음과 같은 조건이 충족될 때 더 많은 지분을 벌 수 있습니다:
- 10일 EMA선은 20일 EMA선보다 높습니다.
- 20일 EMA가 50일 EMA보다 높습니다.
- 100일 EMA 라인은 150일 EMA 라인보다 높습니다.
- 150일 EMA 라인은 200일 EMA 라인보다 높습니다.
- 10일 EMA 경계를 통과
오버 포지션을 개시한 후, 전략은 8%의 후속 손실을 사용하여 수익을 잠금합니다. 즉, 주식 가격이 구매 가격의 8% 이상으로 돌아가지 않는 한, 그 포지션을 계속 유지합니다. 8% 이상의 회수 발생하면 손실이 중단됩니다.
전체적으로, 이 전략의 핵심 아이디어는: EMA의 여러 필터링 조건을 사용하여 다중 트렌드에 진입한 후, 손실을 추적하여 이익을 잠금하는 것이다.
우위 분석
이 다중 평균선 다중 방향 전략은 다음과 같은 몇 가지 주요 장점을 가지고 있다:
- 가짜 브레이크를 효과적으로 필터링하여 가격 순환의 마크업 단계를 확보하고 불필요한 거래를 줄일 수 있습니다.
- EMA 라인의 여러 가지 필터링은 정지 손실이 깨질 가능성을 줄여주고, 더 안전한 지분을 보유할 수 있다.
- 8%의 후속 손실은 neither too tight nor too loose이며, 수익을 잘 고정시킬 수 있고, 너무 자주 발생하는 손실을 피할 수 있다.
- 이 전략은 파라미터를 조정하는 데 유연하며, 다양한 품종에 따라 최적의 파라미터 조합을 찾을 수 있다.
위험 분석
이 전략에는 몇 가지 위험도 있습니다.
- EMA의 순서로는 100%의 추세를 알 수 없습니다.
- 8%의 후속 손실은 큰 시장에서 수익의 일부를 잃을 수 있습니다.
- EMA 평행선 시스템 자체는 가격 변화에 뒤쳐져 있으며, 전환점 판단에 따라 다소 뒤쳐질 수 있다.
위와 같은 위험에 대해 우리는 EMA 주기 변수를 적절하게 조정하거나 보조 판단으로 다른 지표를 도입하여 최적화 및 개선을 할 수 있습니다.
최적화 방향
이 전략의 특징을 고려하면, 향후에는 다음과 같은 부분에서 최적화할 수 있을 것이다.
- 다양한 EMA 조합과 주기 파라미터를 테스트하여 최적의 파라미터를 찾습니다.
- 트렌드 강도를 판단하기 위해 변동성 지수와 같은 지표를 추가하여 불필요한 포지션을 피하십시오.
- MACD, KDJ와 같은 필터링 지표들을 추가하여 다목적 배열을 판단한다.
- 기계 학습 알고리즘을 도입하여 동적 상실을 구현한다.
요약하다
다중 평균선 다중 헤드 트렌드 전략은 전체적으로 좀 더 안정적이고 신뢰할 수 있는 트렌드 추적 전략이다. 그것은 동시에 트렌드 판단과 위험 통제를 겸비한다. 변수 조정과 알고리즘 최적화를 통해 많은 개선의 여지가 있다. 전체적으로 이것은 시도하고 연구할 가치가 있는 효과적인 전략이다.
/*backtest
start: 2023-01-15 00:00:00
end: 2024-01-21 00:00:00
period: 1d
basePeriod: 1h
exchanges: [{"eid":"Futures_Binance","currency":"BTC_USDT"}]
*/

//@version=5
strategy('SirSeff\'s EMA Rainbow', overlay=true)
// Testing Start dates
testStartYear = input(2000, 'Backtest Start Year')
testStartMonth = input(1, 'Backtest Start Month')
testStartDay = input(1, 'Backtest Start Day')
testPeriodStart = timestamp(testStartYear, testStartMonth, testStartDay, 0, 0)
//Stop date if you want to use a specific range of dates
testStopYear = input(2100, 'Backtest Stop Year')
testStopMonth = input(12, 'Backtest Stop Month')
testStopDay = input(30, 'Backtest Stop Day')
testPeriodStop = timestamp(testStopYear, testStopMonth, testStopDay, 0, 0)

testPeriod() =>
    time >= testPeriodStart and time <= testPeriodStop ? true : false
// Component Code Stop

//TSP
trailStop = input.float(title='Long Trailing Stop (%)', minval=0.0, step=0.1, defval=8) * 0.01

longStopPrice = 0.0
longStopPrice := if strategy.position_size > 0
    stopValue = close * (1 - trailStop)
    math.max(stopValue, longStopPrice[1])
else
    0

//PLOTS
plot(series=strategy.position_size > 0 ? longStopPrice : na, color=color.new(color.red, 0), style=plot.style_linebr, linewidth=1, title='Long Trail Stop', offset=1, title='Long Trail Stop')
plot(ta.ema(close, 20))
plot(ta.ema(close, 50))
plot(ta.ema(close, 100))
plot(ta.ema(close, 150))
plot(ta.ema(close, 200))

//OPEN
longCondition =  ta.ema(close, 10) > ta.ema(close, 20) and ta.ema(close, 20) > ta.ema(close, 50) and ta.ema(close, 100) > ta.ema(close, 150) and ta.ema(close, 150) > ta.ema(close, 200)
if longCondition and ta.crossover(close,ta.ema(close,10)) and testPeriod()
    strategy.entry("BUY1", strategy.long)

if longCondition and ta.crossover(ta.ema(close,10),ta.ema(close,20)) and testPeriod()
    strategy.entry("BUY2'", strategy.long)

//CLOSE @ TSL
if strategy.position_size > 0 and testPeriod()
    strategy.exit(id='TSP', stop=longStopPrice)