개요
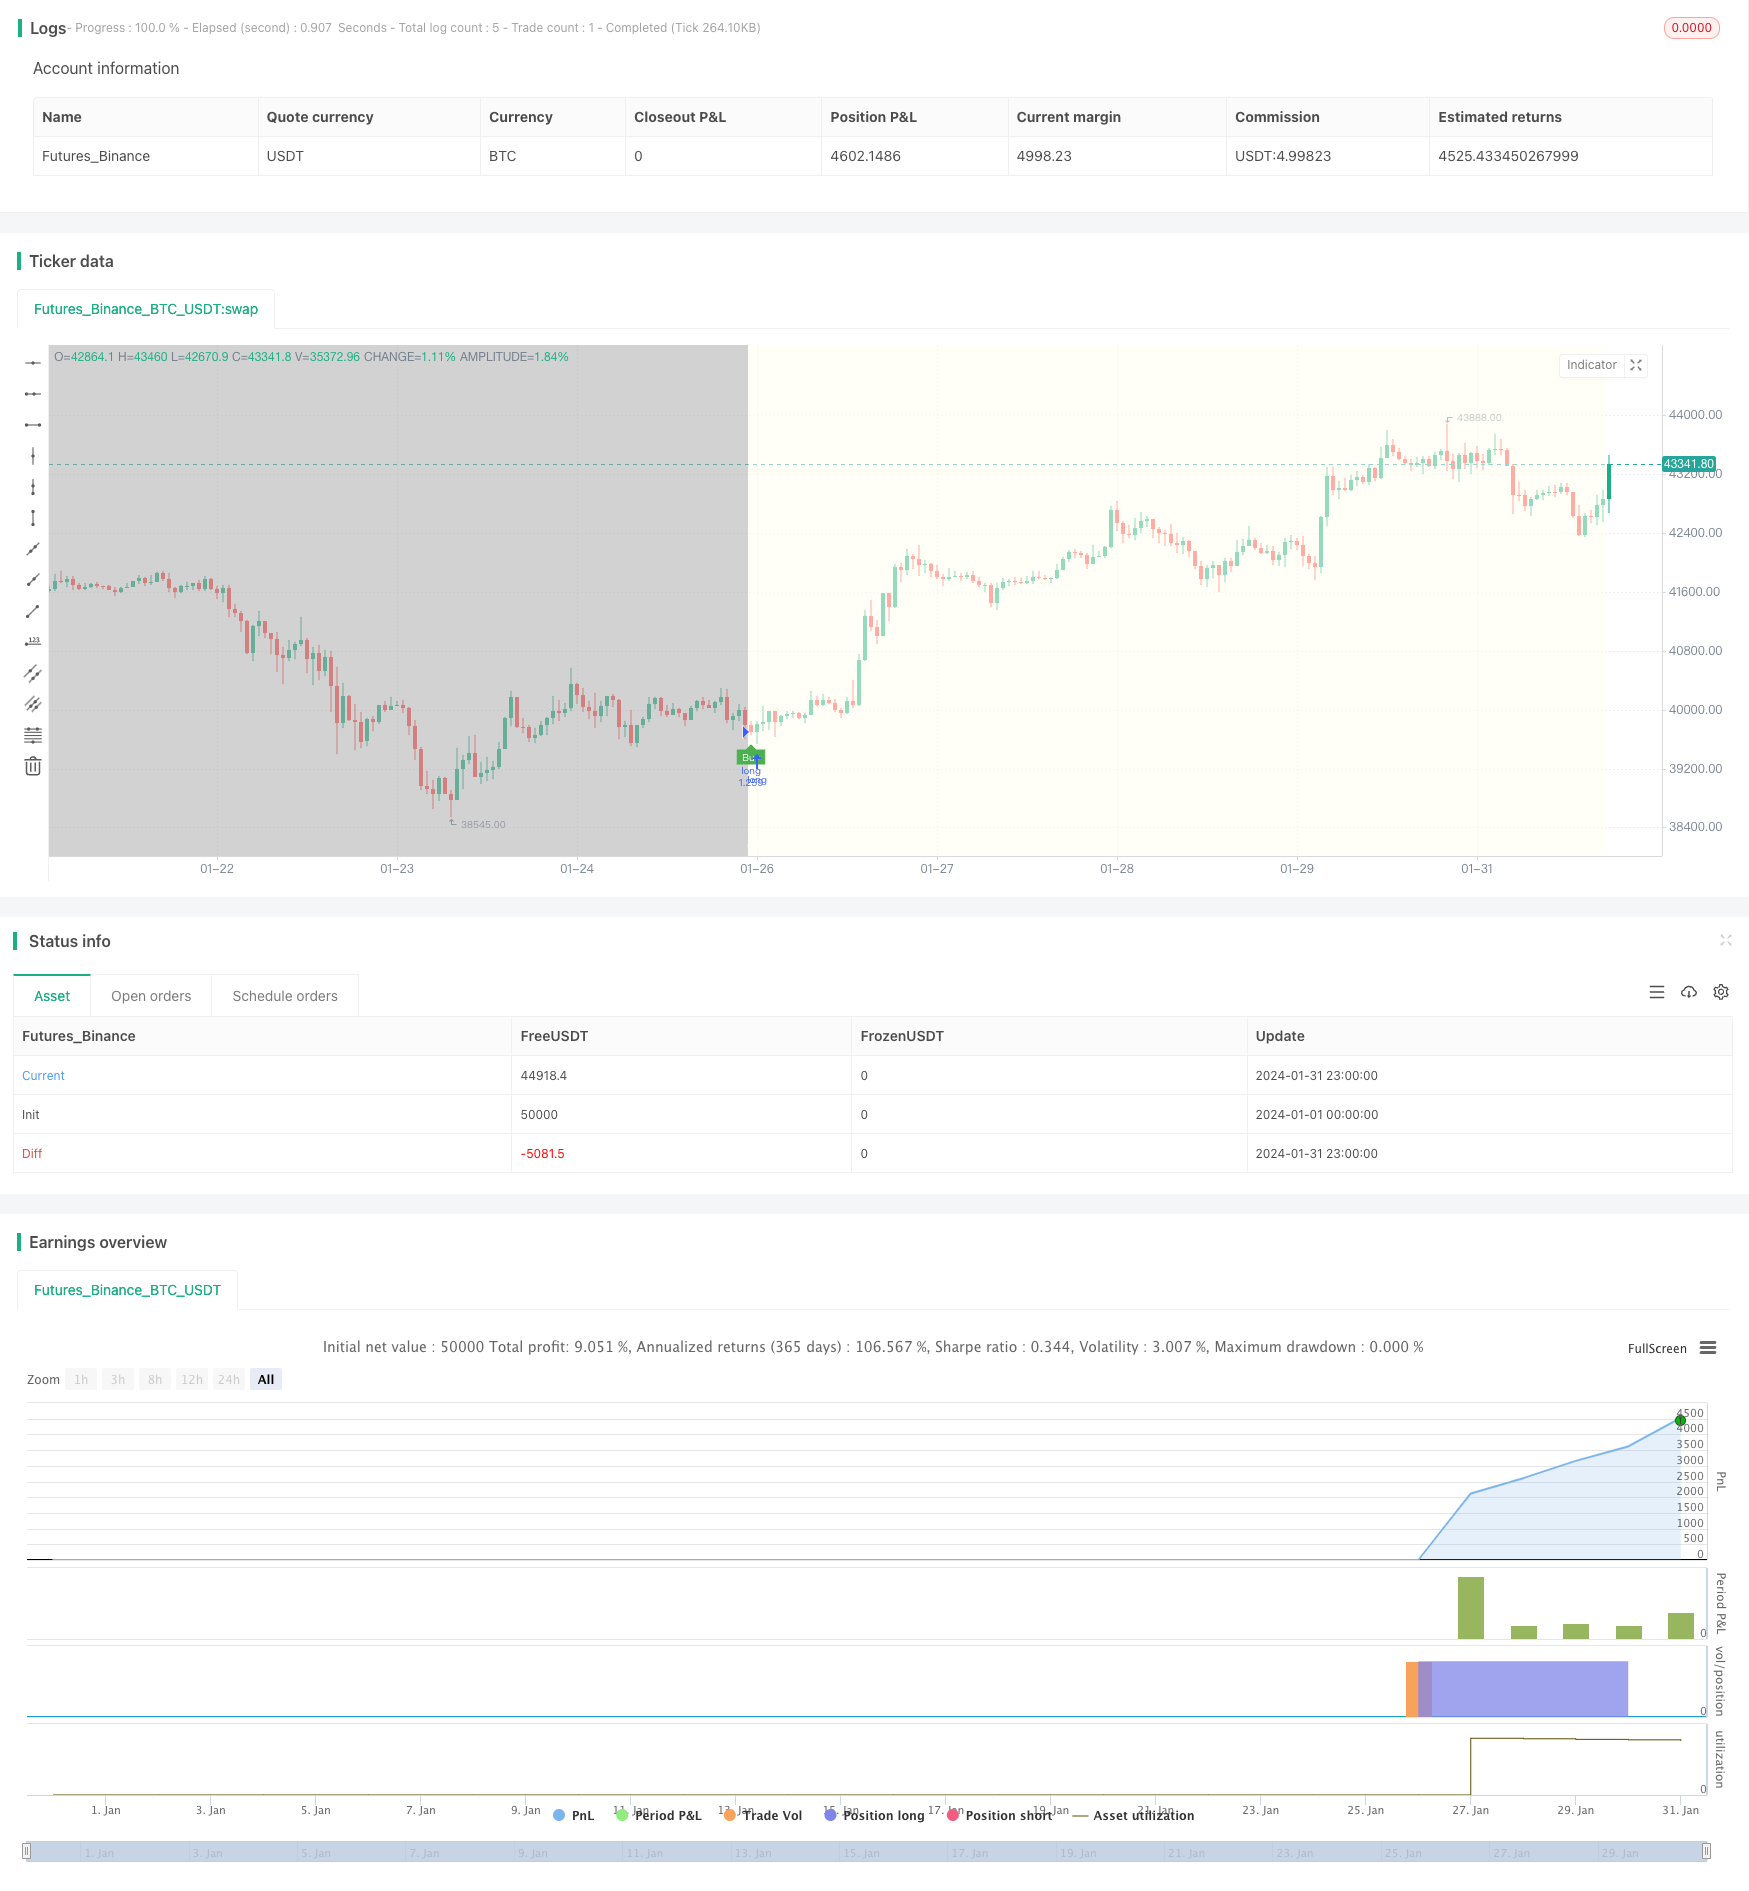
이 전략은 달의 위상 변화에 기초하여, 신월에는 더 많이 하고, 정월에는 더 적게 하고, 양방향 거래를 가능하게 한다.
전략 원칙
이 전략은 사용자 정의 함수를 사용하여 달의 단계를 계산하여 날짜에 따라 달의 단계를 정확하게 계산할 수 있습니다. 15 세 미만일 경우 신월이며, 15 세 이상 30 세 미만일 경우 정월입니다. 전략은 달의 단계를 판단하여 더 많은 하위 신호를 내리고, 신월 때 더 많은 상장을 열고, 정월 때 상장을 열고, 평상시에는 정반대로, 정월 때 더 많은 상장을 열고, 신월 때 공백 상장을 습니다.
사용자는 새 달에 더 많은 것을 할 수 있고, 새 달에 빈 것을 할 수 있거나, 새 달에 빈 것을 할 수 있으며, 새 달에 더 많은 것을 할 수 있습니다. 두 가지 전략이 있습니다. 전략은 현재 포지션을 보유하고 있는지 여부를 추적하는 펄 변수를 사용합니다. 신호가 나타나기 전에 포지션이 없을 때 새로운 포지션을 열고, 신호가 반전되면 현재 포지션을 평행합니다. 전략은 시각적으로 구매 판매 표시를 표시합니다.
우위 분석
- 달의 순환성을 이용해서 긴 선의 트렌드를 잡습니다.
- 사용자 정의 색상, 채우기 및 기타 정책 표시
- 선택 가능한 양방향 거래 전략
- 평점 표시를 표시하고, 동작이 명확하다.
- 맞춤형 응답 시작 시간, 최적화 전략
위험 분석
- 달의 길이가 길어서 단선 트렌드를 잡을 수 없습니다.
- 손실을 제한할 수 없고, 큰 손실을 초래할 수 있다.
- 고정된 주기, 패턴이 쉽게 형성
위험 해결 방법:
- 다른 지표와 결합하여 다단계 거래
- 손해 방지 장치
- 포지션 관리를 최적화하여 단편 손실의 영향을 줄이십시오.
최적화 방향
이 정책은 다음과 같은 측면에서 최적화될 수 있습니다.
- 더 많은 주기적 지표와 결합하여 거래 신호 필터를 형성하여 전략의 안정성을 향상시킵니다.
- 포지션 관리 모듈을 추가하여 포지션 크기를 최적화하고 단독 손실의 영향을 줄입니다.
- 손실을 막기 위한 모듈을 추가합니다.
- 포지션 개시 및 포지션 조건을 최적화하고, 손실을 줄이고, 승률을 높여라
요약하다
이 전략은 달의 단계의 주기적 법칙을 활용하여 새 달과 달이 가득한 것을 기반으로 한 양방향 거래 전략을 구현한다. 전략은 명확하고, 사용자 정의가 강하며, 긴 라인 트렌드를 포착하는 데 적합하다. 그러나 손실을 제한할 수 없기 때문에 위험성이 높기 때문에 다른 단기 주기 지표와 결합하여 사용하는 것이 좋습니다.
전략 소스 코드
/*backtest
start: 2024-01-01 00:00:00
end: 2024-01-31 23:59:59
period: 1h
basePeriod: 15m
exchanges: [{"eid":"Futures_Binance","currency":"BTC_USDT"}]
*/

// This source code is subject to the terms of the Mozilla Public License 2.0 at https://mozilla.org/MPL/2.0/

// ---------------------------© paaax----------------------------
// ---------------- Author1: Pascal Simon (paaax) ----------------
// -------------------- www.pascal-simon.de ---------------------
// ---------------- www.tradingview.com/u/paaax/-----------------
// Source: https://gist.github.com/L-A/3497902#file-moonobject-js

// -------------------------© astropark--------------------------
// --------------- Author2: Astropark (astropark) ---------------
// -------------- https://bit.ly/astroparktrading ---------------
// -------------- www.tradingview.com/u/astropark/---------------


// @version=4
strategy(title="[astropark] Moon Phases [strategy]", overlay=true, pyramiding = 10, default_qty_type = strategy.percent_of_equity, default_qty_value = 100, initial_capital = 100000, currency = currency.USD, commission_value = 0.1)

// INPUT    --- {

newMoonColor = input(color.black, "New Moon Color")
fullMoonColor = input(color.white, "Full Moon Color")

fillBackground = input(true, "Fill Background?")
newMoonBackgroundColor = input(#fffff0aa, "New Moon Background Color")
fullMoonBackgroundColor = input(#aaaaaaaa, "Full Moon Background Color")

//} --- INPUT

// FUNCTION --- {

normalize(_v) =>
    x = _v
    x := x - floor(x)
    if x < 0
        x := x + 1
    x

calcPhase(_year, _month, _day) =>

    int y = na
    int m = na
    float k1 = na
    float k2 = na
    float k3 = na
    float jd = na
    float ip = na

    y := _year - floor((12 - _month) / 10)
    m := _month + 9
    if m >= 12
        m := m - 12

    k1 := floor(365.25 * (y + 4712))
    k2 := floor(30.6 * m + 0.5)
    k3 := floor(floor((y / 100) + 49) * 0.75) - 38

    jd := k1 + k2 + _day + 59
    if jd > 2299160
        jd := jd - k3

    ip := normalize((jd - 2451550.1) / 29.530588853)
    age = ip * 29.53

//} --- FUNCTION

// INIT     --- {

age = calcPhase(year, month, dayofmonth)
moon =
     floor(age)[1] > floor(age) ? 1 :
     floor(age)[1] < 15 and floor(age) >= 15 ? -1 : na

//} --- INIT

// PLOT     --- {

plotshape(
     moon==1,
     "Full Moon",
     shape.circle,
     location.top,
     color.new(newMoonColor, 20),
     size=size.normal
     )

plotshape(
     moon==-1,
     "New Moon",
     shape.circle,
     location.bottom,
     color.new(fullMoonColor, 20),
     size=size.normal
     )

var color col = na
if moon == 1 and fillBackground
    col := fullMoonBackgroundColor
if moon == -1 and fillBackground
    col := newMoonBackgroundColor
bgcolor(col, title="Moon Phase", transp=10)

//} --- PLOT


// STRATEGY     --- {

strategy = input("buy on new moon, sell on full moon", options=["buy on new moon, sell on full moon","sell on new moon, buy on full moon"])
longCond = strategy == "buy on new moon, sell on full moon" ? moon == -1 : moon == 1
shortCond = strategy == "buy on new moon, sell on full moon" ? moon == 1 : moon == -1

weAreInLongTrade = false
weAreInShortTrade = false
weAreInLongTrade := (longCond or weAreInLongTrade[1]) and shortCond == false
weAreInShortTrade := (shortCond or weAreInShortTrade[1]) and longCond == false
buySignal = longCond and weAreInLongTrade[1] == false
sellSignal = shortCond and weAreInShortTrade[1] == false

showBuySellSignals = input(defval=true, title = "Show Buy/Sell Signals")
longEnabled = input(true, title="Long enabled")
shortEnabled = input(true, title="Short enabled")

analysisStartYear = input(2017, "Backtesting From Year", minval=1980)
analysisStartMonth = input(1, "And Month", minval=1, maxval=12)
analysisStartDay = input(1, "And Day", minval=1, maxval=31)
analysisStartHour = input(0, "And Hour", minval=0, maxval=23)
analysisStartMinute = input(0, "And Minute", minval=0, maxval=59)
analyzeFromTimestamp = timestamp(analysisStartYear, analysisStartMonth, analysisStartDay, analysisStartHour, analysisStartMinute)

plotshape(showBuySellSignals and buySignal, title="Buy Label", text="Buy", location=location.belowbar, style=shape.labelup, size=size.tiny, color=color.green, textcolor=color.white, transp=0)
plotshape(showBuySellSignals and sellSignal, title="Sell Label", text="Sell", location=location.abovebar, style=shape.labeldown, size=size.tiny, color=color.red, textcolor=color.white, transp=0)

strategy.entry("long", strategy.long, when = time > analyzeFromTimestamp and buySignal and longEnabled)
strategy.entry("short", strategy.short, when = time > analyzeFromTimestamp and sellSignal and shortEnabled)
strategy.close("long", when = sellSignal)
strategy.close("short", when = buySignal)

//} --- STRATEGY