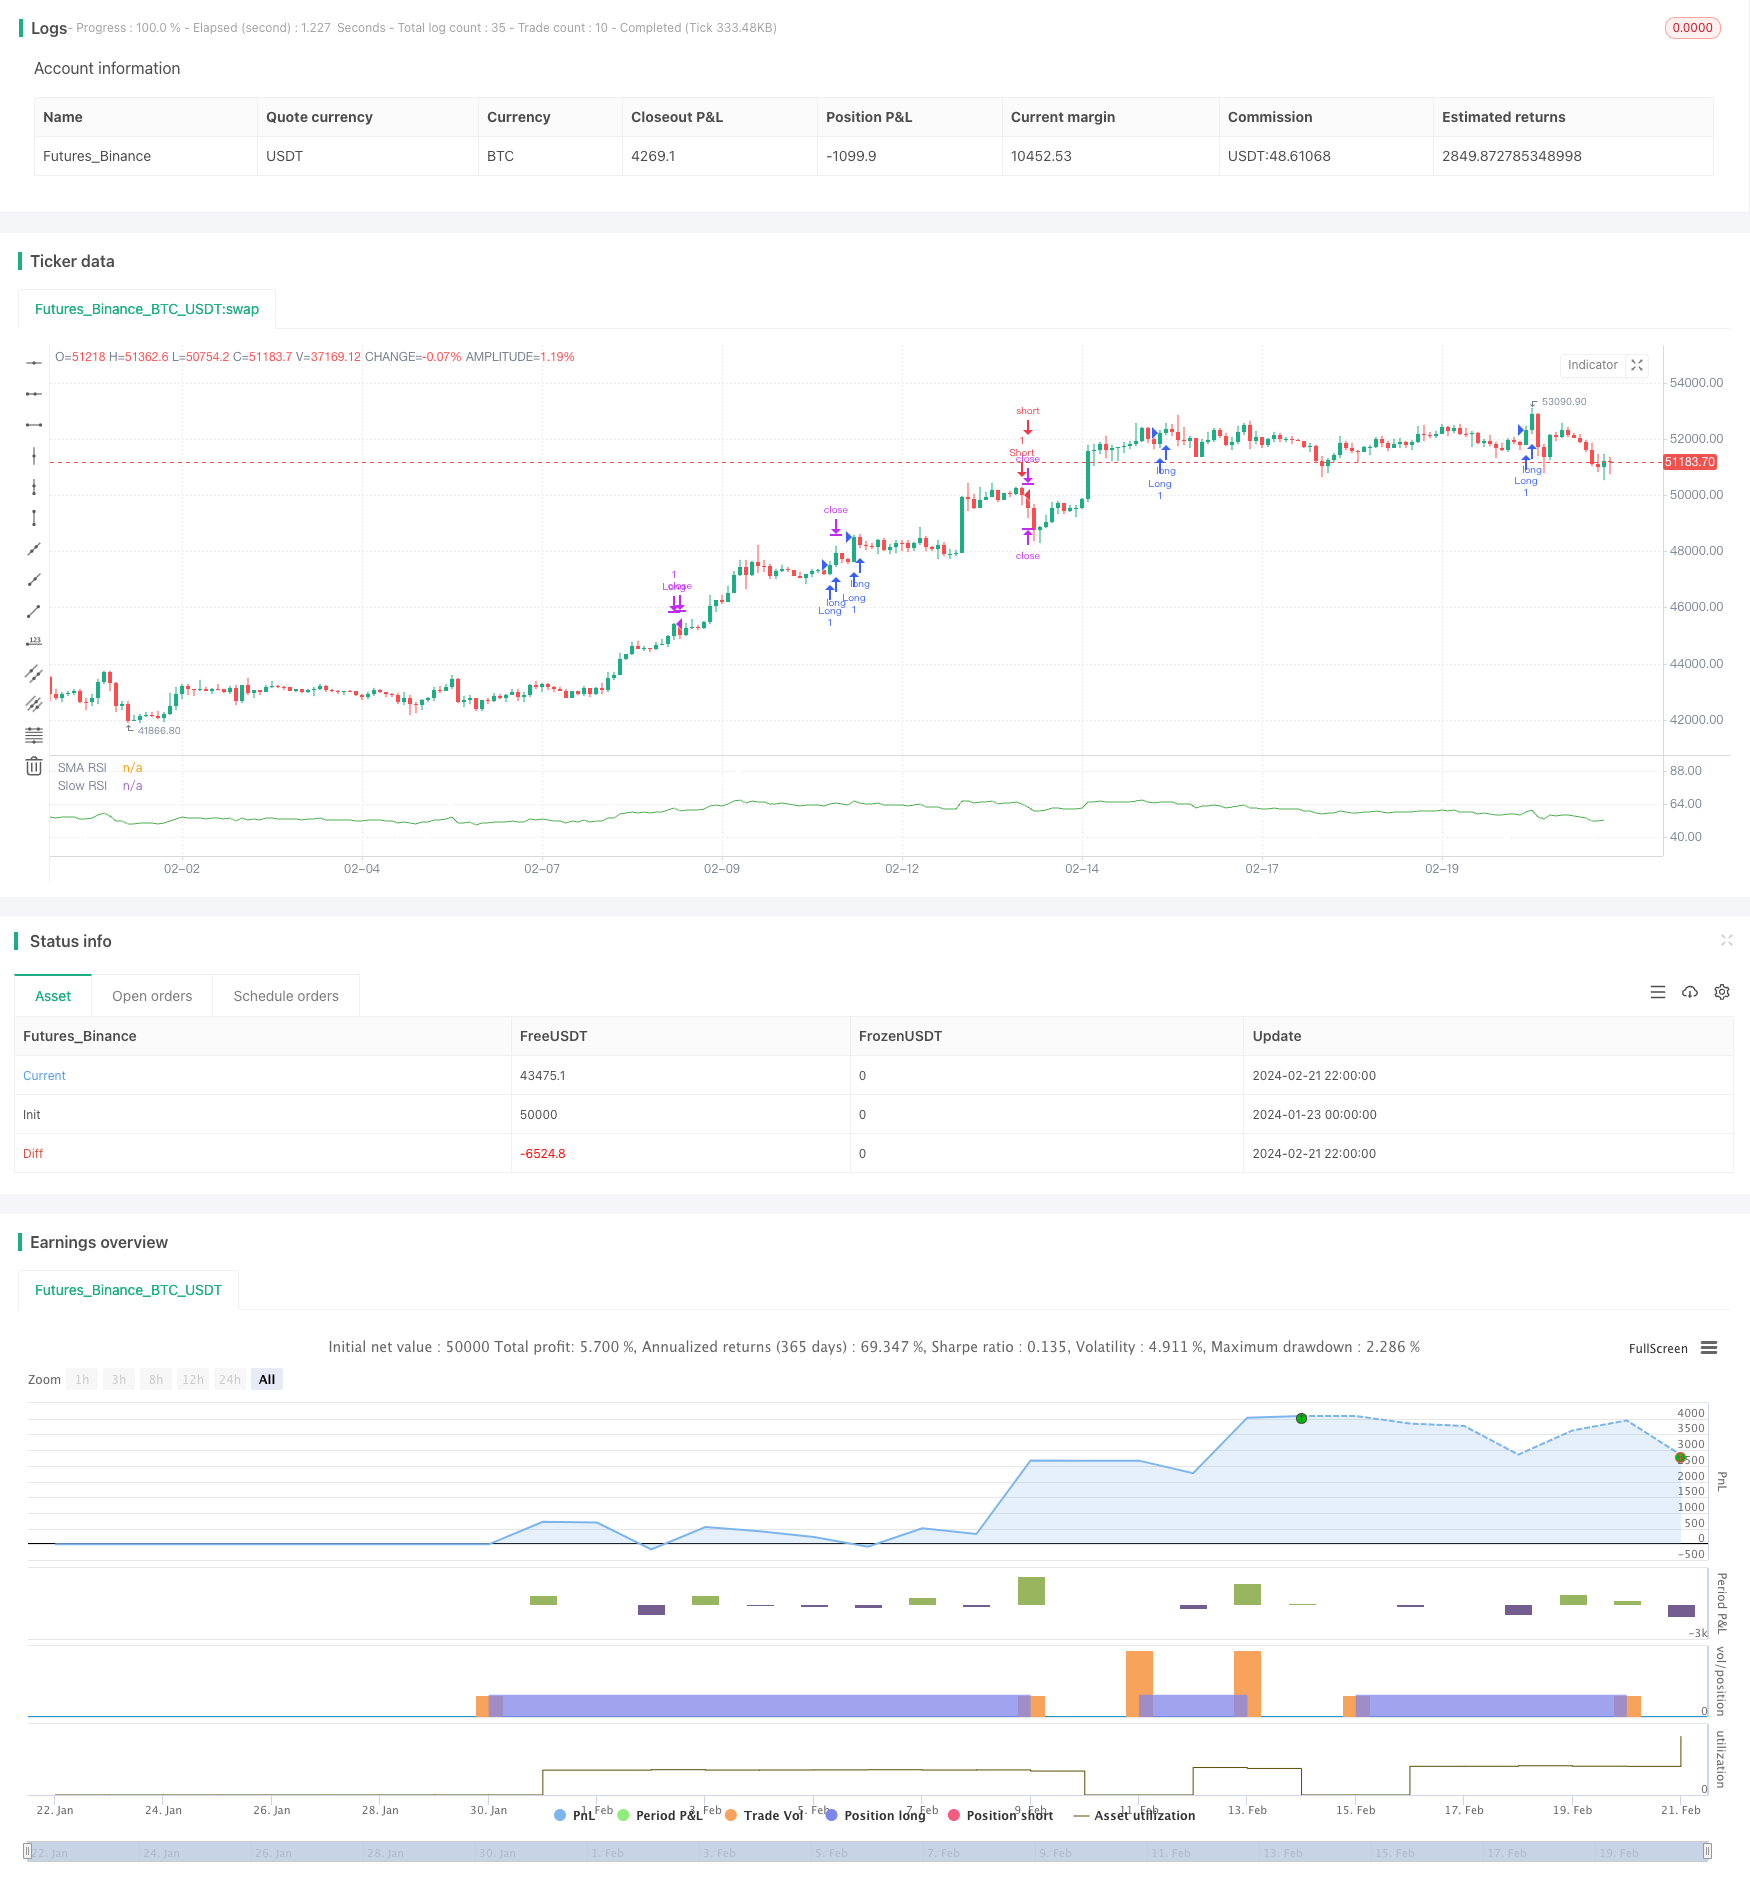
개요
SPY RSI Stochastics의 교차 가치 역전 트렌드 전략은 RSI 지표의 빠른 선과 느린 선의 교차를 사용하여 가격 역전을 판단하는 양적 거래 전략이다. 이 전략은 느린 선, 빠른 선 및 MA 선을 결합하여 특정 조건에서 구매 및 판매 신호를 생성하여 큰 가격 역전 기회를 잡는다.
전략 원칙
이 전략의 핵심 논리는 RSI 지표의 빠른 라인 교차에 기초한다. RSI는 일반적으로 과매도 과매도 영역에서 반전되기 때문에 빠른 RSI 라인과 느린 RSI 라인의 금포 및 사포 상황을 판단하여 가격을 반전 할 수있는 시간을 미리 판단 할 수 있습니다. 구체적으로, 전략은 다음과 같은 몇 가지 지표 및 조건에 주로 의존합니다.
- 느린 RSI 라인: 매개 변수가 64주기에 설정된 RSI 라인
- 빠른 RSI 선 (Fast RSI): 변수가 9진주로 설정된 RSI 선
- RSI MA 라인: 빠른 RSI 라인에 대한 3 주기의 간단한 이동 평균
- RSI 오버 바이 지역 절벽: 변수는 83로 설정됩니다.
- RSI 오버소드 지점 마이너스: 25로 설정
- RSI 중립 영역: 39에서 61 사이
- 거래시간은 평일 9시부터 다음 날 9시까지입니다.
빠른 RSI 라인이 느린 RSI 라인을 지나고 MA 라인을 지나면 구매 신호를 생성합니다. 빠른 RSI 라인이 느린 RSI 라인을 지나고 MA 라인을 지나면 판매 신호를 생성합니다.
또한, 일부 노이즈 트레이딩을 필터링하기 위해, 이 전략은 다음과 같은 논리를 설정합니다:
- RSI 중립 영역 사이에는 거래 신호가 발생하지 않습니다.
- 오직 평일 9시부터 다음 날 9시 사이에 거래하는 것
입학 후, 두 가지 탈퇴 조건이 있습니다:
- 빠른 RSI 선이 역방역에 들어서면 평점 (오버 바이 또는 오버 소지)
- 반전된 RSI 교차 신호를 생성할 때 평행
전략적 강점 분석
SPY RSI Stochastics의 교차 가치 반전 트렌드 전략의 가장 큰 장점은 가격이 더 명백한 반전이 발생하기 전에 트렌드를 잡을 수 있다는 것입니다. 빠른 느린 RSI 라인을 교차하는 방식으로, 그것은 일정 시간 전에 거래 신호를 발송하여 입구 기회를 만들 수 있습니다. 또한, 이 전략은 다음과 같은 몇 가지 장점이 있습니다.
- 전략적 신호 생성 규칙이 명확하고, 이해하기 쉽고, 추적할 수 있습니다.
- 듀얼 필터 디자인을 사용하여 일부 노이즈 신호를 줄일 수 있습니다.
- 다양한 시장 환경에 맞는 과매매 간격의 유연한 설정
- 트렌드 추적 및 역 포착 기능
전체적으로, 이 전략은 트렌드 추적과 가치 반전의 판단을 결합하여 가격 반전의 시기를 어느 정도 파악할 수 있으며, 강력한 실용성을 가지고 있다.
전략적 위험 분석
SPY RSI Stochastics의 교차 변동 전략에는 장점이 있지만 다음과 같은 주요 위험도 있습니다.
- 이중 필터 설계에도 불구하고, 노이즈 트레이딩의 위험을 완전히 피할 수는 없습니다.
- RSI 교차는 가격의 실제 전환점을 완벽하게 예측할 수 없으며, 약간의 어려움이 있습니다.
- 적절한 매개 변수 설정을 선택해야 합니다. 그렇지 않으면 너무 자주 또는 희박한 거래가 발생할 수 있습니다.
- 엑스포의 경우, 엑스포의 경우, 엑스포의 경우, 엑스포의 경우,
위와 같은 위험들에 대해, 이 전략은 다음과 같은 측면에서 최적화되고 개선될 수 있습니다.
- 기계 학습 알고리즘을 사용하여 최적의 매개 변수를 훈련하여 신호 소음을 줄이십시오.
- 다른 기술 지표 판단과 함께 교차 신호의 신뢰성을 향상
- 단편 거래에 대한 위험을 통제하기 위한 손해 방지 장치를 늘립니다.
- 최적화 매개 변수가 자동으로 업데이트되고, 전략의 적응성을 향상시킵니다.
전략 최적화 방향
SPY RSI Stochastics의 교차 가치 역전 전략은 다음과 같은 몇 가지 측면에서 최적화 될 수 있습니다.
- 변수 최적화유전 알고리즘, 격자 검색과 같은 더 체계적인 방법을 통해 최적의 변수 조합을 찾아내는 것
- 특징 공사거래량 변화, 변동성 등과 같은 가격에 영향을 미치는 특징을 추가하여 의사결정을 돕습니다.
- 기계 학습: 기계학습 알고리즘을 사용하여 크로스 판결을 훈련하여 정확도를 높인다.
- 손해 방지 최적화플로잉 스톱, 타임 스톱과 같은 메커니즘을 도입하여 리스크를 제어합니다.
- 업데이트에 적응: 핵심 매개 변수를 실시간 시장 상황에 따라 조정할 수 있게 한다.
이러한 최적화는 전략의 매개 변수를 더 지능화하고 신호를 더 신뢰할 수 있게 만들 수 있으며, 또한 시장 변화에 따라 전략 규칙을 조정할 수 있어 전략의 안정적인 수익성을 크게 향상시킬 수 있다.
요약하다
SPY RSI Stochastics의 교차 가치 반전 트렌드 전략은 RSI 느리고 빠른 선의 교차 상황을 판단하여 비교적 간단하고 명확한 양적 거래 전략을 설계했습니다. 그것은 트렌드 추적과 반전 거래의 특성을 결합하여 가격의 반전 시기를 어느 정도 파악 할 수 있습니다. 그러나이 전략에는 또한 고유 한 결함이 있습니다.
/*backtest
start: 2024-01-23 00:00:00
end: 2024-02-22 00:00:00
period: 2h
basePeriod: 15m
exchanges: [{"eid":"Futures_Binance","currency":"BTC_USDT"}]
*/

//@version=5
strategy("SPY Auto RSI Stochastics", pyramiding = 3)


// Input parameters
slowRSILength = input(64, title="SLOW RSI Length")
fastRSILength = input(9, title="FAST RSI Length")
smaRSILength = input(3, title="RSI SMA Length")
RSIUpperThreshold = input(83, title="RSI Upper")
RSILowerThreshold = input(25, title="RSI Lower")
RSIUpperDeadzone = input(61, title='RSI Upper Deadzone')
RSILowerDeadzone = input(39, title='RSI Lower Deadzone')
blockedDays = (dayofweek(time) == 1 or dayofweek(time) == 7)
sessionMarket = input("0900-0900", title="Session Start")
allowedTimes() => time(timeframe = timeframe.period, session = sessionMarket, timezone = "GMT+1")
isvalidTradeTime =true

// RSI and ATR
slowRSI = ta.rsi(close, slowRSILength)
fastRSI = ta.rsi(close, fastRSILength)
smaRSI = ta.sma(fastRSI, smaRSILength)
rsi = fastRSI

// Entry condition
RSIUptrend() =>  ta.crossover(fastRSI, slowRSI) and ta.crossover(fastRSI, smaRSI)
RSIDowntrend() =>  ta.crossunder(fastRSI, slowRSI) and ta.crossunder(fastRSI, smaRSI)


isRSIDeadzone() =>
    rsi < RSIUpperDeadzone and rsi > RSILowerDeadzone

isBullishEngulfing() =>
    close > high[1]

isBearishEngulfing() =>
    close < low[1]

// Declare variables
var float initialSLLong = na
var float initialTPLong = na
var float initialSLShort = na
var float initialTPShort = na
//var bool inATrade = false

entryConditionLong = RSIUptrend() and not isRSIDeadzone() and isvalidTradeTime
entryConditionShort = RSIDowntrend() and not isRSIDeadzone() and isvalidTradeTime

exitConditionLong = entryConditionShort or fastRSI > RSIUpperThreshold
exitConditionShort = entryConditionLong or fastRSI < RSILowerThreshold


if (entryConditionLong)
    strategy.entry(id = "Long", direction = strategy.long, alert_message = 'LONG! beep boop, all aboard the long train')

if (entryConditionShort)
    strategy.entry(id = "Short", direction = strategy.short, alert_message = 'Short! beep boop, all aboard the short train')

if (exitConditionLong)
    strategy.exit("Long", from_entry="Long", limit=close, alert_message = 'Stop Long, halt halt, take the profits and runnn')

if (exitConditionShort)
    strategy.exit("Short", from_entry="Short", limit=close, alert_message = 'Stop Short, halt halt, take the profits and runnn')


//plot(smaRSI, "RSI MA", color=color.red)
plot(slowRSI, "Slow RSI", color=color.green)
//plot(fastRSI, "Fast RSI", color=color.white)
plot(smaRSI, "SMA RSI", color=color.white)