개요
이 전략은 지수 이동 평균 (EMA), 이동 평균 수렴 분산 지수 (MACD), 슈퍼 트렌드 (SuperTrend), 평균 방향 지수 (ADX) 및 평균 실제 파도 (ATR) 를 포함한 여러 기술 지표를 통합하여 시장 추세, 변동성 및 거래 신호를 판단하여 암호화폐 거래에서 좋은 수익을 얻도록합니다. 이 전략은 다른 지표의 장점을 활용하여 추세 판단, 충격 판단 및 위험 제어 등의 균형을 맞추기 위해 노력하고 있으며, 거래자에게 신뢰할 수있는 거래 신호를 제공합니다.
전략 원칙
- 12일과 26일 EMA의 교차를 트렌드 판단의 근거로 사용하며, 12일 EMA가 26일 EMA를 횡단할 때 상승 트렌드를 나타내고, 반대로 하락 트렌드를 나타낸다.
- MACD 지표를 보조 판단으로 사용하여, MACD 직각이 0보다 크면 EMA 다중 헤드 신호와 함께 포지션을 열고, MACD 직각이 0보다 작으면 EMA 공백 신호와 함께 포지션을 열습니다.
- ADX 지표를 통해 시장이 트렌드 상태인지 판단할 수 있으며, ADX가 15보다 크면 시장이 트렌드 기간에 있다고 본다.
- ATR 지수를 사용하여 시장의 변동성을 판단하기 위해, ATR이 20일 ATR의 0.5배 이상일 때 시장이 높은 변동 상태에 있다고 본다.
- 수퍼트렌드 지표가 중단 조건으로 도입되어, 가격이 수퍼트렌드를 넘어갈 때 상위 포지션을 평면화하고, 가격이 수퍼트렌드를 넘어갈 때 공백 포지션을 평면화한다.
- EMA, MACD, ADX 및 ATR 조건을 충족할 때, 오버헤드 또는 오버헤드 신호에 따라 포지션을 열고; 슈퍼 트렌드 스톱 조건이 발생했을 때 포지션을 청산한다.
전략적 이점
- 다중 지표 포트폴리: 이 전략은 여러 가지 기술 지표를 사용하여 트렌드, 흔들림 및 위험 제어와 같은 여러 차원의 시장 분석을 통해 거래 신호의 신뢰성을 향상시킵니다.
- 동향 판단: EMA와 MACD의 조합을 통해, 전략은 시장의 동향 방향을 더 잘 판단할 수 있으며, 거래 결정을 위한 근거를 제공합니다.
- 위험 제어: ADX와 ATR 지표를 도입하여 시장의 경향의 강도와 변동성을 판단하여 거래 위험을 어느 정도 제어합니다.
- 손해 중지 메커니즘: SuperTrend 지표를 손해 중지 조건으로 사용하여 거래 단위의 최대 손실을 효과적으로 제한하고 거래 자금을 보호합니다.
- 매개 변수 유연성: 이 전략의 각 지표 매개 변수는 변화하는 시장 환경에 적응하기 위해 다양한 시장 상황과 거래 품종에 따라 유연하게 조정 될 수 있습니다.
전략적 위험
- 매개 변수 최적화: 이 전략은 EMA 주기, MACD 매개 변수, ADX 값 등과 같은 여러 지표와 매개 변수를 포함합니다. 이 매개 변수 선택은 전략 효과에 중요한 영향을 미치며, 반복적인 매개 변수 최적화 및 디비팅이 필요합니다.
- 시장 적응성: 이 전략은 불안한 시장이나 트렌드 전환점과 같은 특정 시장 상황에서 부실하게 작동할 수 있습니다. 이 때 전략은 잘못된 거래 신호를 보낼 수 있습니다.
- 슬라이프 포인트 및 거래 비용: 이 전략은 높은 변동성 시장에서 더 자주 거래 신호를 생성할 수 있으며, 이는 전략 수익에 영향을 미치는 높은 슬라이프 포인트 및 거래 비용을 초래합니다.
- 회수 제한: 이 전략의 회수 결과에 한계가 있을 수 있으며, 실제 거래의 시장 상태는 역사적 데이터와 차이가 있을 수 있으며, 전략의 실장 운영에서의 성과는 회수 결과에 완전히 일치하지 않을 수 있다.
전략 최적화 방향
- 동적 파라미터 최적화: 다양한 시장 상황과 거래 유형에 따라 전략의 핵심 파라미터를 동적으로 최적화하여 전략의 적응성과 안정성을 향상시킵니다.
- 시장 정서 지표 도입: 기존 지표의 기초에, 공포 지수 (VIX) 와 같은 시장 정서를 반영하는 지표를 도입하여 시장 정서를 정량적으로 분석하여 거래 결정을 보조하십시오.
- 손해 차단 메커니즘 개선: 슈퍼 트렌드 손해 차단에 기초하여, 이동 손해 차단, 비율 손해 차단 등과 같은 다른 손해 차단 방법을 도입하여 손해 차단의 유연성과 효율성을 향상시킵니다.
- 포지션 관리 최적화: 시장 추세의 강도, 변동성 등의 요인에 따라 포지션 크기를 동적으로 조정하고, 추세가 명확할 때 포지션을 늘리고, 흔들리는 시장에서 포지션을 줄이고, 자금 활용 효율성을 높인다.
- 다중 시간 프레임 분석: 다른 시간 프레임의 신호와 같은 일선, 4 시간 선 등과 결합하여 거래 신호를 여러 번 확인하여 신호의 신뢰성을 높인다.
요약하다
EMA-MACD-SuperTrend-ADX-ATR 다중 지표 거래 신호 전략은 여러 기술 지표를 통합적으로 사용하는 양적 거래 전략이다. EMA, MACD, ADX 및 ATR과 같은 지표의 조합을 통해 전략은 트렌드, 변동 및 위험 제어와 같은 여러 차원의 시장 분석을 수행하여 거래자에게 신뢰할 수있는 거래 신호를 제공합니다. 이 전략의 장점은 다중 지표 조합, 추세 판단, 위험 제어 및 손해 방지 장치와 같은 측면에 있지만, 또한 파라미터 최적화, 시장 적응성, 거래 비용 및 재 측정 등의 제한적 위험이 있습니다.
전략 소스 코드
/*backtest
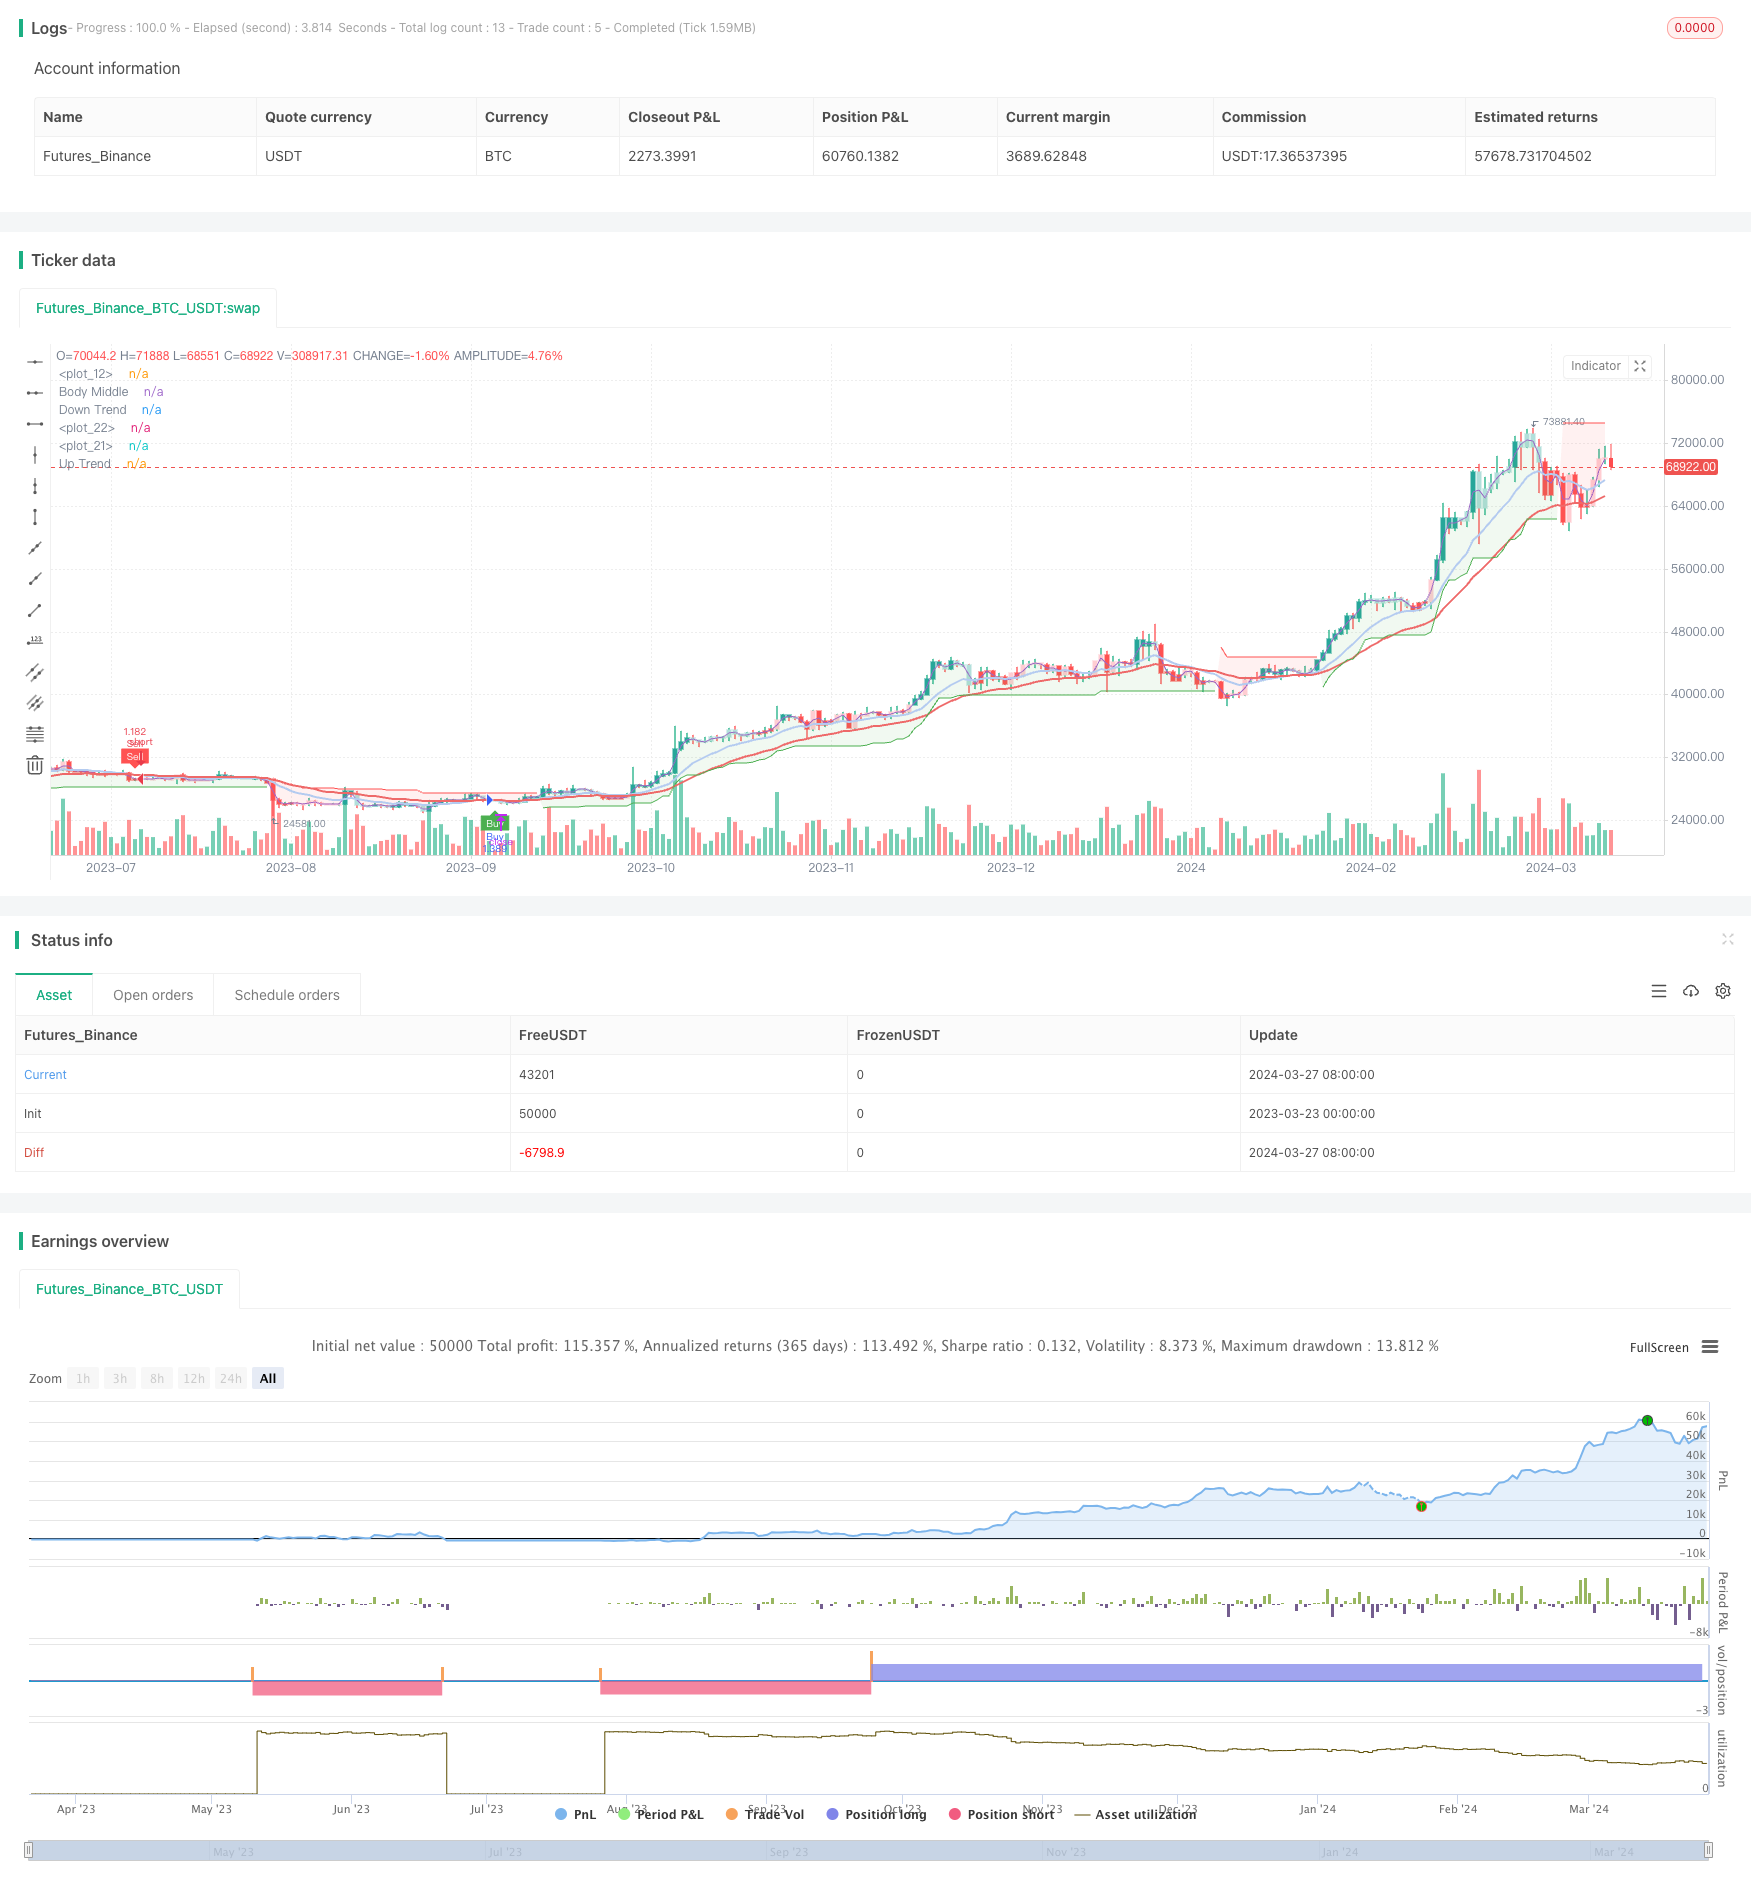
start: 2023-03-23 00:00:00
end: 2024-03-28 00:00:00
period: 1d
basePeriod: 1h
exchanges: [{"eid":"Futures_Binance","currency":"BTC_USDT"}]
*/
//@version=5
strategy("EMA-MACD-SuperTrend-ADX-ATR Strategy",
overlay = true,
initial_capital = 1000,
default_qty_type = strategy.percent_of_equity,
default_qty_value = 70)
//MACD
[macdLine, signalLine, hist] = ta.macd(close, 12, 26, 9)
//Plot Candlesticks
candlestickscolor = (hist >= 0 ? (hist[1] < hist ? #26A69A : #B2DFDB) : (hist[1] < hist ? #FFCDD2 : #FF5252))
plotcandle(open, high, low, close,
color = candlestickscolor,
bordercolor = candlestickscolor)
//EMA
ema12 = ta.ema(close, 12)
ema26 = ta.ema(close, 26)
//Plot EMA
plot(ema26, color= #EE6969, linewidth = 2)
plot(ema12, color= #B4CBF0, linewidth = 2)
//Average Directional Index (ADX) Calculation
trueRange = ta.rma(ta.tr, 14)
plusDM = ta.rma(math.max(high - high[1], 0), 14)
minusDM = ta.rma(math.max(low[1] - low, 0), 14)
plusDI = 100 * ta.rma(plusDM / trueRange, 14)
minusDI = 100 * ta.rma(minusDM / trueRange, 14)
adxValue = 100 *ta.rma(math.abs(plusDI - minusDI) / (plusDI + minusDI), 14)
//Trend Confirmation (ADX)
trending = adxValue > 15
//Volatility Filter (ATR)
atrValue = ta.atr(14)
volatility = atrValue > 0.5 * ta.atr(20)
//SuperTrend
atrlength = input.int(10, "ATR Length", step = 1)
factor = input.float(3, "Factor", step = 0.1)
[supertrend, direction] = ta.supertrend(factor, atrlength)
supertrend := barstate.isfirst ? na : supertrend
//Plot SuperTrend
uptrend = plot(direction < 0 ? supertrend : na,
"Up Trend", color = color.green, style = plot.style_linebr, linewidth = 1)
downtrend = plot(direction > 0 ? supertrend : na,
"Down Trend", color = color.red, style = plot.style_linebr, linewidth = 1)
bodymiddle = plot(barstate.isfirst ? na : (open + close)/2, "Body Middle", display = display.none)
fill(bodymiddle, uptrend, color.new(color.green, 90), fillgaps = false)
fill(bodymiddle, downtrend, color.new(color.red, 90), fillgaps = false)
//Entry Conditions
longCondition = ta.crossover(ema12, ema26) and trending and volatility and hist > 0
shortCondition = ta.crossunder(ema12, ema26) and trending and volatility and hist < 0
long_SL_Con = ta.crossunder(close, supertrend)
short_SL_Con = ta.crossover(close, supertrend)
//Plot Signal
plotshape(longCondition,
title='Buy', text='Buy',
location= location.belowbar,
style=shape.labelup, size=size.tiny,
color=color.green, textcolor=color.new(color.white, 0))
plotshape(shortCondition,
title='Sell', text='Sell',
location= location.abovebar,
style=shape.labeldown, size=size.tiny,
color=color.red, textcolor=color.new(color.white, 0))
//Backtest
start = timestamp(2020, 1, 1, 0, 0, 0)
end = timestamp(2024, 1, 1, 0, 0, 0)
backtestperiod = time >= start and time <= end
if longCondition and backtestperiod
strategy.entry("Buy", strategy.long)
if long_SL_Con and backtestperiod
strategy.close("Buy")
if shortCondition and backtestperiod
strategy.entry("Sell", strategy.short)
if short_SL_Con and backtestperiod
strategy.close("Sell")