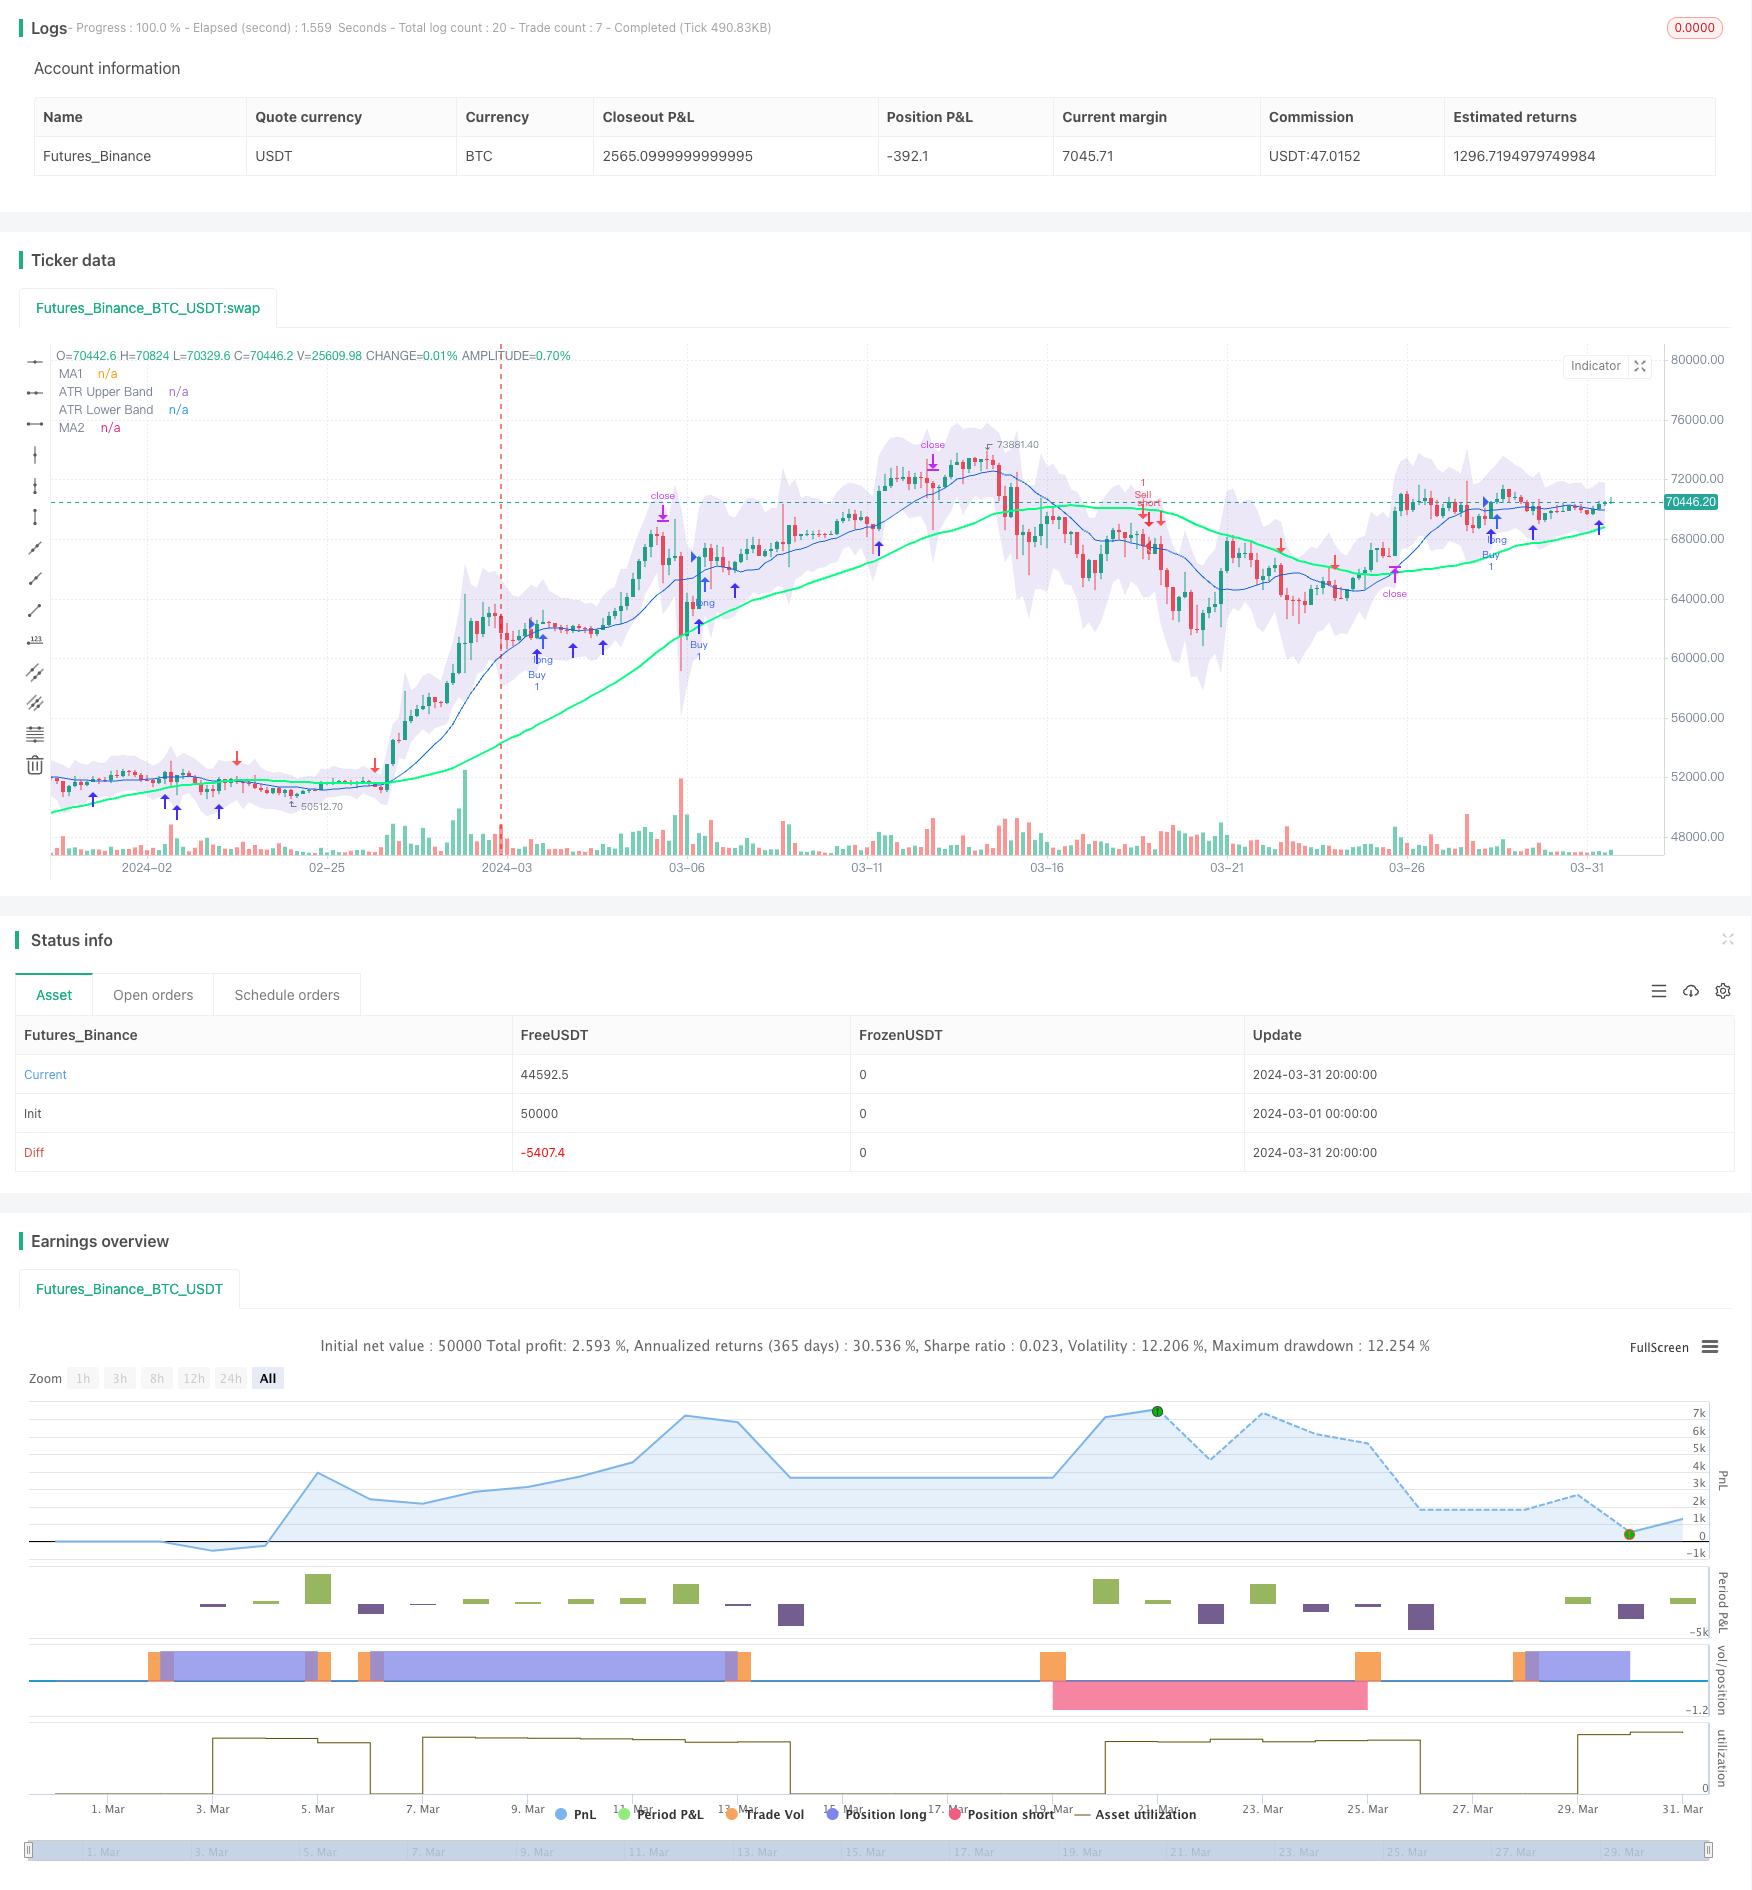
개요
“비평선 뒤떨어진 돌파 전략”은 흔히 쓰이는 기술 분석 거래 전략이다. 이 전략은 두 개의 다른 주기의 간단한 이동 평균 (SMA) 과 평균 실제 파도 (ATR) 지표를 결합하여 시장 추세 전환점을 포착하여 낮은 위험 높은 수익을 창출하는 거래를 목표로 한다. 그것의 핵심 아이디어는 평선의 뒤떨어진 성과와 시장의 변동성을 활용하여 가격이 평선을 돌파하고 변동률이 통제 가능한 범위에서 거래 신호를 발생시킨다.
전략 원칙
이 전략의 주요 원칙은 다음과 같습니다.
- 두 개의 다른 주기 (SMA) 의 간단한 이동 평균을 계산합니다. 기본은 각각 14과 50의 주기입니다.
- 시장의 변동성을 측정하는 ATR 지수를 계산합니다. 기본 주기는 14입니다.
- 가격 변동의 참조 영역으로 ATR의 상하 레일을 그리십시오. 상하 레일은 최고 가격과 ATR의 배수 (기본 1.5) 로 얻어지며, 하하 레일은 최저 가격과 ATR의 배수 (기본 1.5) 로 얻어집니다.
- 클로즈오프가격에서 단기평균선을 통과하고 단기평균선이 장기평균선 위에 있을 때, 다중 신호를 생성하고 K선 아래에 상향 화살표를 그리는 것이다.
- 클로즈 가격 아래로 단기 평균선을 통과하고 단기 평균선은 장기 평균선 아래로 갈 때, 코로나 신호가 발생하고 K선 위로 하향 화살표가 그려진다.
- 스톱로스와 스톱로스를 설정하고, 스톱로스는 최저 가격으로 ATR을 곱한 배수, 스톱로스는 포지션 개시 가격으로 더한 ((포지션 개시 가격 - 스톱로스) 를 곱한 2배 다.
위의 원리를 통해 볼 수 있듯이, 이 전략은 평선 시스템의 추세 판단과 ATR 지표의 변동률 측정을 결합하여, 추세를 추적하는 것을 주력으로 하며, 철회 위험을 제어하는 동시에, 추세형 전략이다.
우위 분석
“비평선 뒤처진 돌파구 전략”은 다음과 같은 장점을 가지고 있습니다.
- 트렌드 추적: 평선 시스템으로 트렌드 방향을 판단, 큰 시장 추세를 포착, 시장에 순응한다.
- 위험 제어: ATR 지표를 사용하여 시장의 변동성을 측정하고, 합리적인 스톱 리스를 설정하여, 인출을 허용 범위 내에서 제어한다.
- 매개 변수 유연성: 평균선주기, ATR주기 및 곱수 등의 매개 변수는 다른 시장과 품종에 따라 최적화 및 조정할 수 있으며, 어느 정도 보편성이 있다.
- 직관적이었습니다: 거래 신호는 간단하고 명확하며, 다양한 수준의 투자자들이 사용할 수 있습니다.
위험 분석
이 전략은 장점이 있지만 다음과 같은 위험도 있습니다.
- 자주 거래: 시장의 변동이 크고, 추세가 명확하지 않을 때, 이 전략은 거래 비용을 증가시키는 자주 거래 신호를 생성할 수 있다.
- 뒤처짐: 일직선 시스템은 본질적으로 약간의 뒤처짐을 가지고 있으며, 시장 전환 초기에는 약간의 회전이 발생할 수 있습니다.
- 매개 변수 최적화: 다른 매개 변수 설정은 전략 성능에 큰 영향을 미치며, 다른 시장과 품종에 대한 매개 변수 최적화를 필요로 하며, 실행의 난이도를 증가시킨다.
위와 같은 위험들에 대해, 다음과 같은 측면에서 최적화 및 개선이 가능합니다.
- 트렌드 필터 도입: 거래 신호를 생성하기 전에 대주기의 트렌드 방향을 먼저 판단하고, 대주기 트렌드가 명확한 경우에만 거래하여, 빈번한 거래를 줄인다.
- 최적화 중지 손실: 이동 중지, 변동률 중지와 같은 동적 중지 방법을 도입하고 시장 변동률에 따라 중지 위치를 조정하여 전략의 유연성을 향상시킬 수 있습니다.
- 조합 최적화: 이 전략을 다른 기술 지표 또는 기본 요소와 결합하여 전략의 안정성을 높인다.
최적화 방향
이 전략은 다음과 같은 부분에서 최적화될 수 있습니다.
- 매개 변수 자체 적응 최적화: 다양한 품종과 주기에 대해 자동으로 최적의 매개 변수 조합을 찾고, 인위적인 매개 변수调试의 작업량을 줄인다. 유전 알고리즘, 격자 검색 등의 방법을 적용하여 최적화 할 수 있다.
- 신호 필터링: 거래 신호를 생성 한 후, 다른 기술 지표 또는 기본 요소를 추가로 도입하여 신호를 2차 확인하여 신호 품질을 향상시킬 수 있습니다. 예를 들어 거래량 지표를 추가하여 트렌드 강도를 판단하고, 거시 경제 데이터를 추가하여 트렌드 지속에 유리한 여부를 판단합니다.
- 포지션 관리: 포지션을 개시할 때, 시장 변동률, 계좌 위험 등과 같은 요인에 따라 포지션 크기를 동적으로 조정하여 단일 거래 위험을 제어할 수 있다. 케일리 수식, 고정 비율법 등과 같은 방법을 사용하여 포지션 관리한다.
- 이동 스톱: 초기 스톱은 고정되어 있으며, 가격이 유리한 방향으로 이동함에 따라 스톱을 유리한 방향으로 이동하는 것이 고려 될 수 있으며, 회수량을 줄이고 자금 활용 효율성을 높일 수 있습니다. 흔한 방법은 추적 스톱, 부하 스톱 등입니다.
위의 최적화는 전략의 적응성, 안정성 및 수익성을 향상시킬 수 있지만, 과도한 최적화는 전략 곡선 적합성을 초래할 수 있으므로 샘플 외부에서 좋지 않은 성능을 발휘할 수 있으므로 샘플 내부 및 외부에서 충분한 피드백 검증이 필요합니다.
요약하다
“쌍평평선 낙후 돌파 전략”은 평평선 시스템을 통해 트렌드 방향을 판단하고, ATR 지표를 사용하여 위험을 제어하고, 트렌드 행태를 포착하면서 위험 관리를 겸비하는 고전적인 트렌드 추적 전략이다. 약간의 낙후성 및 빈번한 거래 문제가 있음에도 불구하고, 스톱 로즈 스톱을 최적화하고, 신호 필터링, 변수 적응, 최적화, 포지션 관리 등의 방법을 도입함으로써 이 전략의 성능을 더욱 향상시킬 수 있으며, 실용적인 수량화 거래 전략으로 만들 수 있다.
/*backtest
start: 2024-03-01 00:00:00
end: 2024-03-31 23:59:59
period: 4h
basePeriod: 15m
exchanges: [{"eid":"Futures_Binance","currency":"BTC_USDT"}]
*/

//@version=4
strategy(title="2 Moving Averages", shorttitle="2MA", overlay=true)

// Moving Averages
len = input(14, minval=1, title="Length MA1")
src = input(close, title="Source MA1")
ma1 = sma(src, len)

len2 = input(50, minval=1, title="Length MA2")
src2 = input(close, title="Source MA2")
ma2 = sma(src2, len2)

// Plotting Moving Averages
plot(ma1, color=#0b6ce5, title="MA1")
plot(ma2, color=#00ff80, linewidth=2, title="MA2")

// ATR Bands
atrLength = input(14, title="ATR Length")
atrMultiplier = input(1.5, title="ATR Multiplier")
upperBand = high + atr(atrLength) * atrMultiplier
lowerBand = low - atr(atrLength) * atrMultiplier

u =plot(upperBand, color=color.rgb(217, 220, 223, 84), title="ATR Upper Band")
l = plot(lowerBand, color=color.rgb(217, 220, 223, 84), title="ATR Lower Band")
fill(u, l, color=#471eb821, title="ATR Background")

// Conditions for plotting arrows
upArrowCondition = ma1 > ma2 and crossover(close, ma1)
downArrowCondition = ma1 < ma2 and crossunder(close, ma1)

// Plotting arrows
plotshape(upArrowCondition, style=shape.arrowup, color=color.rgb(66, 45, 255), size=size.normal, location=location.belowbar, title="Up Arrow")
plotshape(downArrowCondition, style=shape.arrowdown, color=color.red, size=size.normal, location=location.abovebar, title="Down Arrow")
// Checkbox for trade execution
showTrades = input(true, title="Hiển thị giao dịch")

// Buy Condition
if (upArrowCondition and showTrades)
    strategy.entry("Buy", strategy.long)

// Sell Condition
if (downArrowCondition and showTrades)
    strategy.entry("Sell", strategy.short)

// Stop Loss and Take Profit
stopLossBuy = low - atr(14) * atrMultiplier
takeProfitBuy = close + (close - stopLossBuy) * 2

stopLossSell = high + atr(14) * atrMultiplier
takeProfitSell = close - (stopLossSell - close) * 2

strategy.exit("Exit Buy", "Buy", stop=stopLossBuy, limit=takeProfitBuy)
strategy.exit("Exit Sell", "Sell", stop=stopLossSell, limit=takeProfitSell)