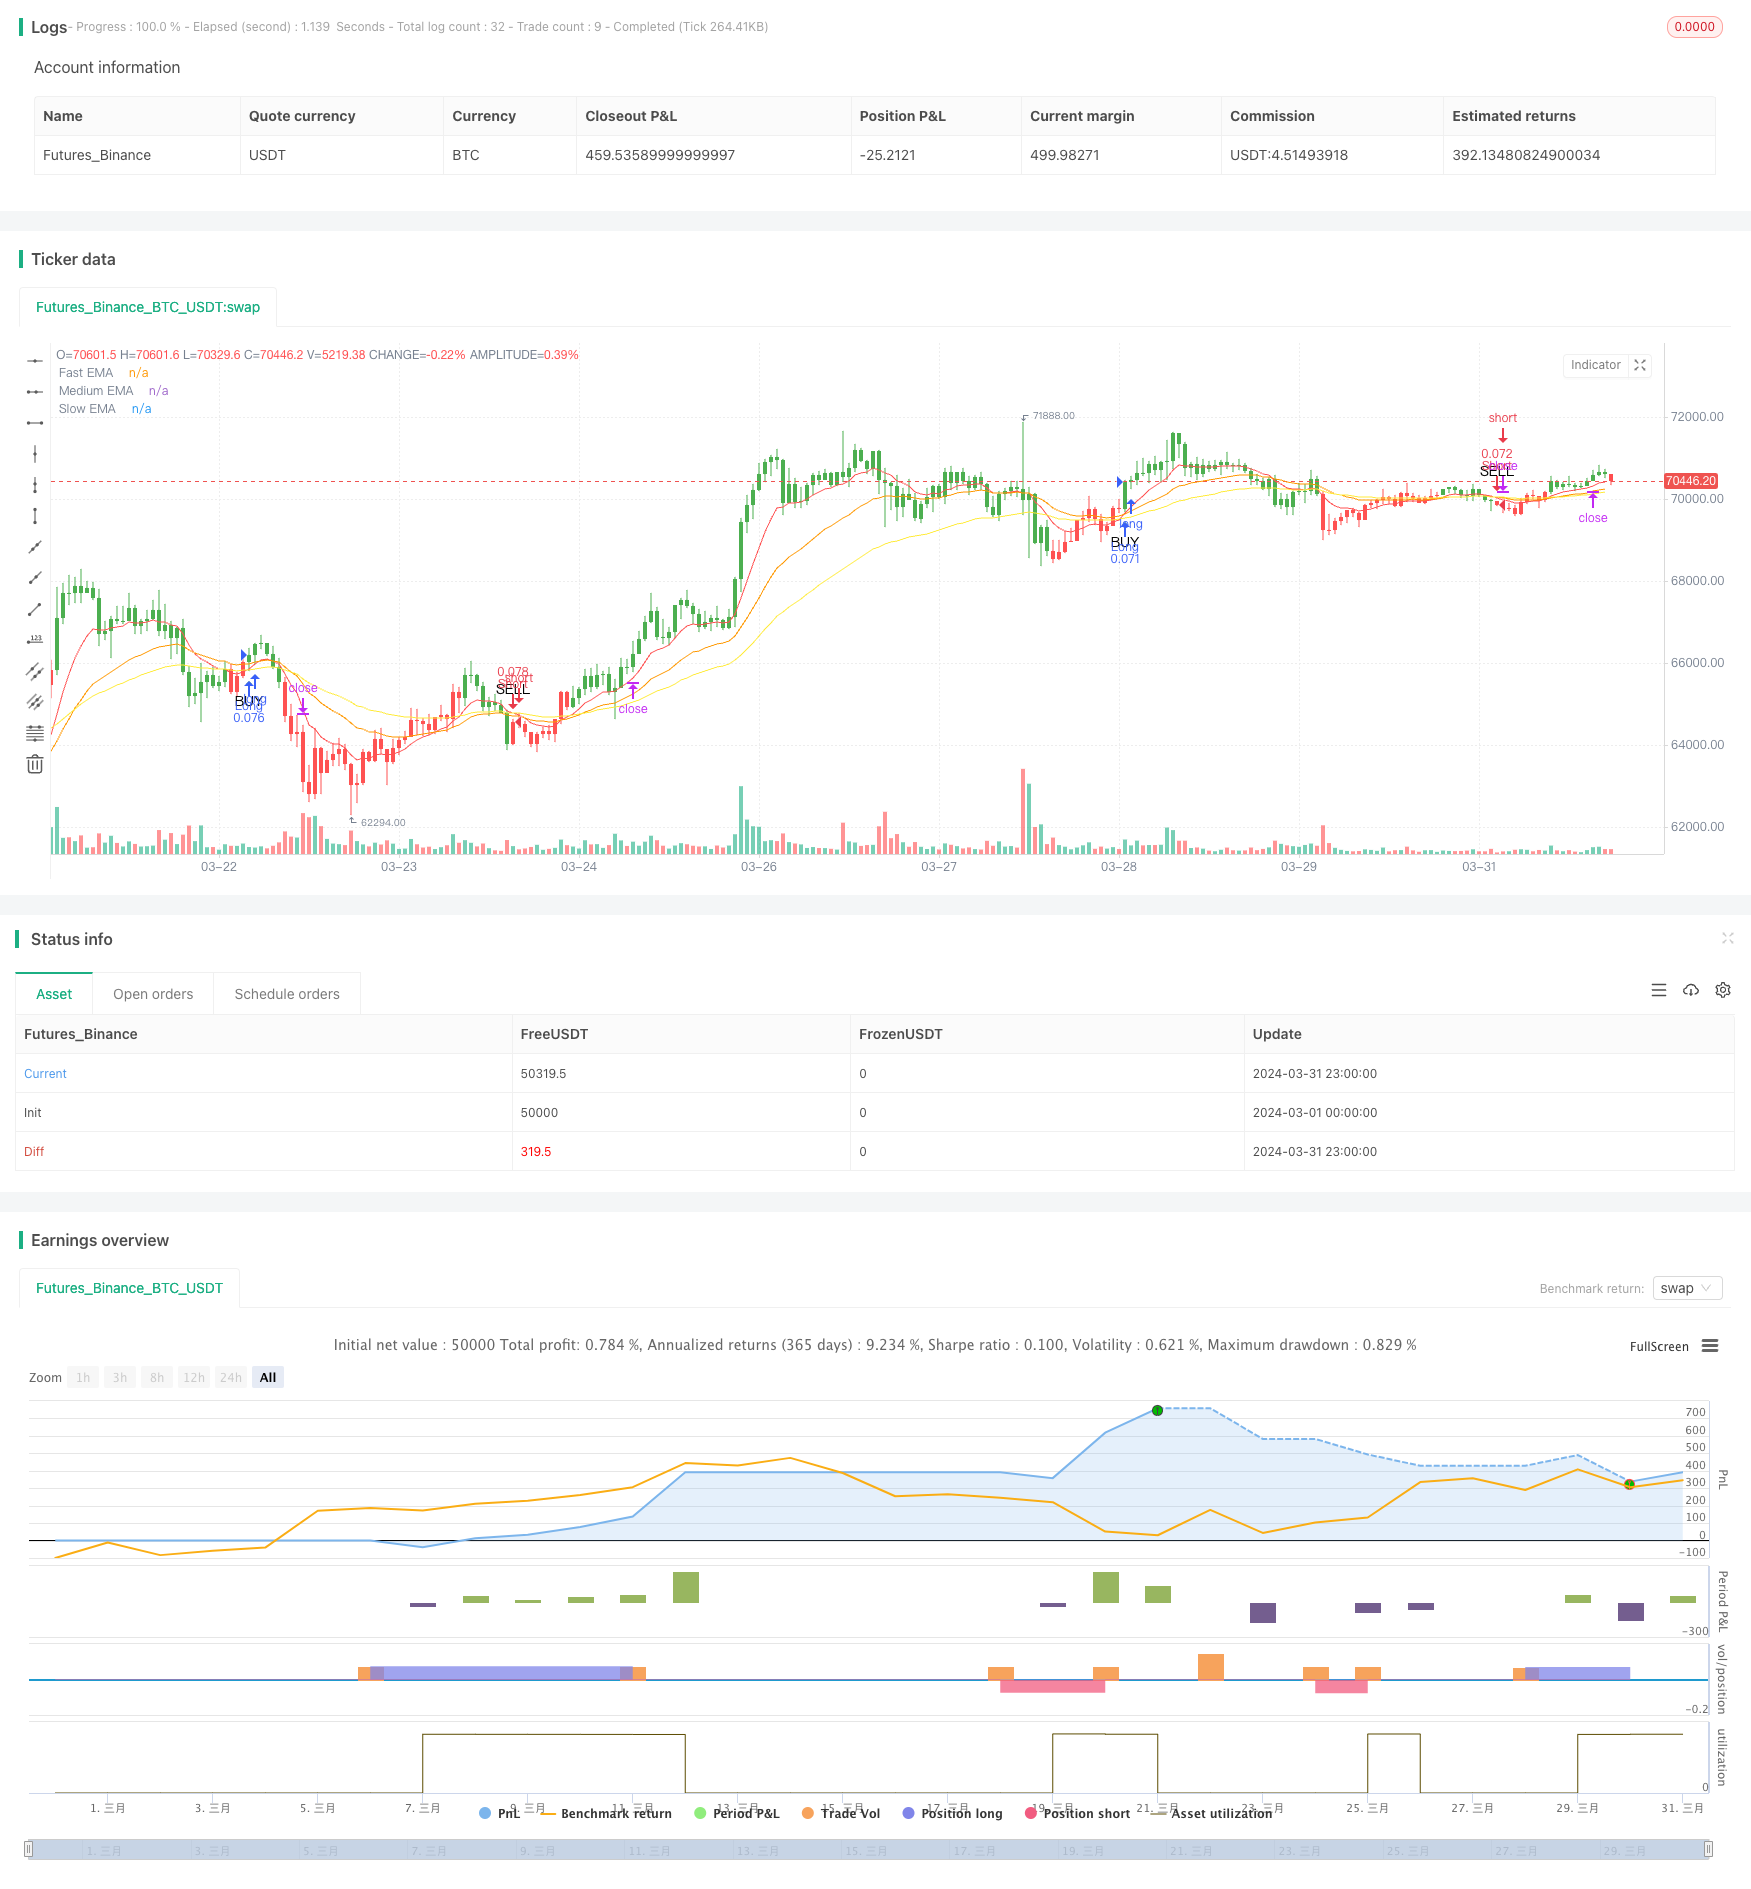
개요
트리플 EMA 크로스 전략은 3개의 서로 다른 주기의 지수 이동 평균 (EMA) 크로스 신호를 기반으로 거래하는 전략이다. 이 전략은 빠른 EMA (10기), 중간 EMA (25기) 및 느린 EMA (50기) 를 사용하여 시장 추세를 포착하고, 평균 실제 파도 (ATR) 를 사용하여 다른 시장 변동 상황에 맞게 중지 및 중지 수준을 설정한다. 빠른 EMA가 느린 EMA 위를 가로질러 있고, 중간 EMA도 느린 EMA 위를 가로질러면, 시선 신호가 발생한다. 반대로, 빠른 EMA가 느린 EMA 아래를 가로질러 있고, 중간 EMA도 느린 EMA 아래를 가로질러면, 시선 신호가 발생한다.
전략 원칙
- 세 개의 다른 주기의 EMA를 계산한다: 빠른 (기기 10), 중간 (기기 25), 그리고 느린 (기기 50) [2].
- 빠른 EMA가 낮은 EMA를 상단으로 가로질러 있고, 중간 EMA가 느린 EMA 위에 있을 때, 보 교차 신호가 발생한다.
- 빠른 EMA가 느린 EMA를 위아래로 가로질러 있고, 중간 EMA가 느린 EMA 아래로 있을 때, 하향 교차 신호가 발생한다.
- ATR을 사용하여 동적 스톱 손실과 스톱 레벨을 계산합니다. 스톱 손실은 ATR의 3배이고 스톱 스톱은 ATR의 6배입니다.
- 의 교차 신호가 나타나면, 더 많이 내리고, 스톱로즈와 스톱을 설정한다.
- 하락의 교차 신호가 나타났을 때, 포지션을 공백하고, 스톱 손실과 스톱 을 설정하십시오.
전략적 이점
- 트리플 EMA 크로스 전략은 시장 소음을 효과적으로 필터링하여 주요 트렌드를 포착하는 데 집중합니다.
- 다른 주기의 EMA를 사용함으로써, 이 전략은 가격 변화에 더 빠르게 반응할 수 있으며, 중장기적 추세에 대한 신호가 뒷받침되는 것을 보장합니다.
- ATR을 사용하여 스톱 및 스톱 레벨을 동적으로 조정하여 전략이 다양한 시장 변동 상황에 적응할 수 있도록하고 위험 관리의 효율성을 향상시킵니다.
전략적 위험
- 불안정하거나 높은 변동성이 있는 시장에서 이 전략은 잘못된 신호를 발생시킬 수 있으며, 이는 빈번한 거래와 잠재적인 손실을 초래할 수 있다.
- 전략의 성능은 EMA 주기의 선택에 크게 의존하며, 부적절한 매개 변수 설정으로 신호 품질이 떨어질 수 있다.
- 이동 평균 교차 신호만으로는 전체적인 시장 분석을 할 수 없으며, 다른 기술 지표와 결합하여 트렌드와 신호를 확인해야 합니다.
전략 최적화 방향
- 다른 기술적인 지표들을 도입하는 것을 고려하십시오. 상대적으로 강한 지표 (RSI) 또는 무작위적인 지표 (Stochastic) 를 도입하여 트렌드 및 교차 신호의 유효성을 확인하십시오.
- 다양한 시장 상황과 자산 클래스에 대한 변수 최적화 테스트를 수행하여 최적의 EMA 주기 조합과 ATR 배수 설정을 찾습니다.
- 시장의 변동성에 따라 포지션 크기를 조정하거나 특정 시장 조건에서 거래를 중단하는 등의 위험 관리 조치를 도입하여 위험을 더욱 통제하십시오.
요약하다
트리플 EMA 크로스 전략은 ATR의 동적 스톱 및 스톱 설정과 결합하여 다양한 주기의 지수 이동 평균 크로스 신호를 활용하여 트렌드 추적 및 위험 관리의 효과적인 방법을 제공합니다. 이 전략은 트렌드 시장에서 잘 작동하지만, 격변 시장에서 도전을받을 수 있습니다. 따라서, 거래자는 다른 기술 분석 도구와 결합하여 다양한 시장 상황과 자산 클래스의 매개 변수를 최적화하여 전략의 신뢰성과 수익 가능성을 높이는 것을 고려해야합니다.
전략 소스 코드
/*backtest
start: 2024-03-01 00:00:00
end: 2024-03-31 23:59:59
period: 1h
basePeriod: 15m
exchanges: [{"eid":"Futures_Binance","currency":"BTC_USDT"}]
*/

//@version=5
strategy("Triple EMA Crossover Strategy", overlay=true, default_qty_type=strategy.percent_of_equity, default_qty_value=10)

// Input for EMA periods
fastLength = input(10, title="Fast EMA Length")
mediumLength = input(25, title="Medium EMA Length")
slowLength = input(50, title="Slow EMA Length")
riskMultiplier = input(3.0, title="Risk Multiplier for Stop Loss and Take Profit")

// Calculating EMAs
fastEMA = ta.ema(close, fastLength)
mediumEMA = ta.ema(close, mediumLength)
slowEMA = ta.ema(close, slowLength)

// Plot EMAs
plot(fastEMA, color=color.red, title="Fast EMA")
plot(mediumEMA, color=color.orange, title="Medium EMA")
plot(slowEMA, color=color.yellow, title="Slow EMA")

// Define the crossover conditions for a bullish and bearish signal
bullishCrossover = ta.crossover(fastEMA, slowEMA) and mediumEMA > slowEMA
bearishCrossover = ta.crossunder(fastEMA, slowEMA) and mediumEMA < slowEMA

// ATR for stop and limit calculations
atr = ta.atr(14)
longStopLoss = close - atr * riskMultiplier
shortStopLoss = close + atr * riskMultiplier
longTakeProfit = close + atr * riskMultiplier * 2
shortTakeProfit = close - atr * riskMultiplier * 2

// Entry signals with visual shapes
plotshape(series=bullishCrossover, location=location.belowbar, color=color.green, style=shape.triangleup, title="Buy Signal", text="BUY")
plotshape(series=bearishCrossover, location=location.abovebar, color=color.red, style=shape.triangledown, title="Sell Signal", text="SELL")

// Strategy execution
if (bullishCrossover)
    strategy.entry("Long", strategy.long)
    strategy.exit("Exit Long", "Long", stop=longStopLoss, limit=longTakeProfit)

if (bearishCrossover)
    strategy.entry("Short", strategy.short)
    strategy.exit("Exit Short", "Short", stop=shortStopLoss, limit=shortTakeProfit)

// Color bars based on EMA positions
barcolor(fastEMA > slowEMA ? color.green : slowEMA > fastEMA ? color.red : na, title="Bar Color")