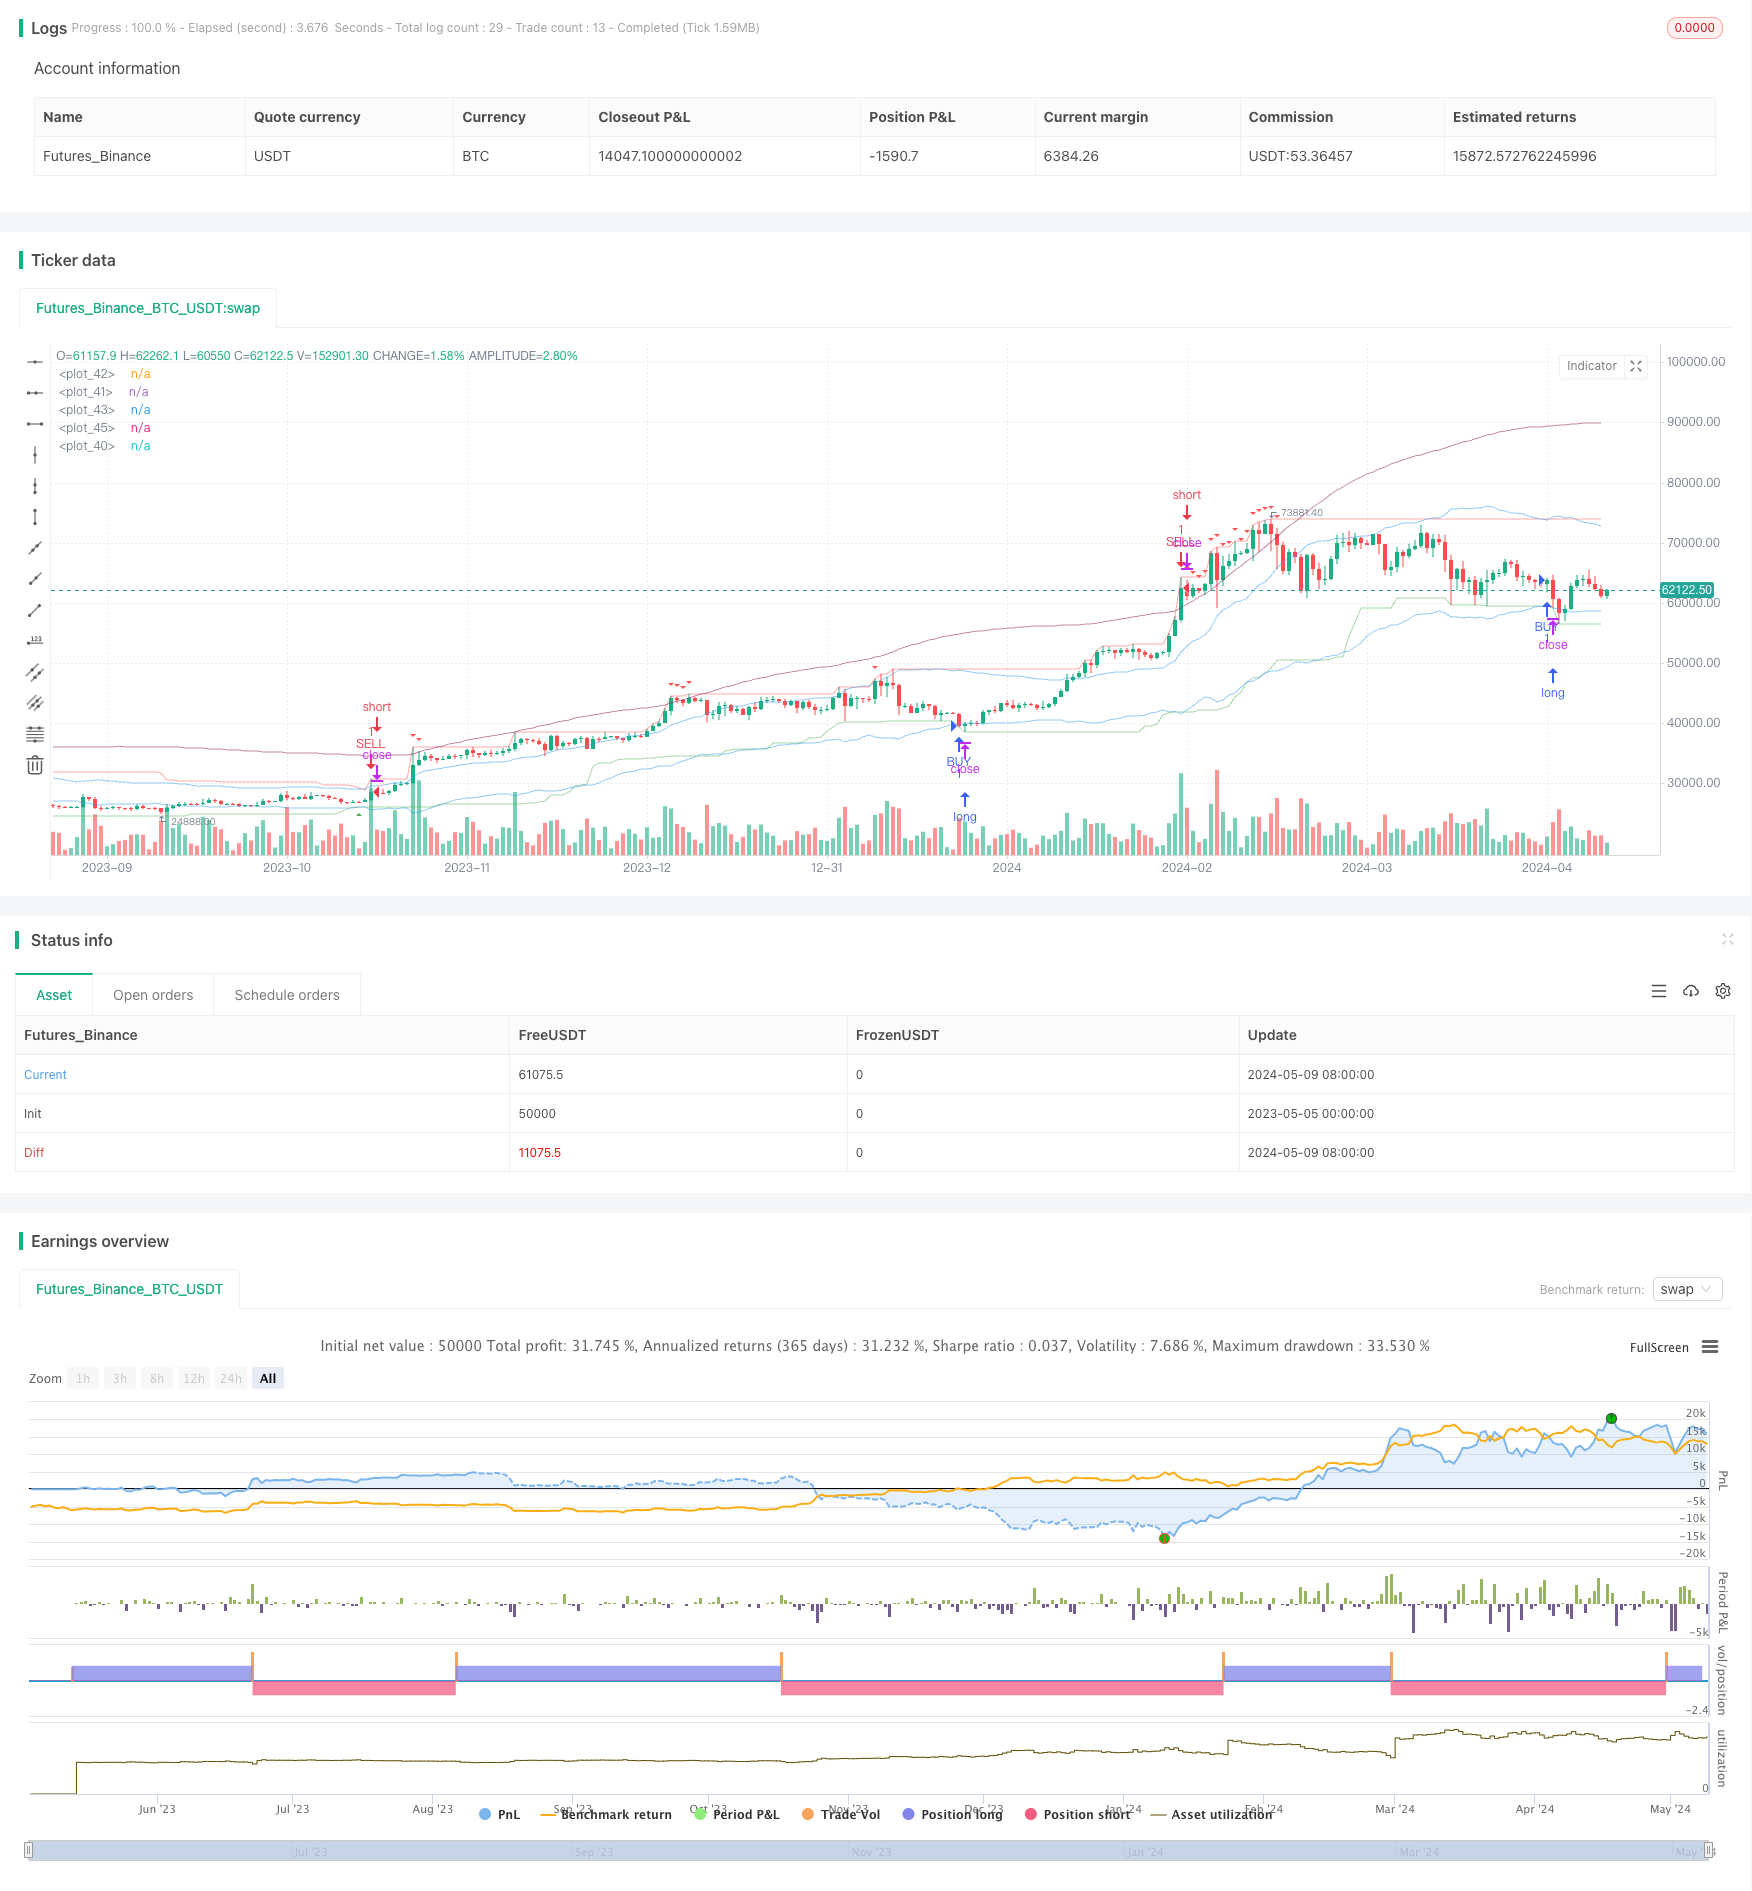
간략한 설명
이 전략은 지수 이동 평균 ((EMA), 최고 가격, 최저 가격 및 평균 실제 파장 ((ATR) 과 같은 기술 지표를 사용하여 가격과 EMA, 최고 가격 및 최저 가격의 관계를 판단하여 현재 트렌드 방향을 식별하고, 상향으로 최저 가격을 돌파 할 때 구매하고, 하향으로 최고 가격을 돌파 할 때 또는 동적 저항 지점에 도달하면 판매하여 트렌드 상황을 캡처하여 초과 수익을 얻습니다.
전략 원칙
- ATR을 계산하여 시장의 변동성을 측정하고 동적 통로를 구성하는 데 기초를 제공합니다.
- 최고 가격과 최저 가격을 계산하여 트렌드 방향을 판단합니다.
- 동적 통로의 중축으로 EMA_HL, 즉 최고 가격과 최저 가격의 EMA를 계산한다.
- EMA_HIGHEST과 EMA_LOWEST을 계산한다. 즉, EMA_HL의 기초에 ATR을 더하고 빼고 일정 비율로 얻은 상하철이다.
- SELL_LINE, 즉 최고 가격에 ATR을 더하여 일정 비율로 얻은 동적 저항 지점을 계산한다.
- 다단 신호를 판단: EMA_LOWEST가 상향으로 최저 가격을 돌파하고 EMA_MID보다 낮은 가격으로 종결하면 구매 신호를 발생시킨다.
- 공백 신호를 판단: EMA_HIGHEST가 상향 최고 가격을 돌파하고 EMA_MID보다 높은 마감 가격, 또는 최고 가격이 SELL_LINE을 만질 때 판매 신호를 생성한다.
전략적 우위
- EMA, 최고 가격, 최저 가격 등 지표의 통합 판단 경향을 이용한 신호 신뢰도가 높다.
- ATR을 도입하여 변동률을 측정하는 표준으로, 다양한 시장 상황에 적응하는 동적 통로를 구축한다.
- SELL_LINE 동적 저항치를 설정하여 수익을 적시에 잠금하고 철회 위험을 제어하십시오.
- 매개 변수는 조정 가능하며, 다양한 품종과 주기에 적합하며, 어느 정도 보편성과 유연성을 갖는다.
전략적 위험
- 트렌드 인식이 늦어지고 있기 때문에 입국이 시기가 좋지 않을 수 있습니다.
- 잘못된 매개 변수 설정은 신호의 빈도를 높여 거래 비용을 증가시킬 수 있다.
- 위기 시장의 경우, 전략이 좋지 않을 수 있으며, 다른 방법과 결합하여 판단해야 합니다.
- 급격한 변동과 같은 극단적인 상황에서는 전략이 실패할 수 있으며, 스톱로스가 설정되어야 합니다.
전략 최적화 방향
- 거래량, 변동률 등과 같은 더 많은 지표를 도입하여 트렌드 판단 차원을 풍부하게하고 신호 신뢰성을 향상시킵니다.
- ATR 배수, EMA 주기 등과 같은 변수를 최적화하여 최적의 변수 조합을 찾아 전략 안정성을 높인다.
- 포지션 관리에 참여, 예를 들어 ATR 동적으로 포지션을 조정, 단일 리스크 을 제어.
- 단위 최대 손실과 최대 수익을 제어하고, 리스크 수익률을 높이기 위해 스톱 로즈와 스톱 스을 설정합니다.
- 다른 전략과 결합하여 전략 포트폴리오를 형성하여 전체적인 안정성을 향상시킵니다.
결론
이 전략은 EMA, 최고 가격, 최저 가격 등의 기술 지표를 활용하여 ATR과 결합하여 동적 통로를 구축하여 최고 가격과 최저 가격을 돌파하여 거래 신호를 생성하여 트렌드 움직임을 포착하는 간단한 실용적인 트렌드 추적 전략입니다. 전략의 매개 변수는 조정 가능하며 적응성과 유연성이 좋습니다. 그러나 불안한 시장에서 성능이 좋지 않을 수 있습니다. 더 많은 지표, 최적화 매개 변수, 풍속 제어 등을 도입하여 추가 최적화 및 개선이 필요합니다.
전략 소스 코드
/*backtest
start: 2023-05-05 00:00:00
end: 2024-05-10 00:00:00
period: 1d
basePeriod: 1h
exchanges: [{"eid":"Futures_Binance","currency":"BTC_USDT"}]
*/

// This Pine Script™ code is subject to the terms of the Mozilla Public License 2.0 at https://mozilla.org/MPL/2.0/
// © Maboi_q

//@version=5
strategy("buy sell Trend", overlay=true)

atr_length = input.int(defval=14, title='atr length')
highest_length = input.int(defval=60, title='highest length')
highest_s_length = input.int(defval=60, title='sell highest length')
lowest_length = input.int(defval=30, title='lowest length')
sell_l_length = input.int(defval=55, title='sell line length')

f = 2.382
f2 = 5.618

atr = ta.atr(atr_length)
highest = ta.highest(highest_length)
lowest = ta.lowest(lowest_length)

f_atr = atr * f
ema_hl = ta.ema((highest[1] + lowest[1]) / 2, 14)
ema_highest = ema_hl + f_atr
ema_lowest = ema_hl - f_atr
ema_mid = (ema_highest + ema_lowest) / 2

bs_hi = ta.highest(highest_s_length)
f_atr2 = atr * f2
sell_line = ta.ema(bs_hi[1] + f_atr2, sell_l_length)

buy_cond = ta.crossover(ema_lowest, lowest) and close < ema_mid
sell_cond = (ta.crossunder(ema_highest, highest) and close > ema_mid) or high >= sell_line

if buy_cond
    strategy.entry('BUY', strategy.long)

if sell_cond
    strategy.entry('SELL', strategy.short)


plot(sell_line, color=color.new(color.maroon, 50))
plot(highest, color=color.new(color.red, 50))
plot(lowest, color=color.new(color.green, 50))
plot(ema_highest, color=color.new(color.blue, 50))
// plot(ema_mid, color=color.new(color.gray, 50))
plot(ema_lowest, color=color.new(color.blue, 50))

plotshape(buy_cond, title='buy', style=shape.triangleup, location=location.belowbar,
 color=color.green, textcolor=color.green, size=size.tiny)

plotshape(sell_cond, title='sell', style=shape.triangledown, location=location.abovebar,
 color=color.red, textcolor=color.red, size=size.tiny)