개요
이 전략의 주요 아이디어는 구매 신호로 상위 지표가 없는 보이스 K 라인을 찾고, 가격이 K 라인 최저점 1개를 넘어갈 때 청산한다. 이 전략은 보이스 K 라인 상위 지표가 작다는 특징을 활용하여 다자력이 강하고, 주가가 계속 상승할 확률이 높다는 것을 나타냅니다. 동시에, 상위 K 라인 최저점 1개가 손실 지점으로, 위험을 효과적으로 제어 할 수 있습니다.
전략 원칙
- 현재 K 선이 투기 K 선인지 판단하기 (폐쇄 가격이 개시 가격보다 높다)
- 현재 K 선의 유도 길이가 K 선의 개체 길이의 비율을 계산한다.
- 만약 상부 리드 비율이 5% 미만이라면, 유효한 상부 리드 없이 K선으로 보고, 구매 신호를 발산한다
- 구매 후 K 라인의 최저값을 스톱 로즈로 기록합니다.
- 가격이 스톱로스를 넘어서면 평점으로 빠져나갑니다.
전략적 이점
- 상위 유도 없이 K선으로 입점하면, 트렌드 강도가 높고 성공률이 높습니다.
- 이전 K선 하위점을 스톱 로프로 사용하여 위험을 조절할 수 있습니다.
- 논리적으로 간단하고, 실행 및 최적화하기 쉽습니다.
- 트렌드 상황에서의 사용에 적합하다
전략적 위험
- 구매 신호를 받은 후 즉각적으로 상환되는 경우도 있을 수 있습니다.
- 변동성이 높은 품종의 경우, 중지 값이 구매 가격에 너무 가깝게 설정되어 조기 중단으로 이어질 수 있습니다.
- 이윤 목표가 없고, 가장 좋은 시점을 파악하기 힘들다.
전략 최적화 방향
- MA, MACD 등과 다른 지표와 결합하여 트렌드 강도를 확인하여 입시 신호의 효과를 높일 수 있습니다.
- 높은 파동의 품종을 위해, N-뿌리 K 선의 최저 지점과 같은 더 먼 위치에 스톱 지점을 설정하여 스톱 주파수를 줄일 수 있습니다.
- N배 ATR 또는 수익률과 같은 수익 목표를 도입하여 적시에 수익을 고정합니다.
- 포지션 관리, 예를 들어 신호 강도에 따라 포지션 크기를 조정하는 등
요약하다
이 전략은 상위 유도 없이 K 라인을 선택하여 상위 K 라인을 선택하여 전 K 라인의 낮은 지점을 이용하여 트렌드 상황에서 수익을 효과적으로 캡처 할 수 있습니다. 그러나 전략에는 제한이 있습니다. 예를 들어, 중지 위치가 유연하지 않으며, 수익 목표가 없습니다. 다른 지표의 필터링 신호를 도입하여, 중지 위치 및 수익 목표 설정을 최적화하여 전략을 더 안정적으로 효율적으로 개선 할 수 있습니다.
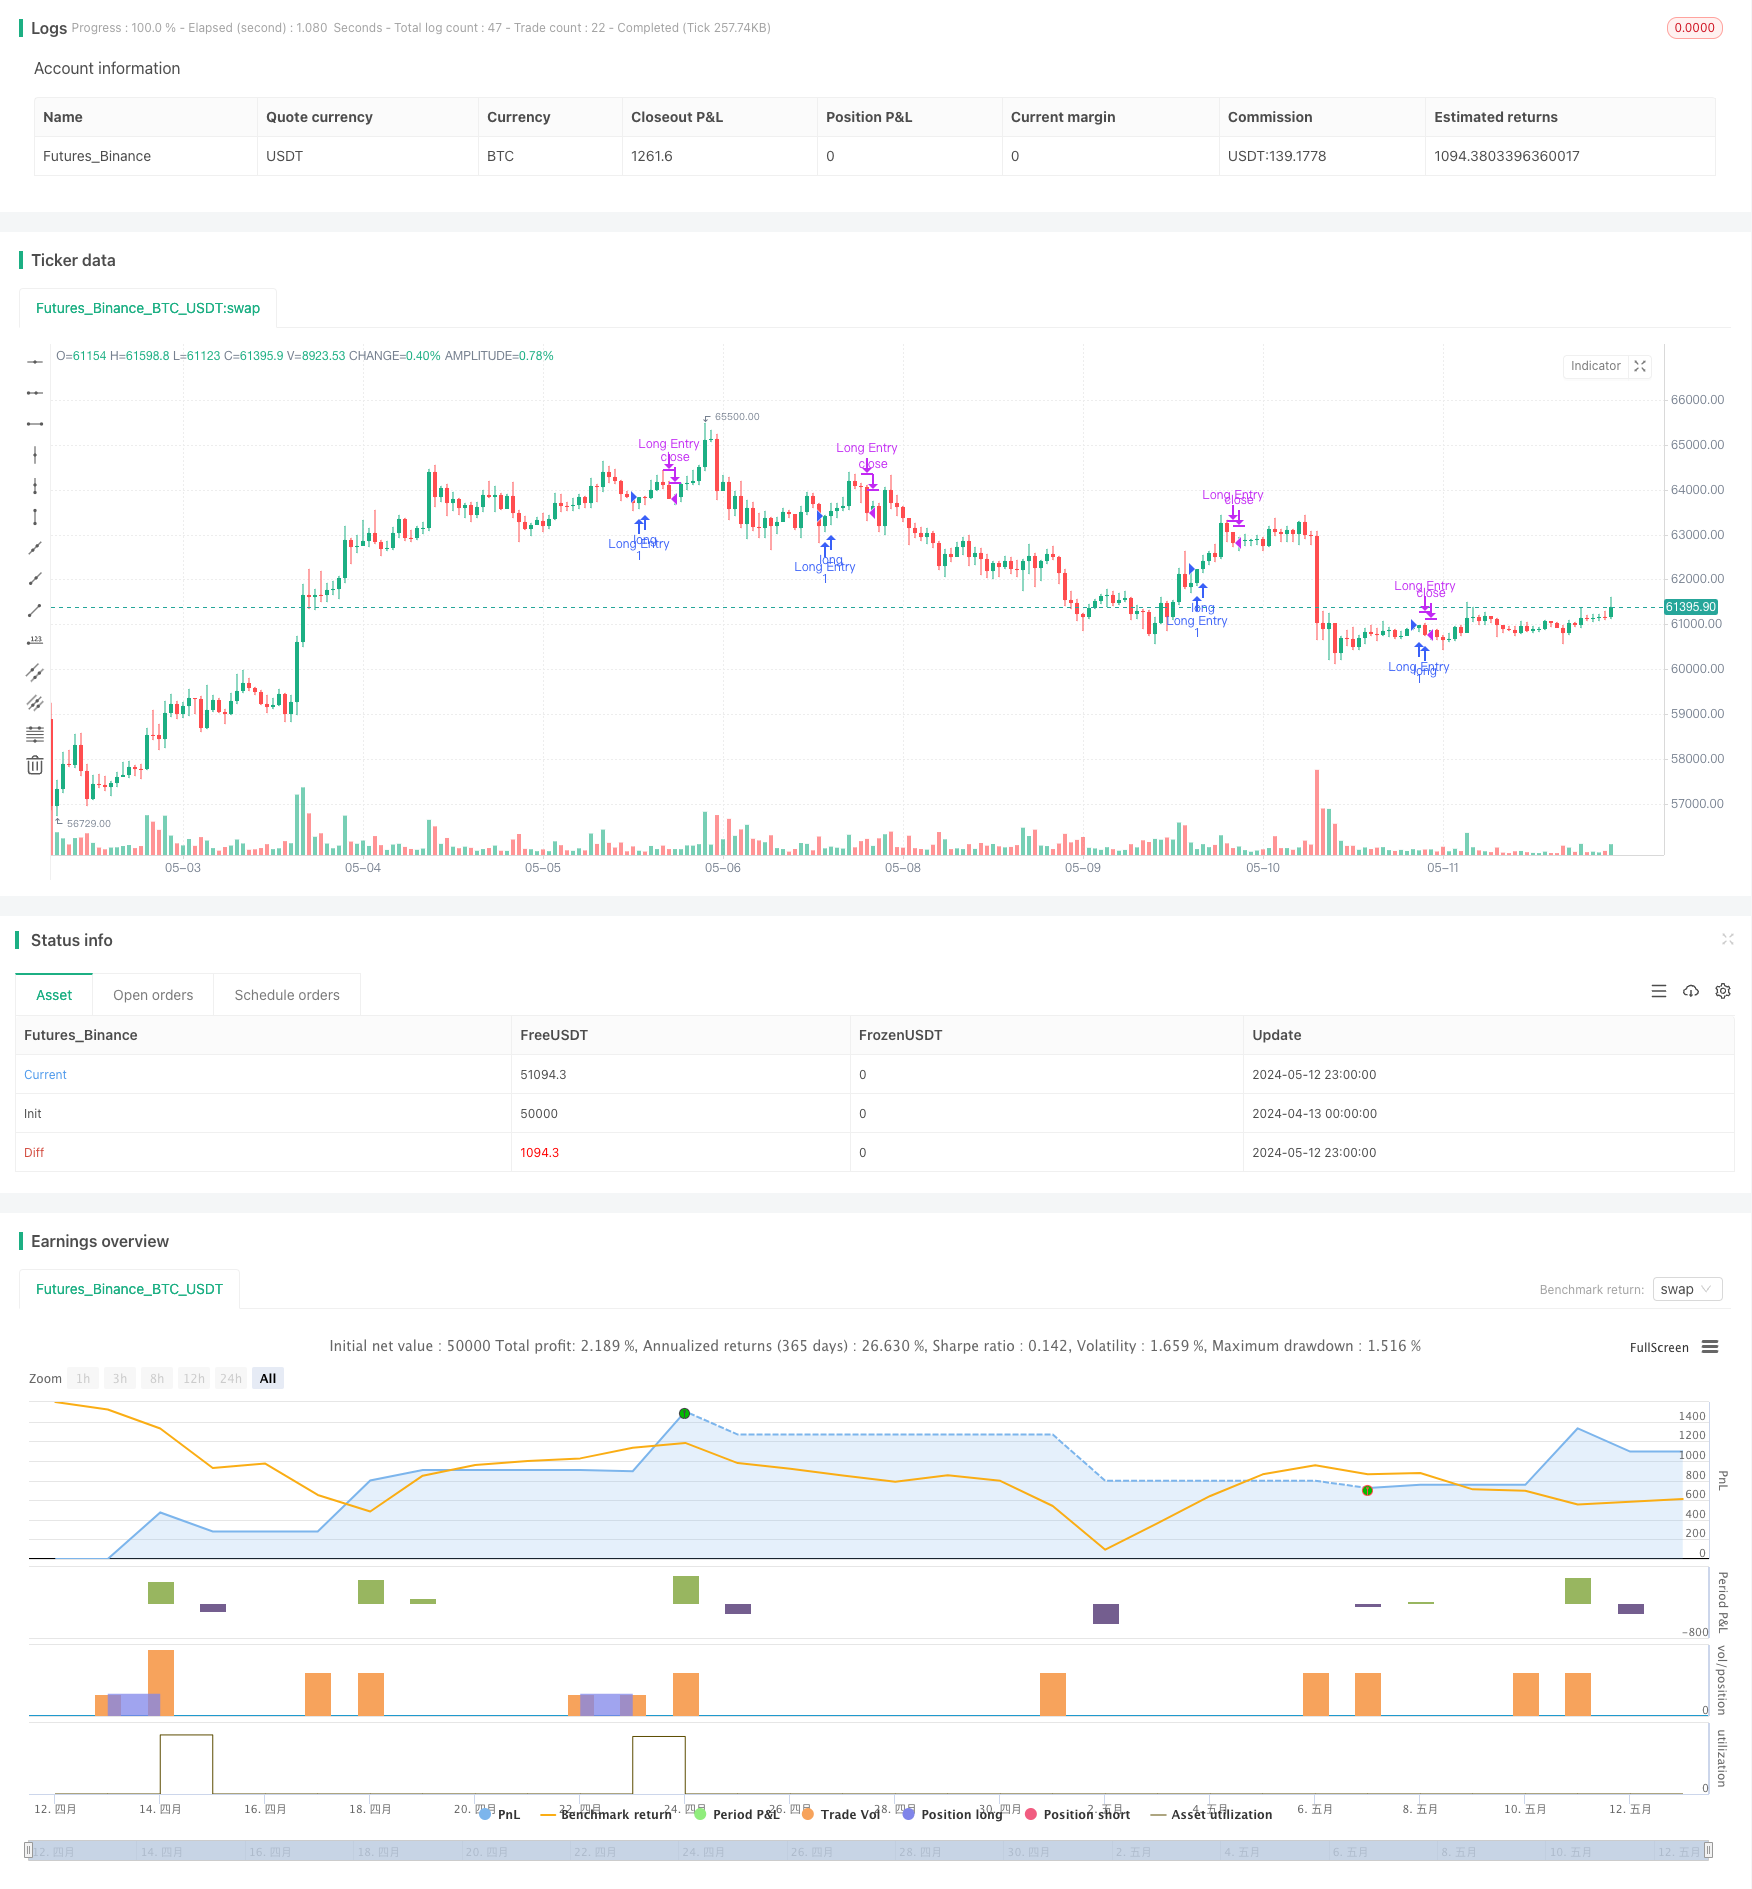
Overview
The main idea of this strategy is to find bullish candles without upper wicks as buy signals and close positions when the price breaks below the low of the previous candle. The strategy utilizes the characteristic of bullish candles with very small upper wicks, indicating strong bullish momentum and a higher probability of continued price increases. At the same time, using the low of the previous candle as a stop-loss level can effectively control risk.
Strategy Principles
- Determine if the current candle is a bullish candle (close price higher than open price)
- Calculate the ratio of the current candle’s upper wick length to its body length
- If the upper wick ratio is less than 5%, consider it a valid bullish candle without an upper wick and generate a buy signal
- Record the lowest price of the previous candle after buying as the stop-loss level
- When the price breaks below the stop-loss level, close the position and exit
Strategy Advantages
- Selecting bullish candles without upper wicks for entry, the trend strength is greater and the success rate is higher
- Using the low of the previous candle as the stop-loss level, risks are controllable
- Simple logic, easy to implement and optimize
- Suitable for use in trending markets
Strategy Risks
- There may be cases where a buy signal is followed by an immediate pullback triggering the stop-loss
- For highly volatile instruments, the stop-loss level may be set too close to the buy price, leading to premature stop-outs
- Lack of profit targets, making it difficult to grasp the optimal exit timing
Strategy Optimization Directions
- Combine with other indicators such as MA, MACD, etc., to confirm trend strength and improve the effectiveness of entry signals
- For highly volatile instruments, set the stop-loss level at a further position, such as the lowest point of the previous N candles, to reduce the stop-loss frequency
- Introduce profit targets, such as N times ATR or percentage gains, to lock in profits in a timely manner
- Consider adding position management, such as adjusting position size based on signal strength
Summary
This strategy captures profits effectively in trending markets by selecting bullish candles without upper wicks for entry and using the low of the previous candle for stop-loss. However, the strategy also has certain limitations, such as inflexible stop-loss placement and lack of profit targets. Improvements can be made by introducing other indicators to filter signals, optimizing stop-loss positions, and setting profit targets to make the strategy more robust and effective.
/*backtest
start: 2024-04-13 00:00:00
end: 2024-05-13 00:00:00
period: 1h
basePeriod: 15m
exchanges: [{"eid":"Futures_Binance","currency":"BTC_USDT"}]
*/

// This Pine Script™ code is subject to the terms of the Mozilla Public License 2.0 at https://mozilla.org/MPL/2.0/
// © nagpha

//@version=5
strategy("My strategy", overlay=true, margin_long=100, margin_short=100)

candleBodySize = math.abs(open - close)

// Calculate candle wick size
candleWickSize = high - close

// Calculate percentage of wick to candle body
wickPercentage = (candleWickSize / candleBodySize) * 100

// Check if candle is bullish and wick is less than 1% of the body
isBullish = close > open
isWickLessThan5Percent = wickPercentage < 5


longCondition = isBullish and isWickLessThan5Percent

if (longCondition)
    // log.info("long position taken")
    strategy.entry("Long Entry", strategy.long)

float prevLow = 0.0
prevLow := request.security(syminfo.tickerid, timeframe.period, low[1], lookahead=barmerge.lookahead_on)

float closingPrice = close
//plot(closingPrice, "Close Price", color.purple, 3)
//plot(prevLow, "Previous Low", color.red, 3)
//log.info("Outside: {0,number,#}",closingPrice)
//log.info("Outside: {0,number,#}",prevLow)

if closingPrice < prevLow and strategy.position_size > 0
    //log.info("inside close: {0,number} : {0,number}",closingPrice,prevLow)
    // log.info("position exited")
    strategy.close("Long Entry")
    longCondition := false
    prevLow := 0
    isBullish := false

//plot(series=strategy.position_size > 0 ? prevLow : na, color = color.new(#40ccfb,0), style=plot.style_cross,linewidth = 5)