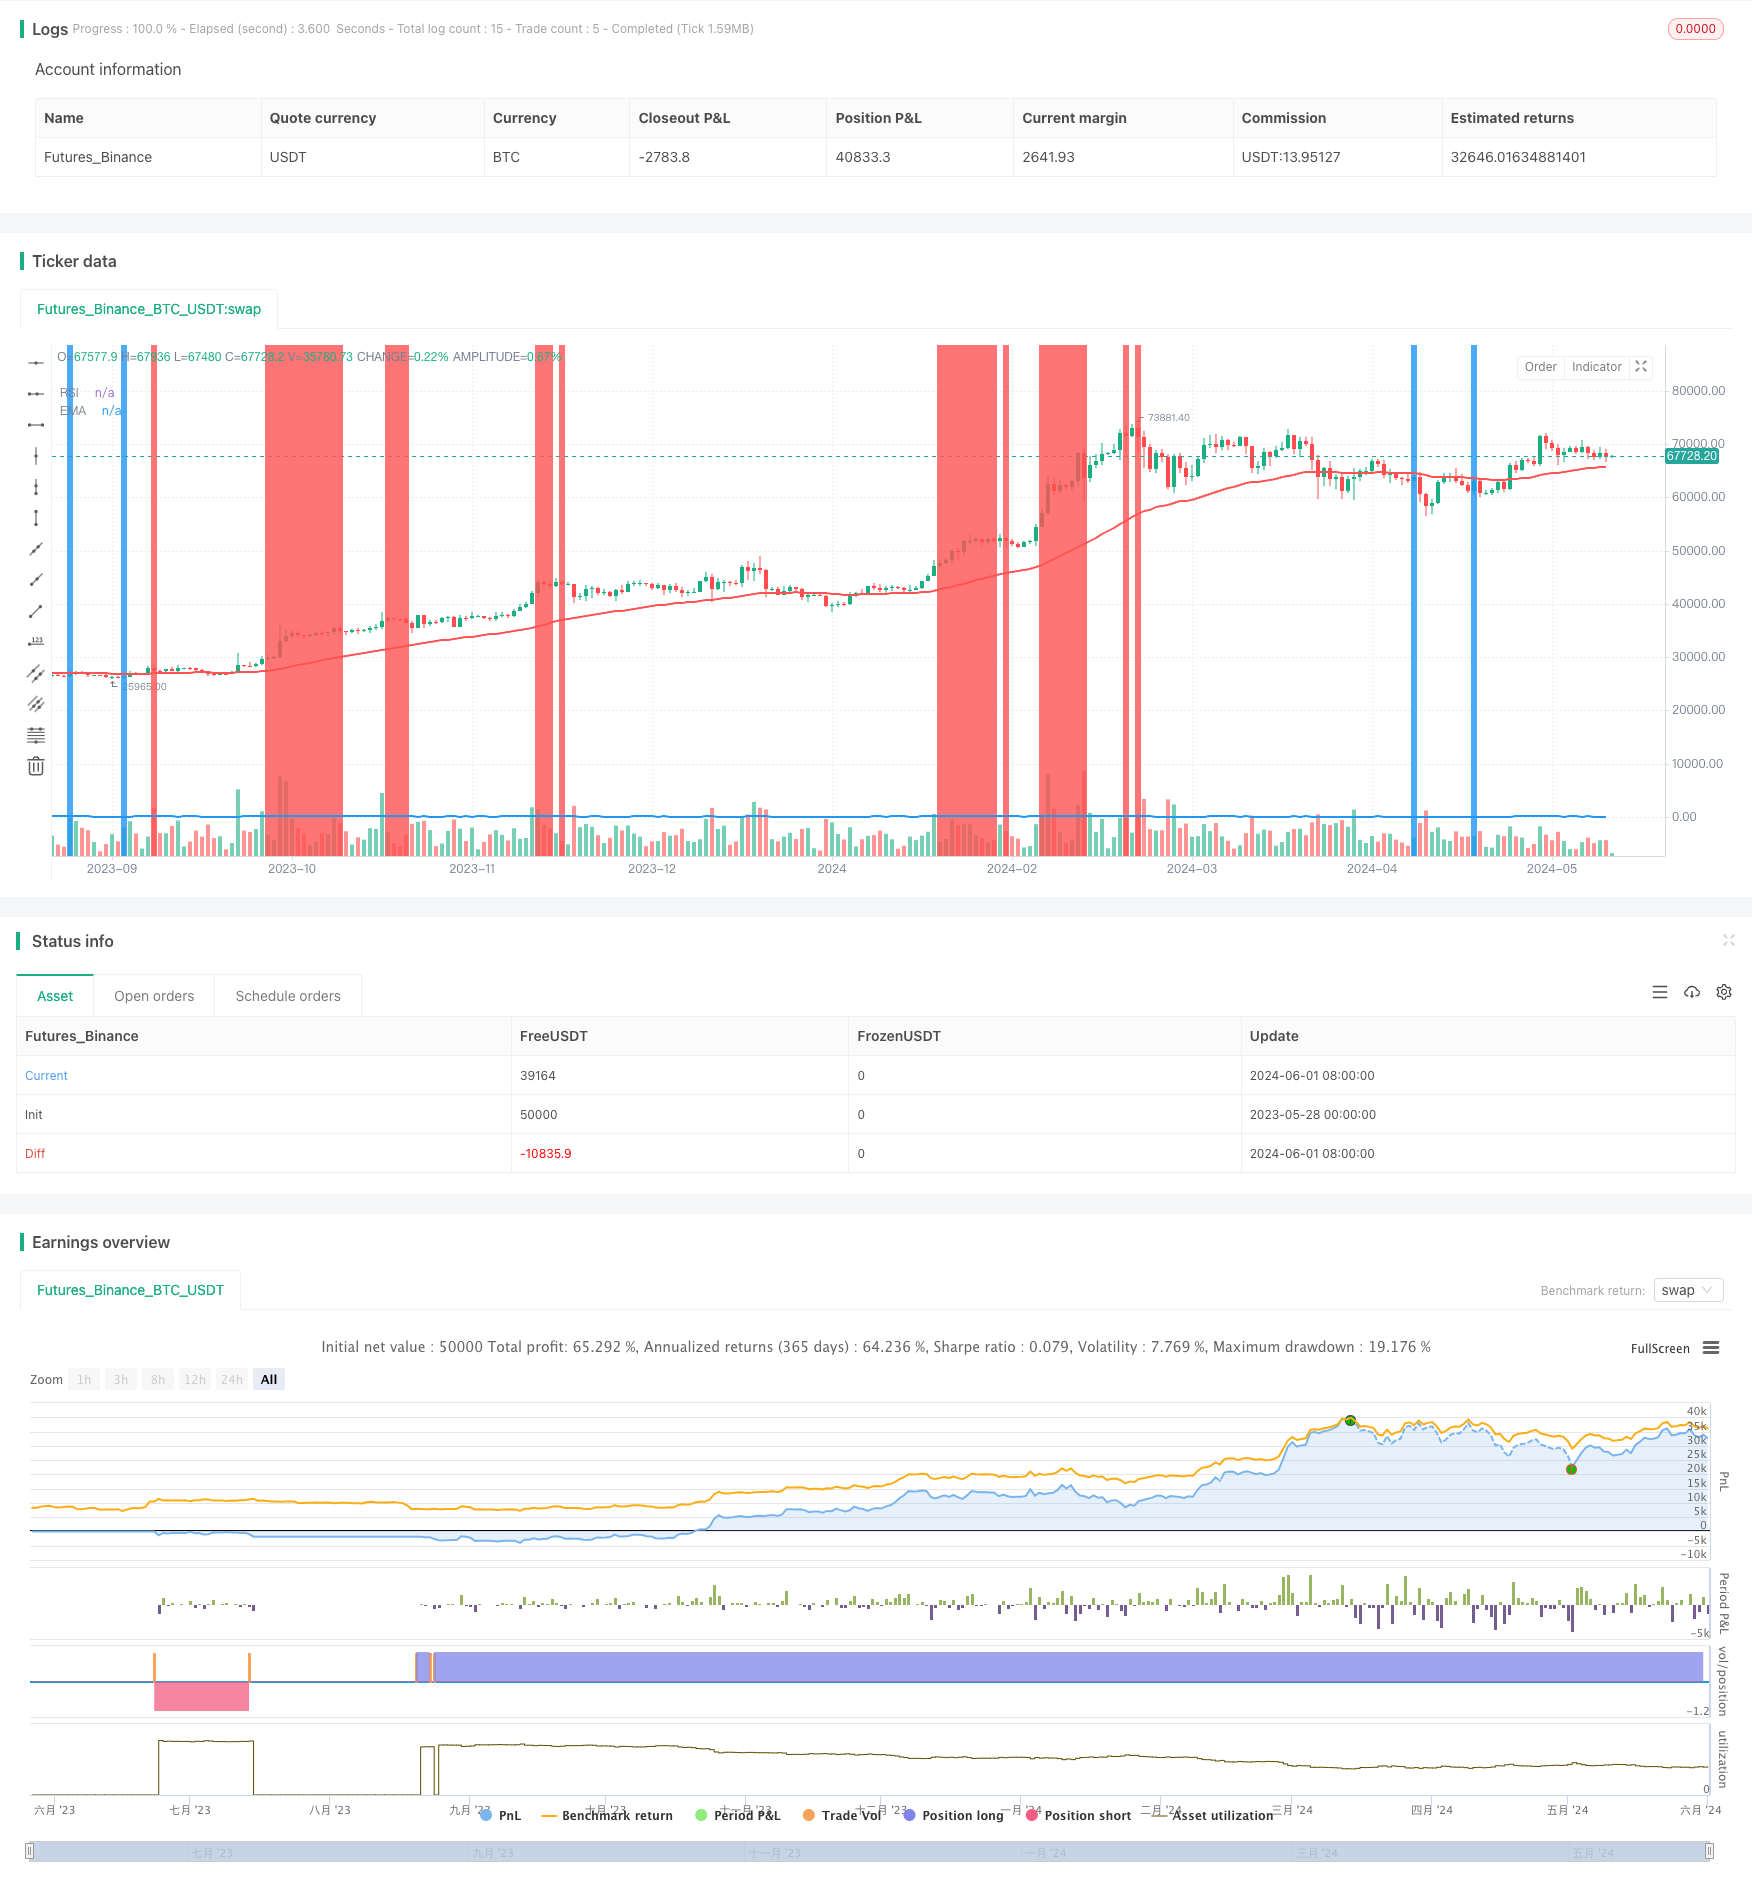
개요
EMA와 RSI의 교차전략은 지수 이동 평균 (EMA) 과 상대적으로 강한 지수 (RSI) 의 두 가지 기술 지표를 결합하여 잠재적인 구매 또는 판매 신호를 식별합니다. EMA와 RSI가 교차 할 때, 시장의 움직임이 변할 수 있음을 나타냅니다. 예를 들어, 짧은 기간의 EMA에서 더 긴 기간의 EMA를 통과하고 RSI에서 한 값을 통과하면 상승 추세가 발생할 수 있음을 나타냅니다.
전략 원칙
- 지정된 주기의 RSI 지표값을 계산하고, 그래프에 그려집니다.
- 지정된 주기 동안의 EMA 지표값을 계산하고, 그래프에 그려진다.
- 가격이 EMA보다 낮고 RSI가 20보다 작으면 구매 신호로 간주하고, 가격이 EMA보다 높고 RSI가 80보다 크면 판매 신호로 간주합니다.
- 구매 신호가 발생하고 현재 라인 종료 가격이 이전 라인보다 높을 때, 더 많은 포지션을 열고; 판매 신호가 발생하고 현재 라인 종료 가격이 이전 라인보다 낮을 때, 포지션을 공백하십시오.
- 평균 실제 변동량을 사용하여[…] ATR) 를 사용하여 스톱 로즈와 스톱 가격을 계산하십시오. 스톱 로즈가 포지션 개시 가격으로 적당하다[…] ATR+ 라인 엔티티 길이), 스톱 가격이 포지션 개시 가격으로 더된다[…] 1.2*(ATR+선 엔티티 길이))
전략적 이점
- 트렌드 추적 지표인 EMA와 동력 지표인 RSI를 결합하여 시장의 흐름을 보다 포괄적으로 판단할 수 있다.
- 트렌드 형성 초기에 거래 신호를 발산하여 트렌드 기회를 빨리 잡을 수 있습니다.
- ATR을 사용하여 스톱로즈와 스톱로즈 거리를 동적으로 조정하여 시장의 변동에 더 잘 적응 할 수 있습니다.
- 가격과 지표의 위치 관계와 라인의 형태를 고려하면서 신호의 신뢰성을 높였다.
전략적 위험
- EMA와 RSI 지표는 모두 약간의 지연성을 가지고 있으며, 지표가 교차하여 가격이 즉시 반전되지 않는 경우가 발생할 수 있으며, 이는 잘못된 신호로 이어집니다.
- RSI 지표는 불안한 시장에서 자주 교차 신호를 발생시키고, 과다 거래로 이어질 수 있다.
- 고정된 RSI 경계는 모든 시장 상황에 적용되지 않을 수 있으며 시장 특성에 따라 조정할 필요가 있습니다.
- 이 전략은 ATR의 H&L 계산에 크게 의존하지만, ATR의 값은 가격의 급격한 큰 변동에 의해 변질될 수 있다.
전략 최적화 방향
- EMA와 RSI의 변수를 최적화하여 현재 시장에 가장 적합한 변수 조합을 찾습니다.
- 위기 시장에는 거래량 변화, 변동성 등과 같은 다른 필터 조건이 추가되어 빈번한 가짜 신호를 필터링합니다.
- RSI의 상승과 하락은 다양한 시장 상황에 적응할 수 있도록 조정됩니다.
- 여러 가지 상쇄 및 중지 방법을 사용하십시오. 저항 지점을 지원하는 상쇄 상쇄 또는 트렌드 방향과 결합 된 이동 상쇄를 사용하여 위험 제어 능력을 향상하십시오.
- 포지션 관리 모듈을 추가하여 시장의 변동과 계정 위험 상태에 따라 각 거래의 포지션 크기를 동적으로 조정합니다.
요약하다
EMA와 RSI 교차 전략은 간단하고 사용하기 쉬운 트렌드 추적 전략으로, 트렌드와 동력의 두 차원의 지표를 결합하여 시장의 방향을 비교적으로 종합적으로 판단 할 수 있습니다. 동시에, 이 전략은 신호 품질과 위험 제어 능력을 향상시키기 위해 필터링 조건과 동적 스톱 스톱 방법을 사용합니다. 그러나, 이 전략에는 지표 지연, 빈번한 거래와 같은 몇 가지 제한이 있습니다. 따라서 실제 응용에서는 특정 시장 특성 및 개인 위험 선호에 따라 전략에 대한 추가 최적화 및 개선이 필요합니다.
전략 소스 코드
/*backtest
start: 2023-05-28 00:00:00
end: 2024-06-02 00:00:00
period: 1d
basePeriod: 1h
exchanges: [{"eid":"Futures_Binance","currency":"BTC_USDT"}]
*/

// This Pine Script™ code is subject to the terms of the Mozilla Public License 2.0 at https://mozilla.org/MPL/2.0/
// © pritom980

//@version=5
strategy("EMA RSI Cross", overlay=true, margin_long=100, margin_short=100)

// add RSI

rsi_period = input.int(7,"RSI Period")
rsi_val =  ta.rsi(close[1],rsi_period)
plot(rsi_val, color=color.blue, linewidth=2, title="RSI")

buyRsiFlag = rsi_val < 20
sellRsiFlag = rsi_val > 80

// add EMA
ema = ta.ema(close, 50)
plot(ema, color=color.red, linewidth=2, title="EMA")


// check buy

// buy when the price is below ema
buyFlag = ema > close ? true : false

// sell when the price is above ema
sellFlag = ema < close ? true : false


bgcolor(buyFlag and buyRsiFlag ? color.green : na )
bgcolor(sellFlag and sellRsiFlag ? color.red : na )


// Check if current candle's body is bigger than previous candle's body and of opposite color
is_body_bigger_long = math.abs(close - open) > math.abs(close[1] - open[1]) and close > open != close[1] > open[1]


greenCandle = close > close[1]
redCandle = close < close[1]
// Mark the candle
bgcolor(is_body_bigger_long and greenCandle and buyFlag  ? color.blue : na, transp=70)


// ENTRY ---------------------

// Input for ATR period
atr_length = input(14, title="ATR Length")

// Calculate ATR
atr_value = ta.atr(atr_length)

// Calculate stop loss and take profit levels
candleBody = math.abs(close-open)
slDist = atr_value + candleBody

stop_loss_long = close - slDist
take_profit_long = close + (1.2 * slDist)


stop_loss_short = high + slDist
take_profit_short = high - (1.2 * slDist)

// Entry and exit conditions
if (buyFlag and buyRsiFlag  and strategy.opentrades >= 0 and greenCandle)
    strategy.entry("Long", strategy.long)
    strategy.exit("Take Profit/Stop Loss", "Long", stop=stop_loss_long, limit=take_profit_long)

// Entry and exit conditions
if (sellFlag and sellRsiFlag   and strategy.opentrades <= 0 and redCandle)
    strategy.entry("Short", strategy.short)
    strategy.exit("Take Profit/Stop Loss", "Short", stop=stop_loss_short, limit=take_profit_short)