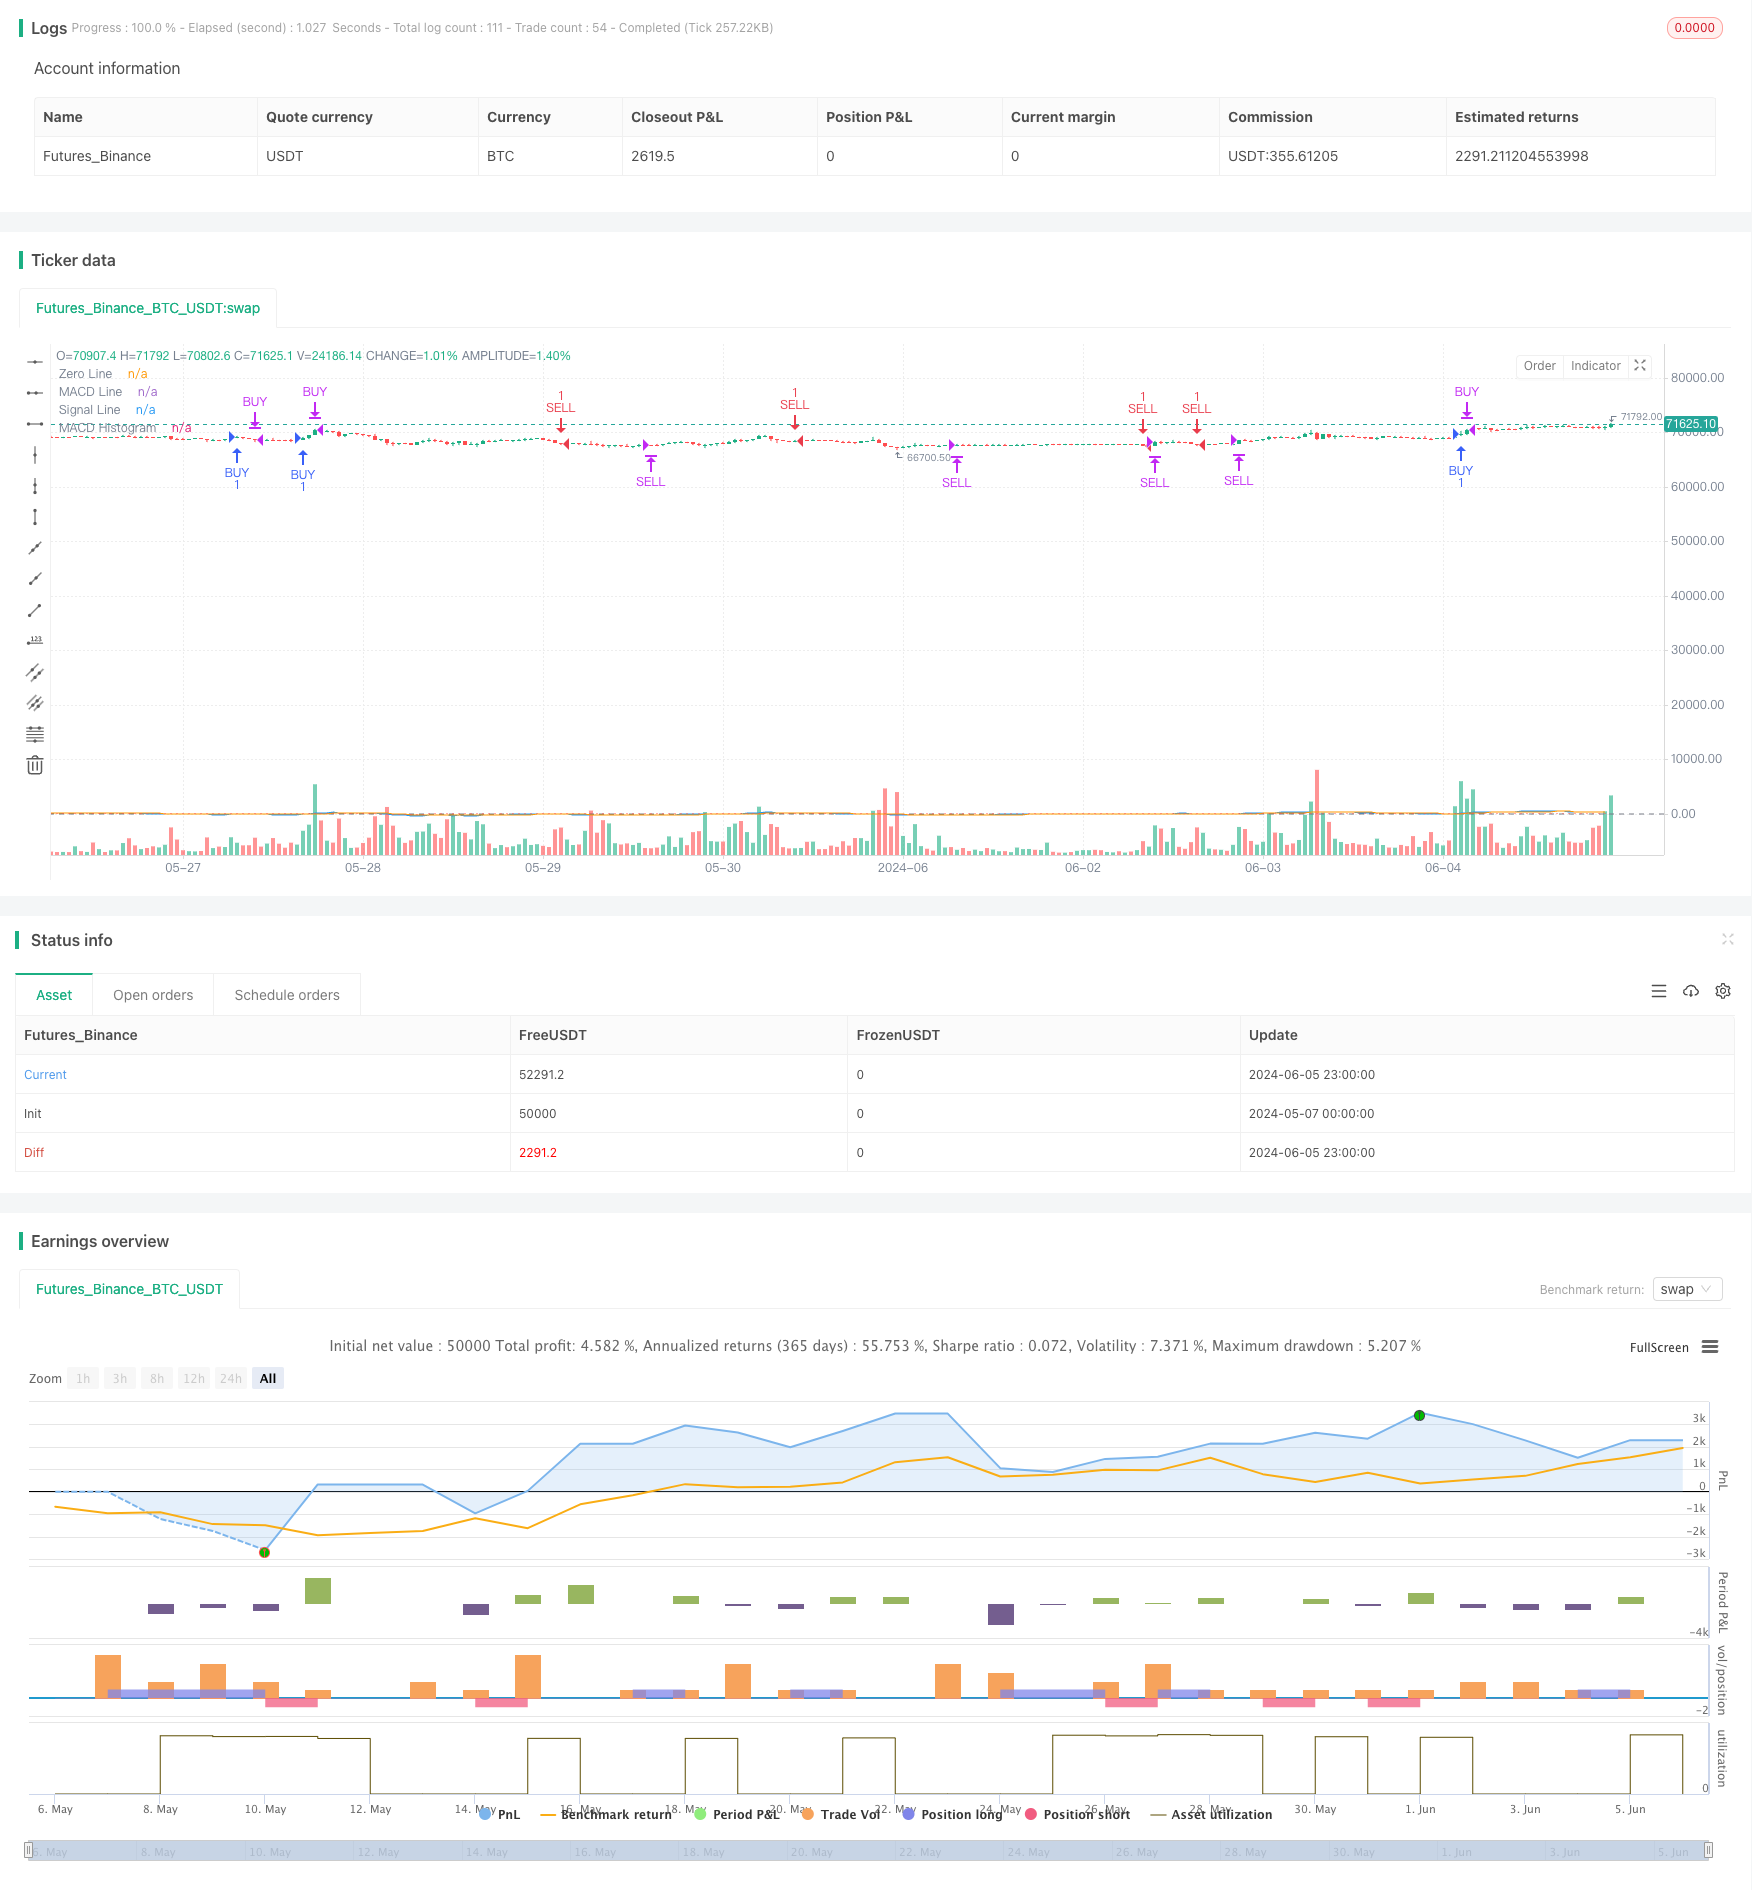
개요
이 전략은 MACD (이하 이동 평균이 지표에서 벗어나고) 와 RSI (이하 상대적으로 강한 지수) 와 SMA (이하 간단한 이동 평균) 를 결합하여 신뢰할 수 있는 매매 신호를 생성합니다. MACD는 가격의 동적 변화를 포착하는 데 사용되며, RSI는 과매매와 과매매 상태를 식별하는 데 사용되며, SMA는 트렌드 방향을 확인하는 데 사용됩니다. 이 전략은 거짓 신호를 줄이기 위해 여러 가지 조건을 필터링하여 일간 거래에 대한 명확한 출구점을 제공합니다.
전략 원칙
- MACD: MACD 라인이 아래에서 위쪽으로 신호 라인을 통과하면 다중 신호가 발생하며, MACD 라인이 위에서 아래로 신호 라인을 통과하면 공백 신호가 발생한다.
- RSI: RSI가 초과 구매 수준 ((70) 보다 낮을 때만 더 많은 것을 고려하십시오. RSI가 초과 판매 수준 ((30) 보다 높을 때만 공백을 고려하십시오. 이것은 이미 초과 구매 또는 초과 판매 된 경우 진입을 피하는 데 도움이됩니다.
- SMA: 50주기 SMA와 200주기 SMA는 트렌드 방향을 확인하기 위해 사용됩니다. 50주기 SMA가 200주기 SMA보다 높을 때만 더 많은 것을 고려합니다.
이 전략은 다음과 같은 조건으로 진행됩니다.
- 더하기: MACD 라인이 신호 라인을 상향으로 가로질러 RSI가 오버 바이 레벨 (70) 보다 낮고, 50주기 SMA가 200주기 SMA (상향 경향을 나타내는) 보다 높을 때 더하기.
- 핑토: MACD 라인이 아래로 신호선을 통과하거나 RSI가 오버 바이 레벨 (70) 을 초과할 때, 평소한다.
- 공백: MACD 라인이 아래로 신호선을 통과하고 RSI가 초상가수준 (> 30) 을 초과하고 50주기 SMA가 200주기 SMA보다 낮아 (내향 추세를 나타냅니다) 할 때 공백을 입력하십시오.
- 평평한 위치: MACD 라인이 신호 라인을 상향으로 통과하거나 RSI가 초과 수준을 넘어섰을 때 평평한 위치.
전략적 이점
- 다중 필터 메커니즘은 가짜 신호를 효과적으로 줄이고 신호 신뢰도를 높일 수 있다.
- 동력 지표와 트렌드 확인 지표가 결합되어 트렌드 방향에서 높은 확률의 거래 기회를 찾을 수 있습니다.
- 명확한 출입규칙은 자동화 거래가 가능하며 거래의 감정적 요소를 제거합니다.
- 일일 거래에 적합하며, 시장의 변화에 빠르게 적응하여 단기 거래 기회를 잡을 수 있습니다.
전략적 위험
- 이 전략은 불안정한 시장에서 더 많은 가짜 신호를 생성할 수 있으며, 이로 인해 거래가 빈번해지고 자금이 손실될 수 있습니다.
- 전략은 역사적 데이터 최적화 매개 변수에 의존하며, 시장 상태가 크게 변할 때 매개 변수가 다시 최적화 될 수 있습니다.
- 급격한 큰 이익 또는 이익이 없는 소식은 가격이 과매매 또는 과매매 수준을 돌파 할 수 있으며, 이 전략은 이러한 거래 기회를 놓칠 수 있습니다.
- 이 전략은 손해배상 장치가 없으므로 극단적인 상황에서는 더 큰 위험을 감수할 수 있습니다.
전략 최적화 방향
- 거래량, 변동률 등과 같은 필터링 조건을 더 많이 도입하여 신호의 신뢰성을 더욱 높일 수 있습니다.
- 다른 시장 상태 (예: 트렌드, 흔들림) 에 대한 다른 파라미터 조합을 사용하여 전략의 적응성을 향상시킵니다.
- 단편 거래의 위험과 수익을 통제하기 위해 합리적인 중지 및 중지 수준을 설정하십시오.
- 전략에 대한 재검토 및 실장 테스트를 수행하고, 지속적으로 최적화 및 매개 변수를 조정하여 전략의 안정성을 향상시킵니다.
요약하다
이 전략은 MACD, RSI, SMA와 같은 기술 지표와 결합하여 다중 필터링 된 일일 거래 전략을 형성한다. 그것은 동력과 추세의 변화를 사용하여 거래 기회를 포착하고 명확한 출입 규칙으로 위험을 통제한다. 이 전략은 불안한 시장에서 도전받을 수 있지만, 추가적인 최적화와 위험 관리를 통해 신뢰할 수있는 일일 거래 도구가 될 수 있습니다.
전략 소스 코드
/*backtest
start: 2024-05-07 00:00:00
end: 2024-06-06 00:00:00
period: 1h
basePeriod: 15m
exchanges: [{"eid":"Futures_Binance","currency":"BTC_USDT"}]
*/

//@version=5
strategy("Day Trading Strategy", overlay=true)

// Parametrii pentru MACD
macdLength = input.int(12, title="MACD Length")
signalSmoothing = input.int(9, title="MACD Signal Smoothing")
src = input(close, title="Source")

// Calculul MACD
[macdLine, signalLine, _] = ta.macd(src, macdLength, 26, signalSmoothing)
macdHist = macdLine - signalLine

// Parametrii pentru RSI
rsiLength = input.int(14, title="RSI Length")
rsiOverbought = input.int(70, title="RSI Overbought Level")
rsiOversold = input.int(30, title="RSI Oversold Level")

// Calculul RSI
rsi = ta.rsi(src, rsiLength)

// Filtru suplimentar pentru a reduce semnalele false
longFilter = ta.sma(close, 50) > ta.sma(close, 200)
shortFilter = ta.sma(close, 50) < ta.sma(close, 200)

// Conditii de intrare in pozitie long
enterLong = ta.crossover(macdLine, signalLine) and rsi < rsiOverbought and longFilter

// Conditii de iesire din pozitie long
exitLong = ta.crossunder(macdLine, signalLine) or rsi > rsiOverbought

// Conditii de intrare in pozitie short
enterShort = ta.crossunder(macdLine, signalLine) and rsi > rsiOversold and shortFilter

// Conditii de iesire din pozitie short
exitShort = ta.crossover(macdLine, signalLine) or rsi < rsiOversold

// Adaugarea strategiei pentru Strategy Tester
if (enterLong)
    strategy.entry("BUY", strategy.long)
if (exitLong)
    strategy.close("BUY")

if (enterShort)
    strategy.entry("SELL", strategy.short)
if (exitShort)
    strategy.close("SELL")

// Plotarea MACD si Signal Line
plot(macdLine, color=color.blue, title="MACD Line")
plot(signalLine, color=color.orange, title="Signal Line")
hline(0, "Zero Line", color=color.gray)
plot(macdHist, color=color.red, style=plot.style_histogram, title="MACD Histogram")