개요
이 전략은 다중 기술 지표에 기반한 정량 거래 시스템으로, 지수 이동 평균 ((EMA), 상대적으로 강한 지표 ((RSI) 및 평균 트렌드 지표 ((ADX) 의 3대 기술 지표를 통합한다. 전략은 EMA의 빠른 느린 선의 교차 신호를 주요 진입 근거로 하고, 동시에 RSI 지표와 결합하여 과도한 매매를 확인하고, ADX 지표를 이용하여 시장 경향의 강도를 판단하여 완전한 거래 의사 결정 시스템을 형성한다. 전략은 또한 위험 관리 모듈을 포함하고 있으며, 위험과 이익의 비율을 설정하여 각 거래의 중지 및 중지 위치를 제어한다.
전략 원칙
이 전략의 핵심 논리는 다음과 같은 몇 가지 핵심 요소에 기반합니다.
- 9주기 및 21주기 EMA를 주요 신호 시스템으로 사용하여, 빠른 선 위를 가로지르는 느린 선을 통해 구매 신호를 생성하고, 빠른 선 아래를 가로지르는 느린 선을 통해 판매 신호를 생성합니다.
- RSI를 필터로 도입하여, 구매 신호는 RSI가 60보다 낮아야 하며, 오버 바이 영역에서 입주를 피한다. 판매 신호는 RSI가 40보다 높아야 하며, 오버 세 영역에서 평점을 피한다.
- 트렌드 강도를 확인하는 ADX 지표를 사용하여 ADX가 20보다 크면 거래만 실행하여 명확한 트렌드에서 입장을 보장합니다.
- 자금 관리에서, 전략은 2.0의 리스크/이익 비율을 사용하여 중지/손실 설정을 합니다.
전략적 이점
- 여러 기술 지표의 통합은 신호의 신뢰성을 높이고 가짜 신호의 영향을 줄입니다.
- EMA 교차 시스템은 트렌드의 전환점을 효과적으로 포착합니다.
- RSI 필터는 극한 지역에서 불리한 입구를 효과적으로 방지합니다.
- ADX의 도입은 명확한 추세에서만 거래하는 것을 보장하고 승률을 높였습니다.
- 고정된 리스크/이익 비율 설정은 장기적으로 안정적인 자금 성장에 도움이 됩니다.
- 전략은 명확한 그래픽 인터페이스를 설계하고 거래 신호 표기 및 가격 표기
전략적 위험
- 복수의 지표로 인해 신호가 지연되어 출입 시기가 영향을 받을 수 있습니다.
- 거래비용을 증가시키는 빈번한 교차 신호가 흔들리는 시장에서 발생할 수 있습니다.
- 고정 RSI 및 ADX 마이너스는 모든 시장 환경에 적용되지 않을 수 있습니다.
- 예상된 리스크/이익 비율은 모든 시장 단계에 적합하지 않을 수 있습니다.
- 신호의 신뢰성에 영향을 미칠 수 있는 트랜스포트 요소를 고려하지 않고
전략 최적화 방향
- 시장의 변동성에 따라 EMA 주기를 조정하는 적응된 지표 변수를 도입합니다.
- 볼륨 확인 메커니즘을 추가하여 신호 안정성 향상
- 동적인 RSI 및 ADX 마이너스를 개발하여 다양한 시장 환경에 적응합니다.
- 시장의 변동에 따라 조정된 위험/수익비율
- 시간 필터를 추가하여 불리한 시간에 거래하는 것을 피하십시오.
- 시장 환경 인식 모듈을 추가하여 다른 시장 상태에서 다른 파라미터 설정을 사용합니다.
요약하다
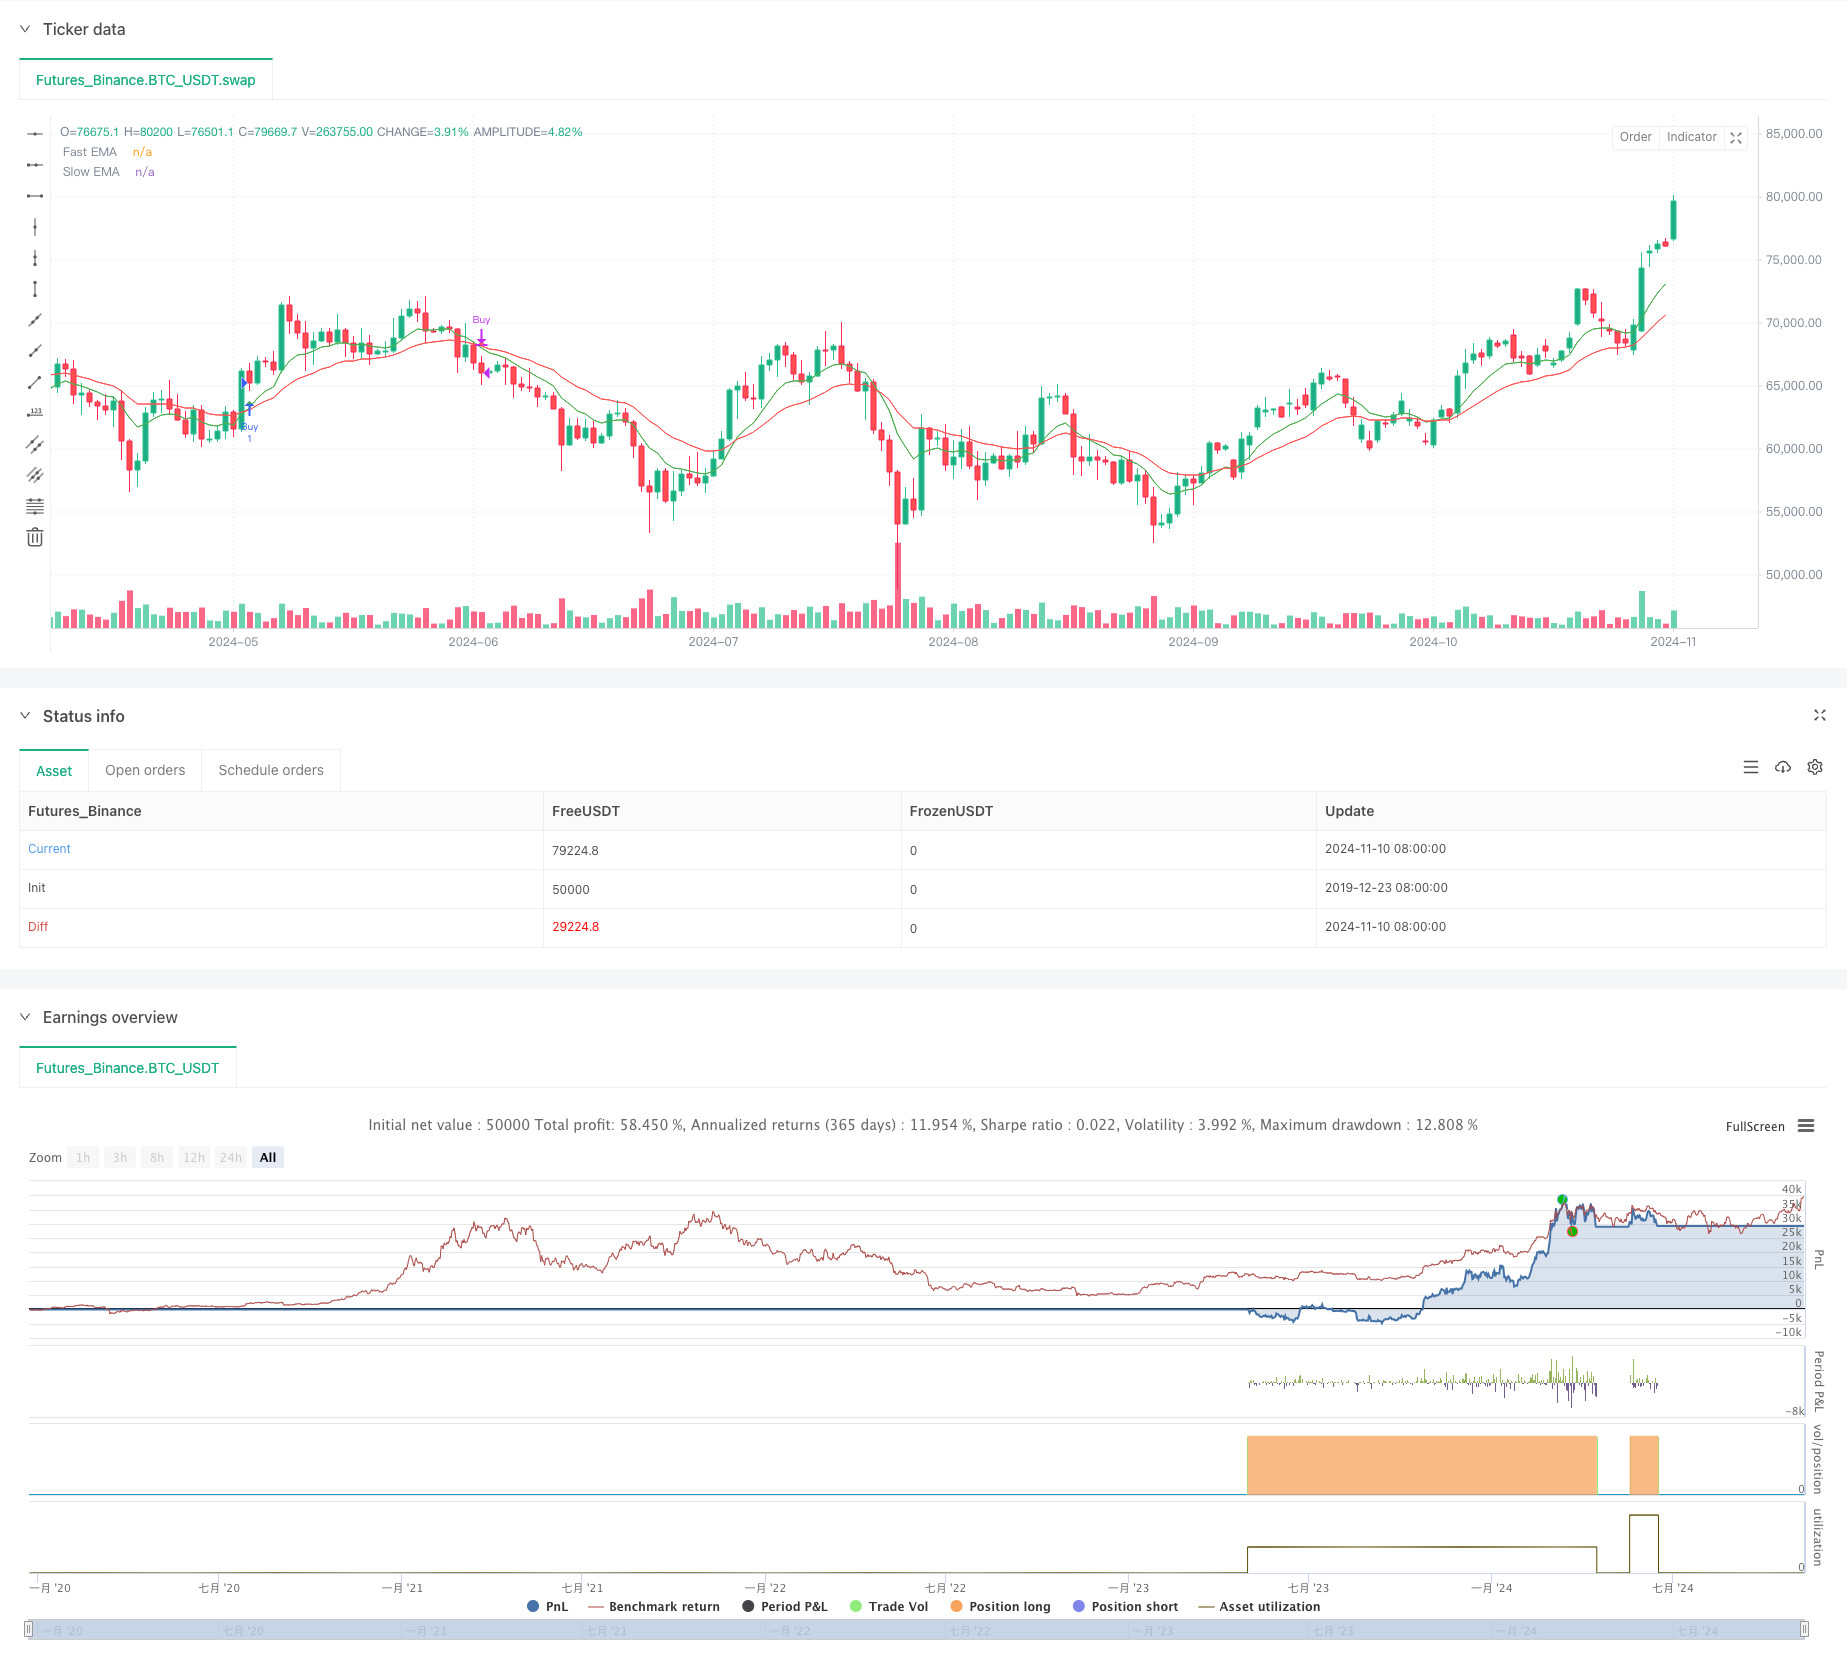
이 전략은 합리적이고 논리적으로 설계된 다중 기술 지표 거래 전략이다. EMA, RSI, ADX 세 가지의 고전 기술 지표를 통합함으로써 전략은 추세 추적 및 위험 제어에서 좋은 성능을 발휘한다.
전략 소스 코드
/*backtest
start: 2019-12-23 08:00:00
end: 2024-11-11 00:00:00
period: 1d
basePeriod: 1d
exchanges: [{"eid":"Futures_Binance","currency":"BTC_USDT"}]
*/

//@version=5
strategy("Enhanced EMA + RSI + ADX Strategy", overlay=true)

// Input parameters
lenFast = input.int(9, title="Fast EMA Length", minval=1)
lenSlow = input.int(21, title="Slow EMA Length", minval=1)
rsiPeriod = input.int(14, title="RSI Period")
adxPeriod = input.int(14, title="ADX Period")
adxSmoothing = input.int(1, title="ADX Smoothing")
adxThreshold = input.int(20, title="ADX Threshold")
riskRewardRatio = input.float(2.0, title="Risk/Reward Ratio")

// EMA Calculations
fastEMA = ta.ema(close, lenFast)
slowEMA = ta.ema(close, lenSlow)

// RSI Calculation
rsiValue = ta.rsi(close, rsiPeriod)

// ADX Calculation
[plusDI, minusDI, adxValue] = ta.dmi(adxPeriod, adxSmoothing)

// Entry Conditions
buyCondition = ta.crossover(fastEMA, slowEMA) and rsiValue < 60 and adxValue > adxThreshold
sellCondition = ta.crossunder(fastEMA, slowEMA) and rsiValue > 40 and adxValue > adxThreshold

// Entry logic
if (buyCondition)
    strategy.entry("Buy", strategy.long)
    strategy.exit("Sell", from_entry="Buy", limit=close + (close - strategy.position_avg_price) * riskRewardRatio, stop=close - (close - strategy.position_avg_price))

if (sellCondition)
    strategy.close("Buy")

// Plotting EMAs (thinner lines)
plot(fastEMA, color=color.new(color.green, 0), title="Fast EMA", linewidth=1)
plot(slowEMA, color=color.new(color.red, 0), title="Slow EMA", linewidth=1)

// Entry and exit markers (larger shapes)
plotshape(series=buyCondition, style=shape.triangleup, location=location.belowbar, color=color.new(color.green, 0), size=size.normal, title="Buy Signal")
plotshape(series=sellCondition, style=shape.triangledown, location=location.abovebar, color=color.new(color.red, 0), size=size.normal, title="Sell Signal")

// Displaying price labels for buy/sell signals
if (buyCondition)
    label.new(bar_index, low, text="Buy\n" + str.tostring(close), color=color.new(color.green, 0), style=label.style_label_down, textcolor=color.white)

if (sellCondition)
    label.new(bar_index, high, text="Sell\n" + str.tostring(close), color=color.new(color.red, 0), style=label.style_label_up, textcolor=color.white)

// Optional: Add alerts for entry signals
alertcondition(buyCondition, title="Buy Alert", message="Buy signal triggered")
alertcondition(sellCondition, title="Sell Alert", message="Sell signal triggered")