개요
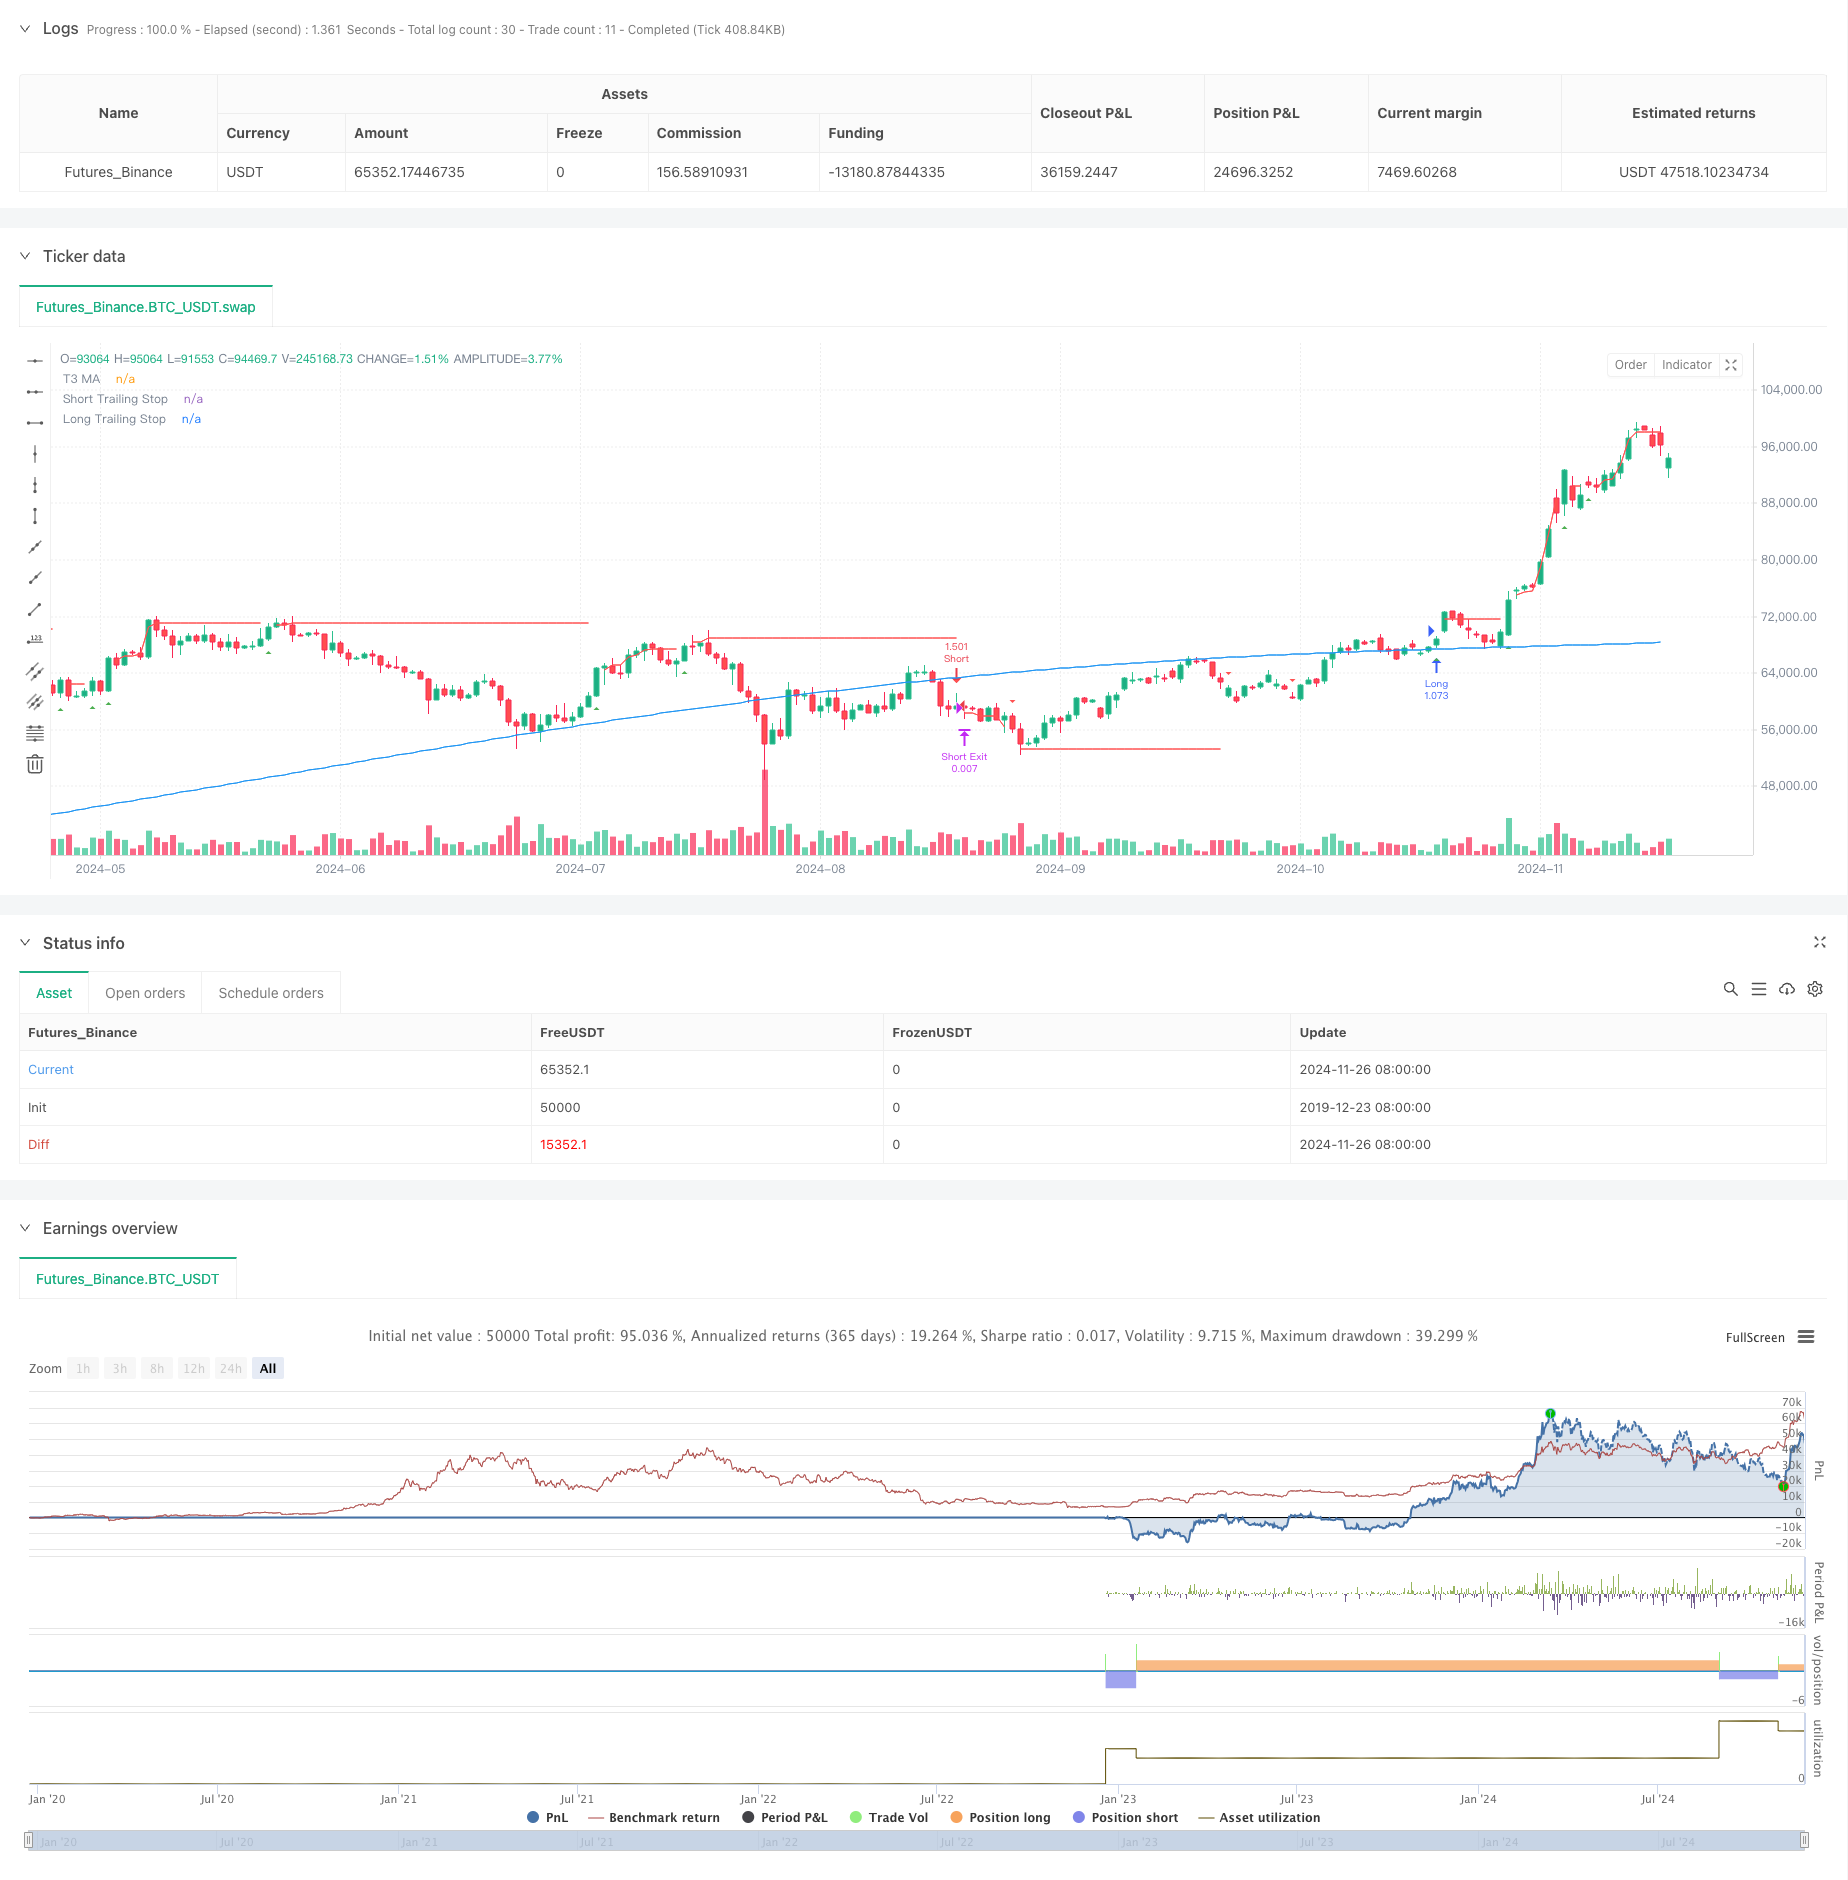
이 전략은 T3 평균선, 트렌드 추적 및 모바일 스톱 메커니즘을 결합한 종합적인 정량 거래 시스템입니다. 전략은 T3 이동 평균을 통해 시장의 트렌드 방향을 식별하고, 레몬 트렌드 지표와 TDFI 지표를 사용하여 신호를 확인하며, 이동 스톱 및 고정 스톱을 결합한 위험 관리 시스템과 함께 트렌드를 파악하고 위험을 효과적으로 제어합니다.
전략 원칙
이 전략의 핵심에는 3가지 주요 부분이 포함되어 있습니다: 트렌드 식별, 신호 확인 및 위험 관리. 첫째, T3 이동 평균을 주요 트렌드 식별 도구로 사용하여, T3 평균은 6배 지수 이동 평균을 통해 계산하여 지연을 효과적으로 감소시키고 평탄함을 유지할 수 있습니다. 둘째, 레몬 트렌드 지표를 통해 가격 변동 영역을 계산하고, TDFI 지표와 결합하여 신호를 필터링하여 가격 변동 영역을 돌파하고 TDFI 지표가 확인되면 거래 신호가 발생합니다. 마지막으로, 이동 스톱과 고정 스톱의 결합 방식으로 전략이 적용됩니다.
전략적 이점
- 다중 신호 확인 메커니즘으로 거래 정확도 향상
- T3 평균선의 사용은 가짜 돌파의 영향을 줄여줍니다.
- 유연한 리스크 관리 시스템으로 수익을 보호하면서 트렌드에 충분한 공간을 제공합니다.
- 일부 포지션 중단을 지원하여 이윤의 단계적 환불이 가능합니다.
- 다양한 시장 환경에 따라 최적화할 수 있도록 변수가 조정 가능합니다.
전략적 위험
- T3 평균선 계산이 복잡하여 계산 지연이 있을 수 있다.
- 다중 신호 확인으로 인해 몇 가지 거래 기회를 놓칠 수 있습니다.
- 이동식 정지는 급격한 변동이 있을 때 조기 발생될 수 있습니다.
- 더 큰 가격 변동이 있어야 효과적인 신호를 낼 수 있습니다.
- 상자 시장에서 빈번한 잘못된 신호가 발생할 수 있습니다.
전략 최적화 방향
- 변동률 지표의 도입 이동 중지 패러미터를 조정
- 시장 환경 인식 모듈을 추가하여 다른 시장 조건에 따라 다른 매개 변수를 사용합니다
- TDFI 지표의 계산주기를 최적화하여 신호의 성을 향상
- 트랜스포메이션 요소를 추가하는 것을 고려하여 신호 확인
- 적응된 부분 막기 비율 설정 메커니즘을 연구
요약하다
이것은 다중 기술 지표의 조합 사용으로 거래 신호의 신뢰성을 보장하고 효과적인 위험 관리를 구현하는 포괄적 인 트렌드 추적 전략을 설계한 것입니다. 전략의 모듈화 설계는 중기 및 장기 트렌드 추적 시스템의 기본 프레임 워크로 적합 한 확장성과 최적화 공간을 제공합니다. 실제 응용에서는 특정 거래 유형과 시장 환경에 따라 파라미터를 최적화 조정하는 것이 좋습니다.
전략 소스 코드
/*backtest
start: 2019-12-23 08:00:00
end: 2024-11-27 00:00:00
period: 1d
basePeriod: 1d
exchanges: [{"eid":"Futures_Binance","currency":"BTC_USDT"}]
*/

//@version=5
strategy("Lemon Trend Strategy", overlay=true, initial_capital=10000, default_qty_type=strategy.percent_of_equity, default_qty_value=100)

// Input parameters
lookbackPeriod = input.int(14, "Lookback Period")
t3Length = input.int(200, "T3 MA Length")
t3Factor = input.float(0.7, "T3 Factor", minval=0, maxval=1)

// 移动止损参数
trailingStopPct = input.float(1.5, "移动止损百分比", minval=0.1, step=0.1)
trailingStopActivationPct = input.float(1.0, "移动止损激活百分比", minval=0.1, step=0.1)

// === T3 Moving Average Function ===
t3(src, length, factor) =>
    // First EMA
    e1 = ta.ema(src, length)
    // Second EMA
    e2 = ta.ema(e1, length)
    // Third EMA
    e3 = ta.ema(e2, length)
    // Fourth EMA
    e4 = ta.ema(e3, length)
    // Fifth EMA
    e5 = ta.ema(e4, length)
    // Sixth EMA
    e6 = ta.ema(e5, length)

    c1 = -factor * factor * factor
    c2 = 3 * factor * factor + 3 * factor * factor * factor
    c3 = -6 * factor * factor - 3 * factor - 3 * factor * factor * factor
    c4 = 1 + 3 * factor + factor * factor * factor + 3 * factor * factor

    t3 = c1 * e6 + c2 * e5 + c3 * e4 + c4 * e3

// Calculate T3 MA
t3ma = t3(close, t3Length, t3Factor)
plot(t3ma, "T3 MA", color=color.blue)

// === Lemon Trend Indicator ===
highLowDiff = high - low
normalizedDiff = ta.sma(highLowDiff, lookbackPeriod)
upperBand = ta.highest(high, lookbackPeriod)
lowerBand = ta.lowest(low, lookbackPeriod)
buySignal = ta.crossover(close, upperBand - normalizedDiff)
sellSignal = ta.crossunder(close, lowerBand + normalizedDiff)

// === TDFI Indicator ===
tdfiLength = input.int(14, "TDFI Length")
tdfi = ta.ema(close - close[1], tdfiLength)
tdfiSignal = ta.ema(tdfi, 9)

// Plot signals
plotshape(buySignal and tdfi > tdfiSignal and close > t3ma, "Buy Signal", location=location.belowbar, color=color.green, style=shape.triangleup, size=size.small)
plotshape(sellSignal and tdfi < tdfiSignal and close < t3ma, "Sell Signal", location=location.abovebar, color=color.red, style=shape.triangledown, size=size.small)

// === Strategy Logic ===
longCondition = buySignal and tdfi > tdfiSignal and close > t3ma
shortCondition = sellSignal and tdfi < tdfiSignal and close < t3ma

// 计算移动止损价格
var float longTrailingStop = na
var float shortTrailingStop = na

// 更新移动止损价格
if (strategy.position_size > 0)
    threshold = strategy.position_avg_price * (1 + trailingStopActivationPct / 100)
    if (high > threshold)
        stopPrice = high * (1 - trailingStopPct / 100)
        if (na(longTrailingStop) or stopPrice > longTrailingStop)
            longTrailingStop := stopPrice

if (strategy.position_size < 0)
    threshold = strategy.position_avg_price * (1 - trailingStopActivationPct / 100)
    if (low < threshold)
        stopPrice = low * (1 + trailingStopPct / 100)
        if (na(shortTrailingStop) or stopPrice < shortTrailingStop)
            shortTrailingStop := stopPrice

// Entry orders
if (longCondition)
    strategy.entry("Long", strategy.long)
    longTrailingStop := na

if (shortCondition)
    strategy.entry("Short", strategy.short)
    shortTrailingStop := na

// Calculate stop loss and take profit levels
longStopLoss = ta.lowest(low, lookbackPeriod)
shortStopLoss = ta.highest(high, lookbackPeriod)

// Exit conditions with fixed R:R
fixedRR = input.float(1.8, "Fixed Risk:Reward Ratio")
partialExitPct = input.float(50.0, "Partial Exit Percentage", minval=0, maxval=100) / 100

// 综合移动止损和固定止损
if (strategy.position_size > 0)
    longTakeProfit = strategy.position_avg_price + (strategy.position_avg_price - longStopLoss) * fixedRR
    stopPrice = na(longTrailingStop) ? longStopLoss : math.max(longStopLoss, longTrailingStop)
    strategy.exit("Long Exit", "Long", qty_percent=partialExitPct, stop=stopPrice, limit=longTakeProfit)

if (strategy.position_size < 0)
    shortTakeProfit = strategy.position_avg_price - (shortStopLoss - strategy.position_avg_price) * fixedRR
    stopPrice = na(shortTrailingStop) ? shortStopLoss : math.min(shortStopLoss, shortTrailingStop)
    strategy.exit("Short Exit", "Short", qty_percent=partialExitPct, stop=stopPrice, limit=shortTakeProfit)

// 绘制移动止损线
plot(strategy.position_size > 0 ? longTrailingStop : na, "Long Trailing Stop", color=color.red, style=plot.style_linebr)
plot(strategy.position_size < 0 ? shortTrailingStop : na, "Short Trailing Stop", color=color.red, style=plot.style_linebr)