전략 개요
이 전략은 주로 브린을 통해 시장의 변동 영역을 식별하고, 동시에 슈퍼 트렌드 지표를 사용하여 시장의 경향 방향을 확인하여 높은 확률 위치에서 거래합니다. 전략은 다양한 거래 품종과 시간 주기, 특히 30 분 및 2 시간 주기에서 잘 작동합니다.
전략 원칙
전략의 핵심 논리는 다음과 같은 핵심 요소에 기초합니다.
- 20주기의 브린 밴드를 사용하여, 2개의 표준 차이의 대역폭으로, 상반도, 중반도, 하반도, 그리고 두 개의 중간선을 구성한다
- 10주기 ATR과 3배의 인자를 계산한 슈퍼 트렌드 지표
- 출입 신호:
- 다중 입구: 가격이 브린의 하향 궤도에 닿고 슈퍼 트렌드 지표가 다중 입구로 표시될 때
- 공백 입구: 가격이 브린을 때, 수퍼 트렌드 지표가 공백 방향으로 표시됩니다.
- 출구 신호:
- 다수 출전: 종결 가격이 슈퍼 트렌드 라인을 넘어 추세가 공백으로 바뀌면
- 공백 출장: 종결 가격이 슈퍼 트렌드 라인을 뚫고 트렌드가 다면으로 전환되면
전략적 이점
- 이중 확인 메커니즘은 거래 신뢰성을 높입니다: 부린의 변동 영역과 슈퍼 트렌드의 방향을 판단하여 가짜 돌파의 위험을 효과적으로 감소시킵니다.
- 시장의 변동에 적응: 브린 밴드는 시장의 변동에 따라 자동으로 대역폭을 조정하여 전략을 잘 적응시킵니다.
- 명확한 거래 신호: 입출자 조건이 명확하고 실행 및 재검토가 쉽다
- 유연한 파라미터 설정: 다양한 시장 조건에 따라 브린 대역 길이, 대역폭 곱수 및 슈퍼 트렌드 파라미터를 조정할 수 있습니다.
- 뛰어난 시각화 효과: 분석 및 모니터링을 위해 다양한 색상과 모양의 거래 신호를 표시합니다.
전략적 위험
- 변동성 시장 위험: 변동성 시장에서 빈번한 잘못된 신호가 발생할 수 있습니다.
- 지연 위험: 브린 벨트와 슈퍼 트렌드는 지연 지표로 분류되며, 빠른 시점에 최적의 입구 지점을 놓칠 수 있습니다.
- 매개변수 민감도: 매개변수 설정이 다르면 전략 성능에 큰 차이가 생길 수 있습니다. 이 전략은 다음과 같은 위험 통제를 권장합니다.
- 단위 리스크를 제어하기 위해 스톱 로즈 포지션을 설정합니다.
- 급격한 변동이 있는 동안 거래 중단을 고려하십시오.
- 시장의 변화에 대응하기 위해 매개 변수를 정기적으로 최적화하십시오.
전략 최적화 방향
- 시장 변동성 필터링을 늘리세요.
- 높은 변동률 환경에서 포지션 크기를 조정
- ATR 필터를 추가하여 과도한 변동 기간 동안 거래를 피하십시오.
- “지난 몇 년 동안,
- 브린 대역폭에 기반한 동적 설정 스톱 로지
- 슈퍼 트렌드 슬라이드와 함께 동적 정지 전략을 설계합니다.
- 시간 필터를 추가하세요:
- 중요한 자료를 공개하는 시간을 회피합니다.
- 다른 시간대에 대해 다른 매개 변수를 설정
- 신호 확인 메커니즘을 최적화합니다.
- 볼륨 증가 확인
- 트렌드 강도 지표를 추가하는 것을 고려하십시오.
요약하다
이것은 기술 분석의 클래식 지표와 결합된 완전한 거래 시스템이며, 브린 밴드와 슈퍼 트렌드의 연동으로 트렌드와 변동 모두에서 좋은 성능을 발휘할 수 있다. 전략의 시각화 설계와 파라미터 유연성은 훌륭한 실용성을 갖는다. 제안된 최적화 방향을 통해 전략의 안정성과 수익성을 더욱 향상시킬 수 있다. 실제 사용 전에 충분한 피드백과 파라미터 최적화를 권장한다.
전략 소스 코드
/*backtest
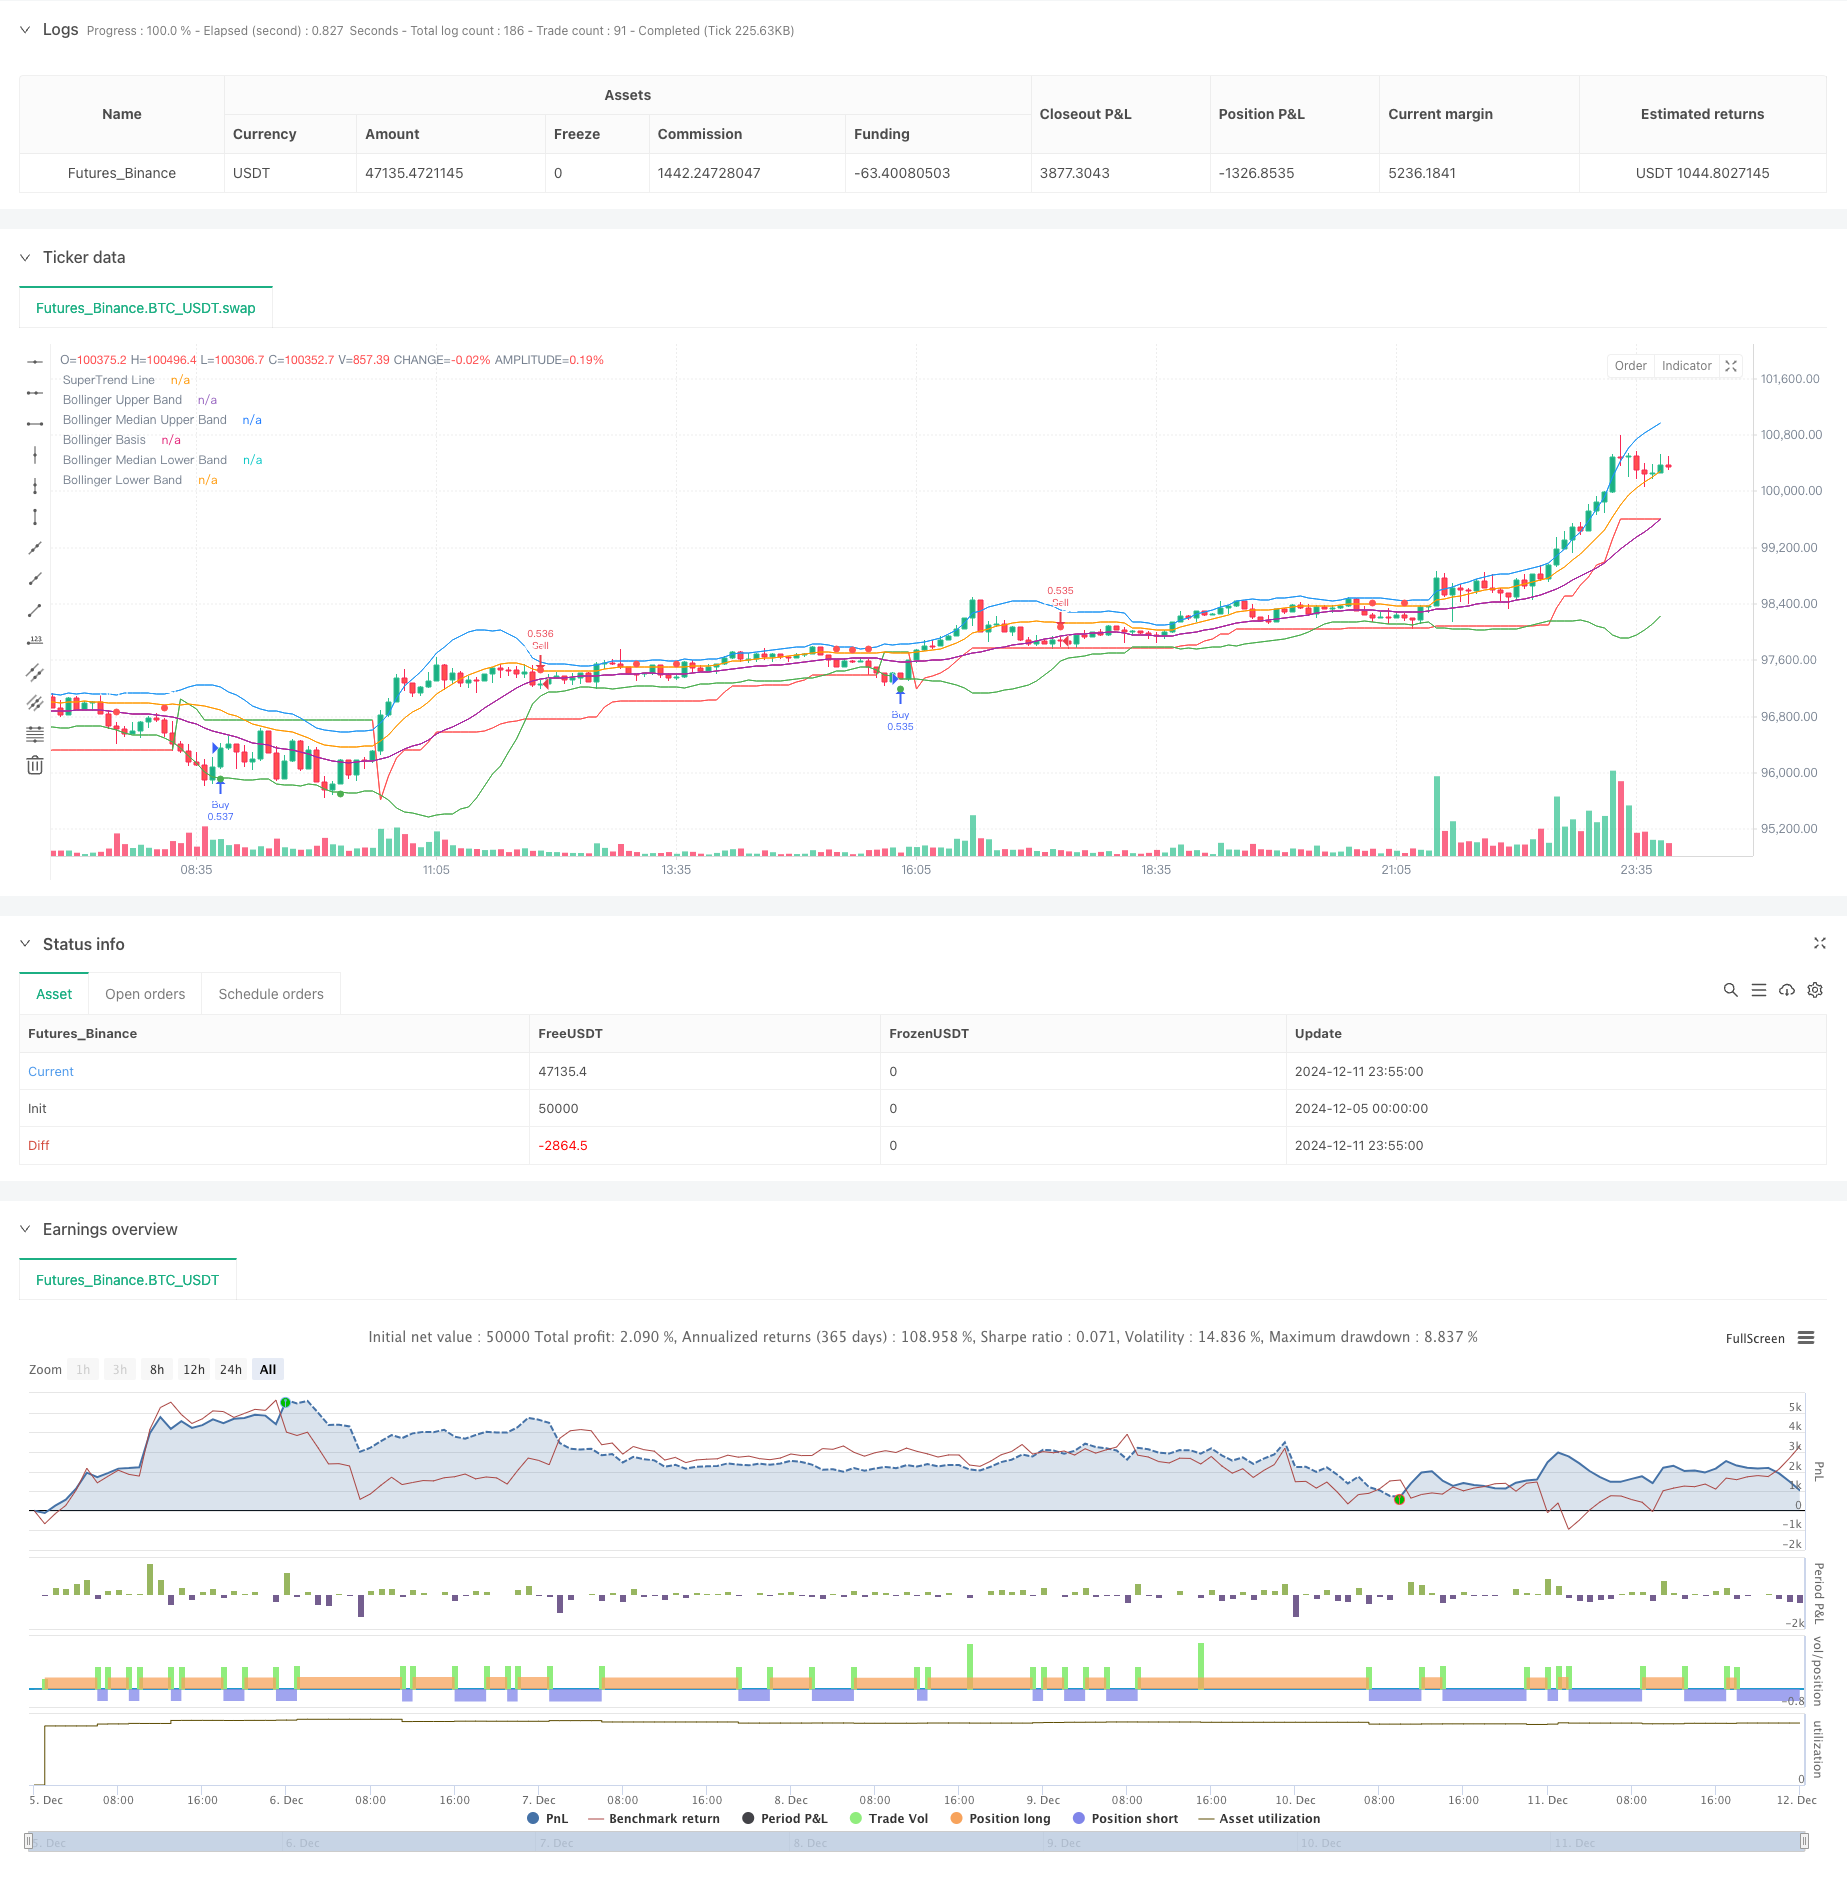
start: 2024-12-05 00:00:00
end: 2024-12-12 00:00:00
period: 5m
basePeriod: 5m
exchanges: [{"eid":"Futures_Binance","currency":"BTC_USDT"}]
*/
//@version=5
strategy("Bollinger Band & SuperTrend Strategy (Standard Chart)", overlay=true, default_qty_type=strategy.percent_of_equity, default_qty_value=100)
// Bollinger Bands Settings
length_bb = input.int(20, title="Bollinger Band Length")
mult_bb = input.float(2.0, title="Bollinger Band Multiplier")
[bb_upper, bb_basis, bb_lower] = ta.bb(close, length_bb, mult_bb)
// Median Bands
bb_median_upper = (bb_upper + bb_basis) / 2
bb_median_lower = (bb_lower + bb_basis) / 2
// SuperTrend Settings
atr_length = input.int(10, title="ATR Length")
factor = input.float(3.0, title="SuperTrend Factor")
// SuperTrend Calculation based on standard chart OHLC data
[supertrend, direction] = ta.supertrend(factor, atr_length)
// Plotting Bollinger Bands
plot(bb_upper, color=color.red, title="Bollinger Upper Band")
plot(bb_median_upper, color=color.orange, title="Bollinger Median Upper Band")
plot(bb_basis, color=color.blue, title="Bollinger Basis")
plot(bb_median_lower, color=color.purple, title="Bollinger Median Lower Band")
plot(bb_lower, color=color.green, title="Bollinger Lower Band")
// Plotting SuperTrend
supertrend_color = direction > 0 ? color.green : color.red
plot(supertrend, color=supertrend_color, style=plot.style_line, title="SuperTrend Line")
// Customizable Signal Shape Inputs
buy_shape = input.string("shape_triangle_up", title="Buy Signal Shape", options=["shape_triangle_up", "shape_circle", "shape_cross", "shape_diamond", "shape_flag"])
sell_shape = input.string("shape_triangle_down", title="Sell Signal Shape", options=["shape_triangle_down", "shape_circle", "shape_cross", "shape_diamond", "shape_flag"])
// Entry Conditions
buy_condition = ta.crossover(low, bb_lower) and direction > 0
sell_condition = ta.crossunder(high, bb_upper) and direction < 0
// Exit Conditions
exit_buy_condition = ta.crossunder(close, supertrend) and direction < 0
exit_sell_condition = ta.crossover(close, supertrend) and direction > 0
// Strategy Logic
if buy_condition
strategy.entry("Buy", strategy.long)
if sell_condition
strategy.entry("Sell", strategy.short)
if exit_buy_condition
strategy.close("Buy")
if exit_sell_condition
strategy.close("Sell")
// Plot Buy Signal Shape
plotshape(series=buy_condition, title="Buy Signal", location=location.belowbar, color=color.green, style=buy_shape, text="BUY", textcolor=color.white)
// Plot Sell Signal Shape
plotshape(series=sell_condition, title="Sell Signal", location=location.abovebar, color=color.red, style=sell_shape, text="SELL", textcolor=color.white)