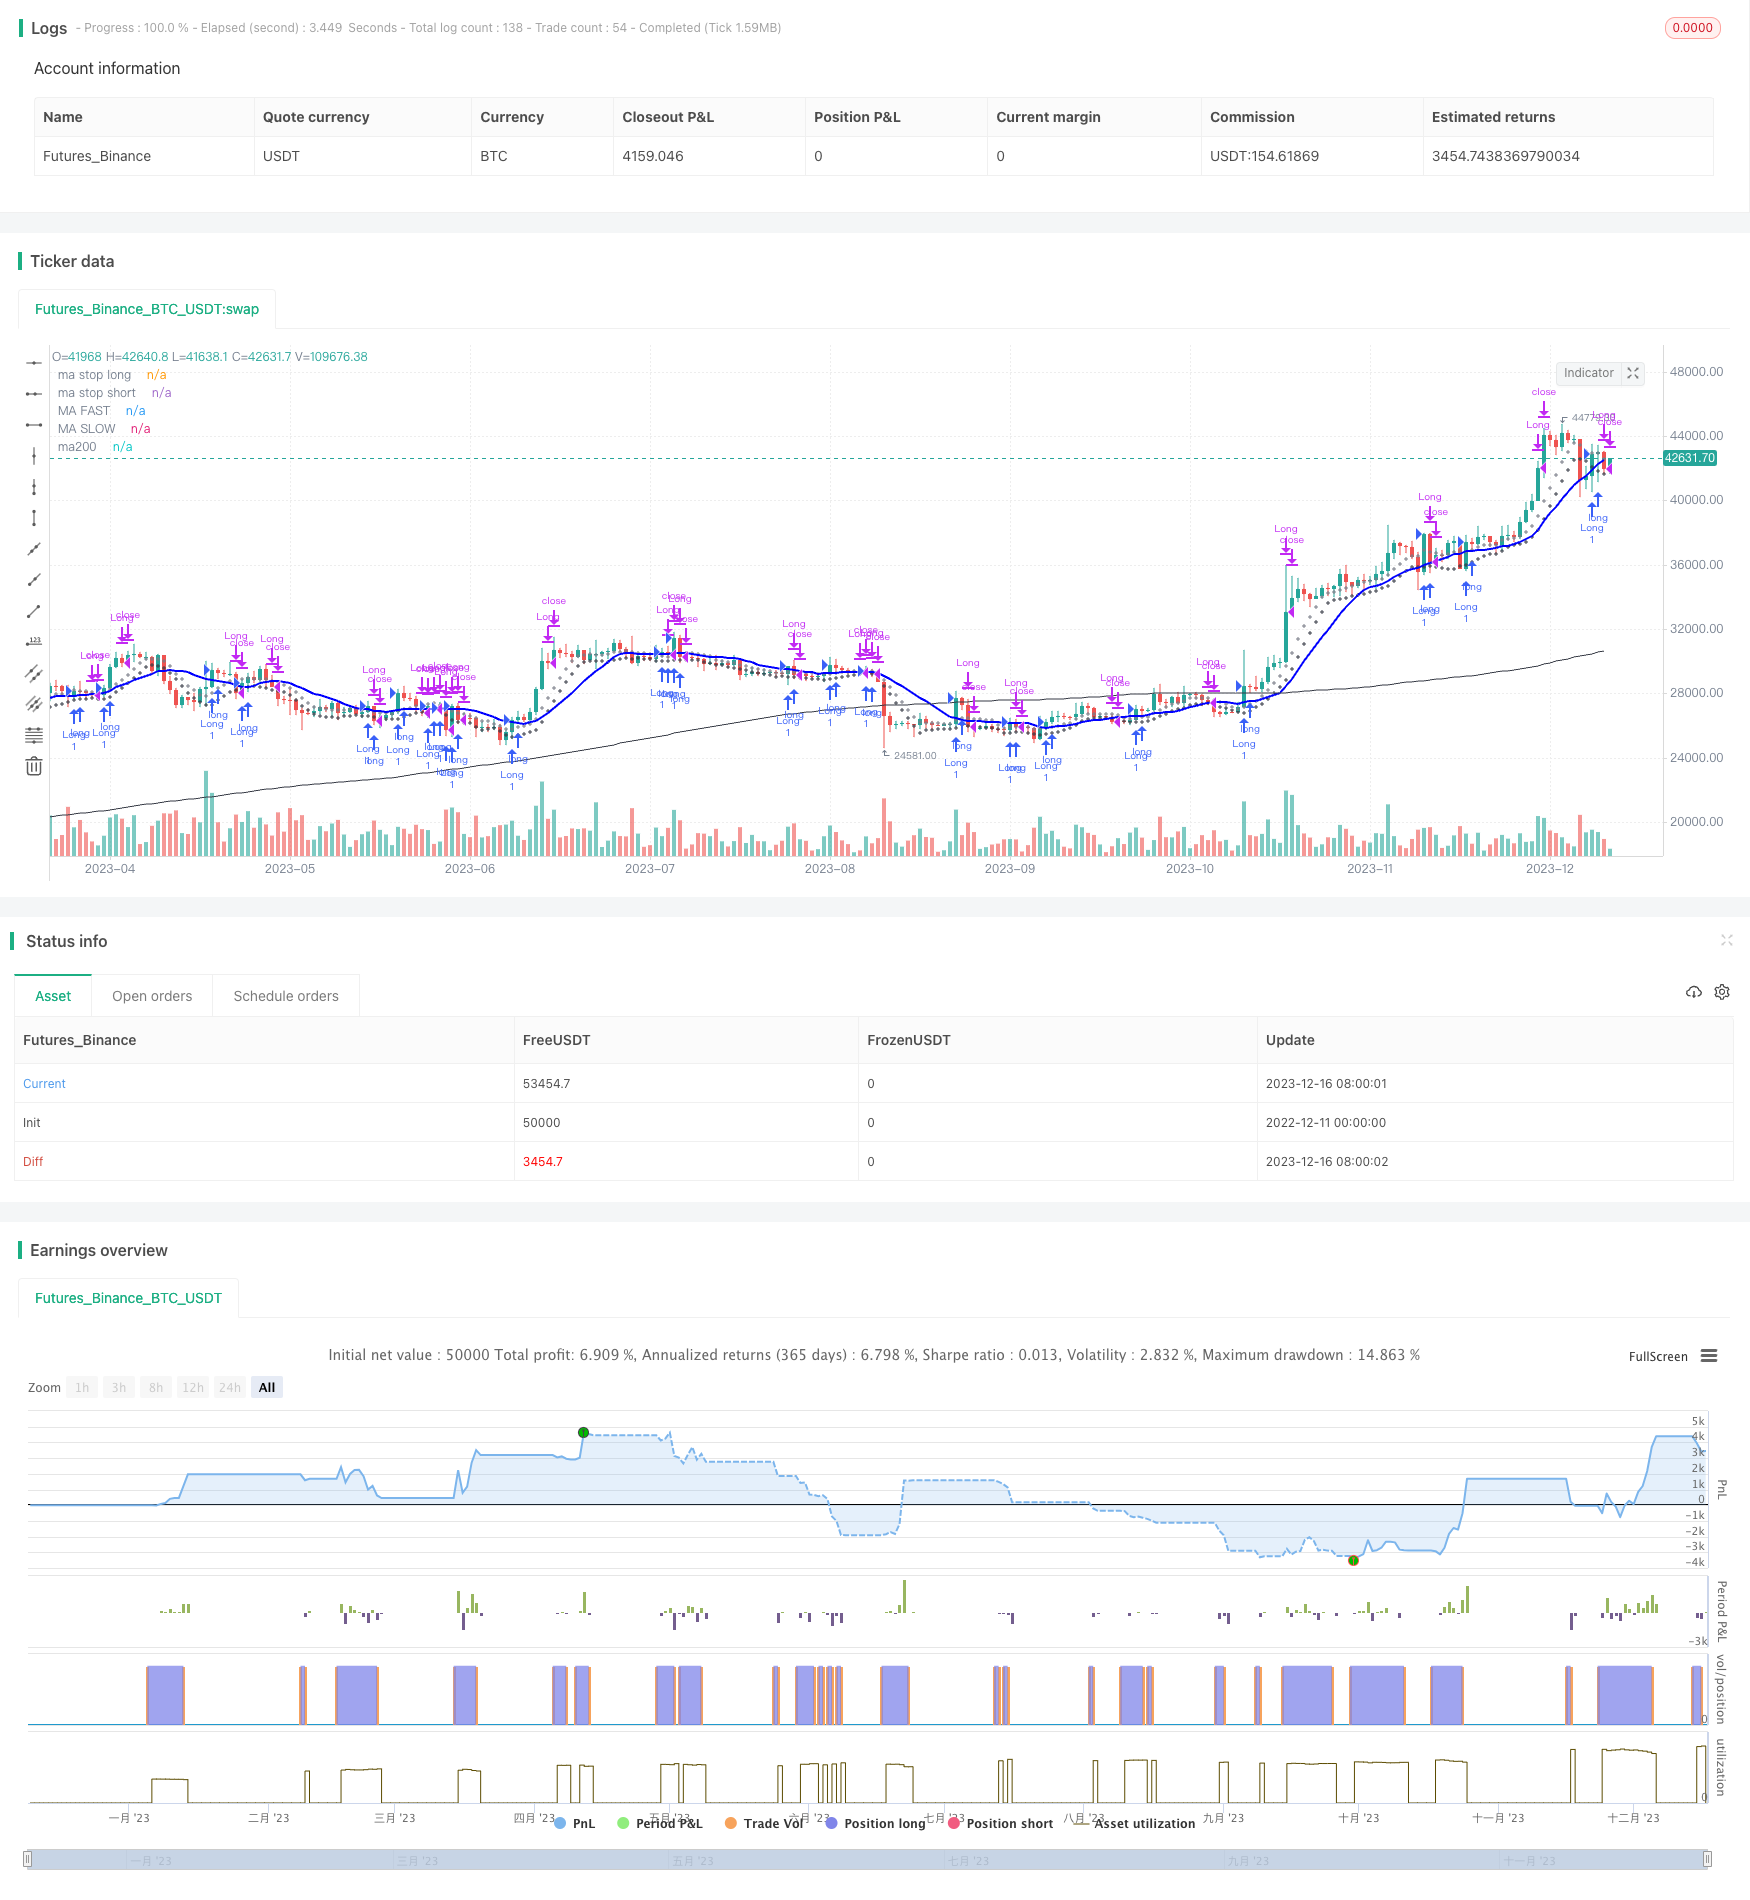
SMA dan RSI Strategi Lama Hanya
Penulis:ChaoZhang, Tarikh: 2023-12-18 10:28:10Tag:

Ringkasan
Strategi ini diadaptasi dari artikel oleh Enrico Malverti. Ia terutamanya menggunakan Purata Bergerak Sederhana (SMA) dan Indeks Kekuatan Relatif (RSI) untuk mengenal pasti isyarat masuk dan keluar yang panjang. Strategi ini hanya berjalan panjang tetapi tidak pendek.
Logika Strategi
Isyarat kemasukan diaktifkan apabila harga penutupan melintasi garis SMA jangka panjang.
Isyarat keluar termasuk:
- Tutup panjang apabila RSI melintasi di bawah 70 atau melebihi 75;
- Stop loss apabila harga penutupan melintasi di bawah garis SMA tempoh yang lebih pendek;
- Ambil keuntungan apabila harga penutupan melintasi di bawah garis SMA tempoh pendek.
Garis SMA stop loss dan garis SMA mengambil keuntungan juga digambarkan.
Analisis Kelebihan
Kelebihan strategi ini:
- Menggunakan gabungan penunjuk yang mudah dan mudah difahami;
- Hanya pergi lama untuk mengelakkan risiko jualan pendek;
- Mempunyai kemasukan yang jelas, peraturan stop loss dan mengambil keuntungan, risiko yang boleh dikawal;
- Mudah dioptimumkan dengan menyesuaikan tempoh SMA dan lain-lain.
Analisis Risiko
Terdapat beberapa risiko:
- Kecenderungan psikologi kehilangan keyakinan selepas kekalahan;
- Pergeseran garis SMA boleh menyebabkan risiko;
- Isyarat perbezaan RSI mungkin tidak boleh dipercayai.
Penyelesaian:
- Membina mekanisme perdagangan tetap mengikut peraturan;
- Mengoptimumkan tempoh SMA;
- Tambah penapis lain untuk isyarat RSI.
Arahan pengoptimuman
Strategi ini boleh dioptimumkan lagi:
- Uji parameter yang berbeza untuk SMA;
- Tambah penunjuk lain sebagai penapis;
- Tambah pengenalan trend untuk membezakan trend dan penyatuan;
- Penyesuaian parameter dan pengoptimuman.
Kesimpulan
Idea keseluruhan adalah mudah dan jelas. Dengan penunjuk asas dan kawalan, ia sesuai untuk perdagangan jangka menengah dan panjang. Tetapi penyesuaian parameter dan penapisan penunjuk memerlukan banyak ujian dan pengoptimuman untuk menjadikan strategi lebih kukuh dan boleh dipercayai. Idea mudah memerlukan usaha besar pada pengoptimuman dan kombinasi untuk membentuk sistem perdagangan yang boleh digunakan yang sebenar.
/*backtest
start: 2022-12-11 00:00:00
end: 2023-12-17 00:00:00
period: 1d
basePeriod: 1h
exchanges: [{"eid":"Futures_Binance","currency":"BTC_USDT"}]
*/

//@version= 4
// form the original idea of Enrico Malverti www.enricomalverti.com , trading system 2015
// https://sauciusfinance.altervista.org
strategy(title="MAs & RSI strategy long only", overlay = true, max_bars_back=500)

///********FROM EMAS TO SIMPLE MA *****
// NON AGGIUNTO SCHAFF INDICATOR, che serve per discriminare quali titoli scegliere dallo screener (segnale già aperto o il primo o, a parità,
//quello più alto) ==> Tolte le bande di Bollinger (che filtrano "poco")

// INPUTS
emapf = input(14, title ="Ma periodo veloce",  minval=1, step = 1)
emapl = input(14, title ="Ma periodo lungo",  minval=1, step = 1)
emaps = input(7, title ="Ma periodi stop",  minval=1, step = 1)
rsi_period = input(14, title="RSI period", minval = 1, step = 1)
// CALCULATIONS
maf = sma(close, emapf)
mal = sma(close, emapl)
// rsi
myrsi = rsi(close, rsi_period)
//ema stop long ed ema stop short
//Ema7 messo da "massimo" a "chiusura" come target per posizioni short. Il limite è, in questo caso, sempre ema20 (più restringente - asimmetria)
// in questo t.s., lo short viene soltanto indicato come "rappresentazione grafica", non agito
mass = sma(close, emaps)
masl = sma(low, emaps)
ma200=sma(close,200)
/// Entry
strategy.entry("Long", true, when = crossover(close,mal))

rsi1 = crossunder(myrsi,70)
rsi2 = myrsi > 75
// previously, 80
st_loss_long = crossunder(close,masl)// **chiusura sotto EMA7**
target_long= crossunder(close,maf) //* Chiusura sotto EMA14*
// exits. *RSI**Long: Target if over bandamax, loss if under bandamin. Viceversa, for short
strategy.close("Long", when = rsi1, comment="crossunder RSI")
strategy.close("Long", when = rsi2, comment ="RSI MAX")
strategy.close("Long", when = st_loss_long, comment = "Stop loss")
strategy.close("Long", when = target_long, comment = "target_long" )

plot(masl, title="ma stop long", color=#363A45, linewidth= 1, style=plot.style_cross)
plot(maf, title="MA FAST", color=#FF0000,  linewidth= 1)
plot(mal, title="MA SLOW", color=#0000FF,  linewidth= 2)
plot(mass, title="ma stop short", color=#787B86,linewidth= 1, style=plot.style_cross)
plot(ma200, title="ma200", color=color.black,  linewidth= 1)
- Strategi Crossover Purata Bergerak Galileo Galilei
- AC Backtest Strategi Penunjuk Williams
- Pembelian Arah Volatiliti Rendah dengan mengambil keuntungan dan hentikan kerugian
- Strategi Stop Loss dan Take Profit Peratusan Tetap Berdasarkan Purata Bergerak
- Strategi Dagangan Kuantitatif Berdasarkan EMA Berganda dan Indeks Volatiliti Harga
- Momentum Breakout Strategi Pengesanan Dua Arah
- Super Trend LSMA Strategi Lama
- Tiga bar dan empat bar strategi pembalikan pecah
- Strategi Dagangan SMI Ergodik Berkualiti Berdasarkan Garis Purata Bergerak Eksponensial Berkualiti
- Strategi SMA dan PSAR untuk Perdagangan Tukar
- Strategi Penembusan Peralihan Purata Bergerak Berganda
- Trend Mengikut Strategi Berdasarkan Ichimoku Cloud
- Strategi Dagangan Frekuensi Tinggi Berdasarkan Bollinger Bands dan Indikator StochRSI
- Strategi imbangan pembalikan berganda
- Strategi SMA Pembalikan Purata HYE
- Strategi pembalikan purata bergerak berganda
- Strategi Dagangan Waktu Purata Bergerak Penembusan Harga Dua Arah
- Strategi Saham Breakout Bollinger
- Strategi Penembusan Osilasi Tujuh Lilin
- Strategi Pengesanan Tren Golden Dead Cross