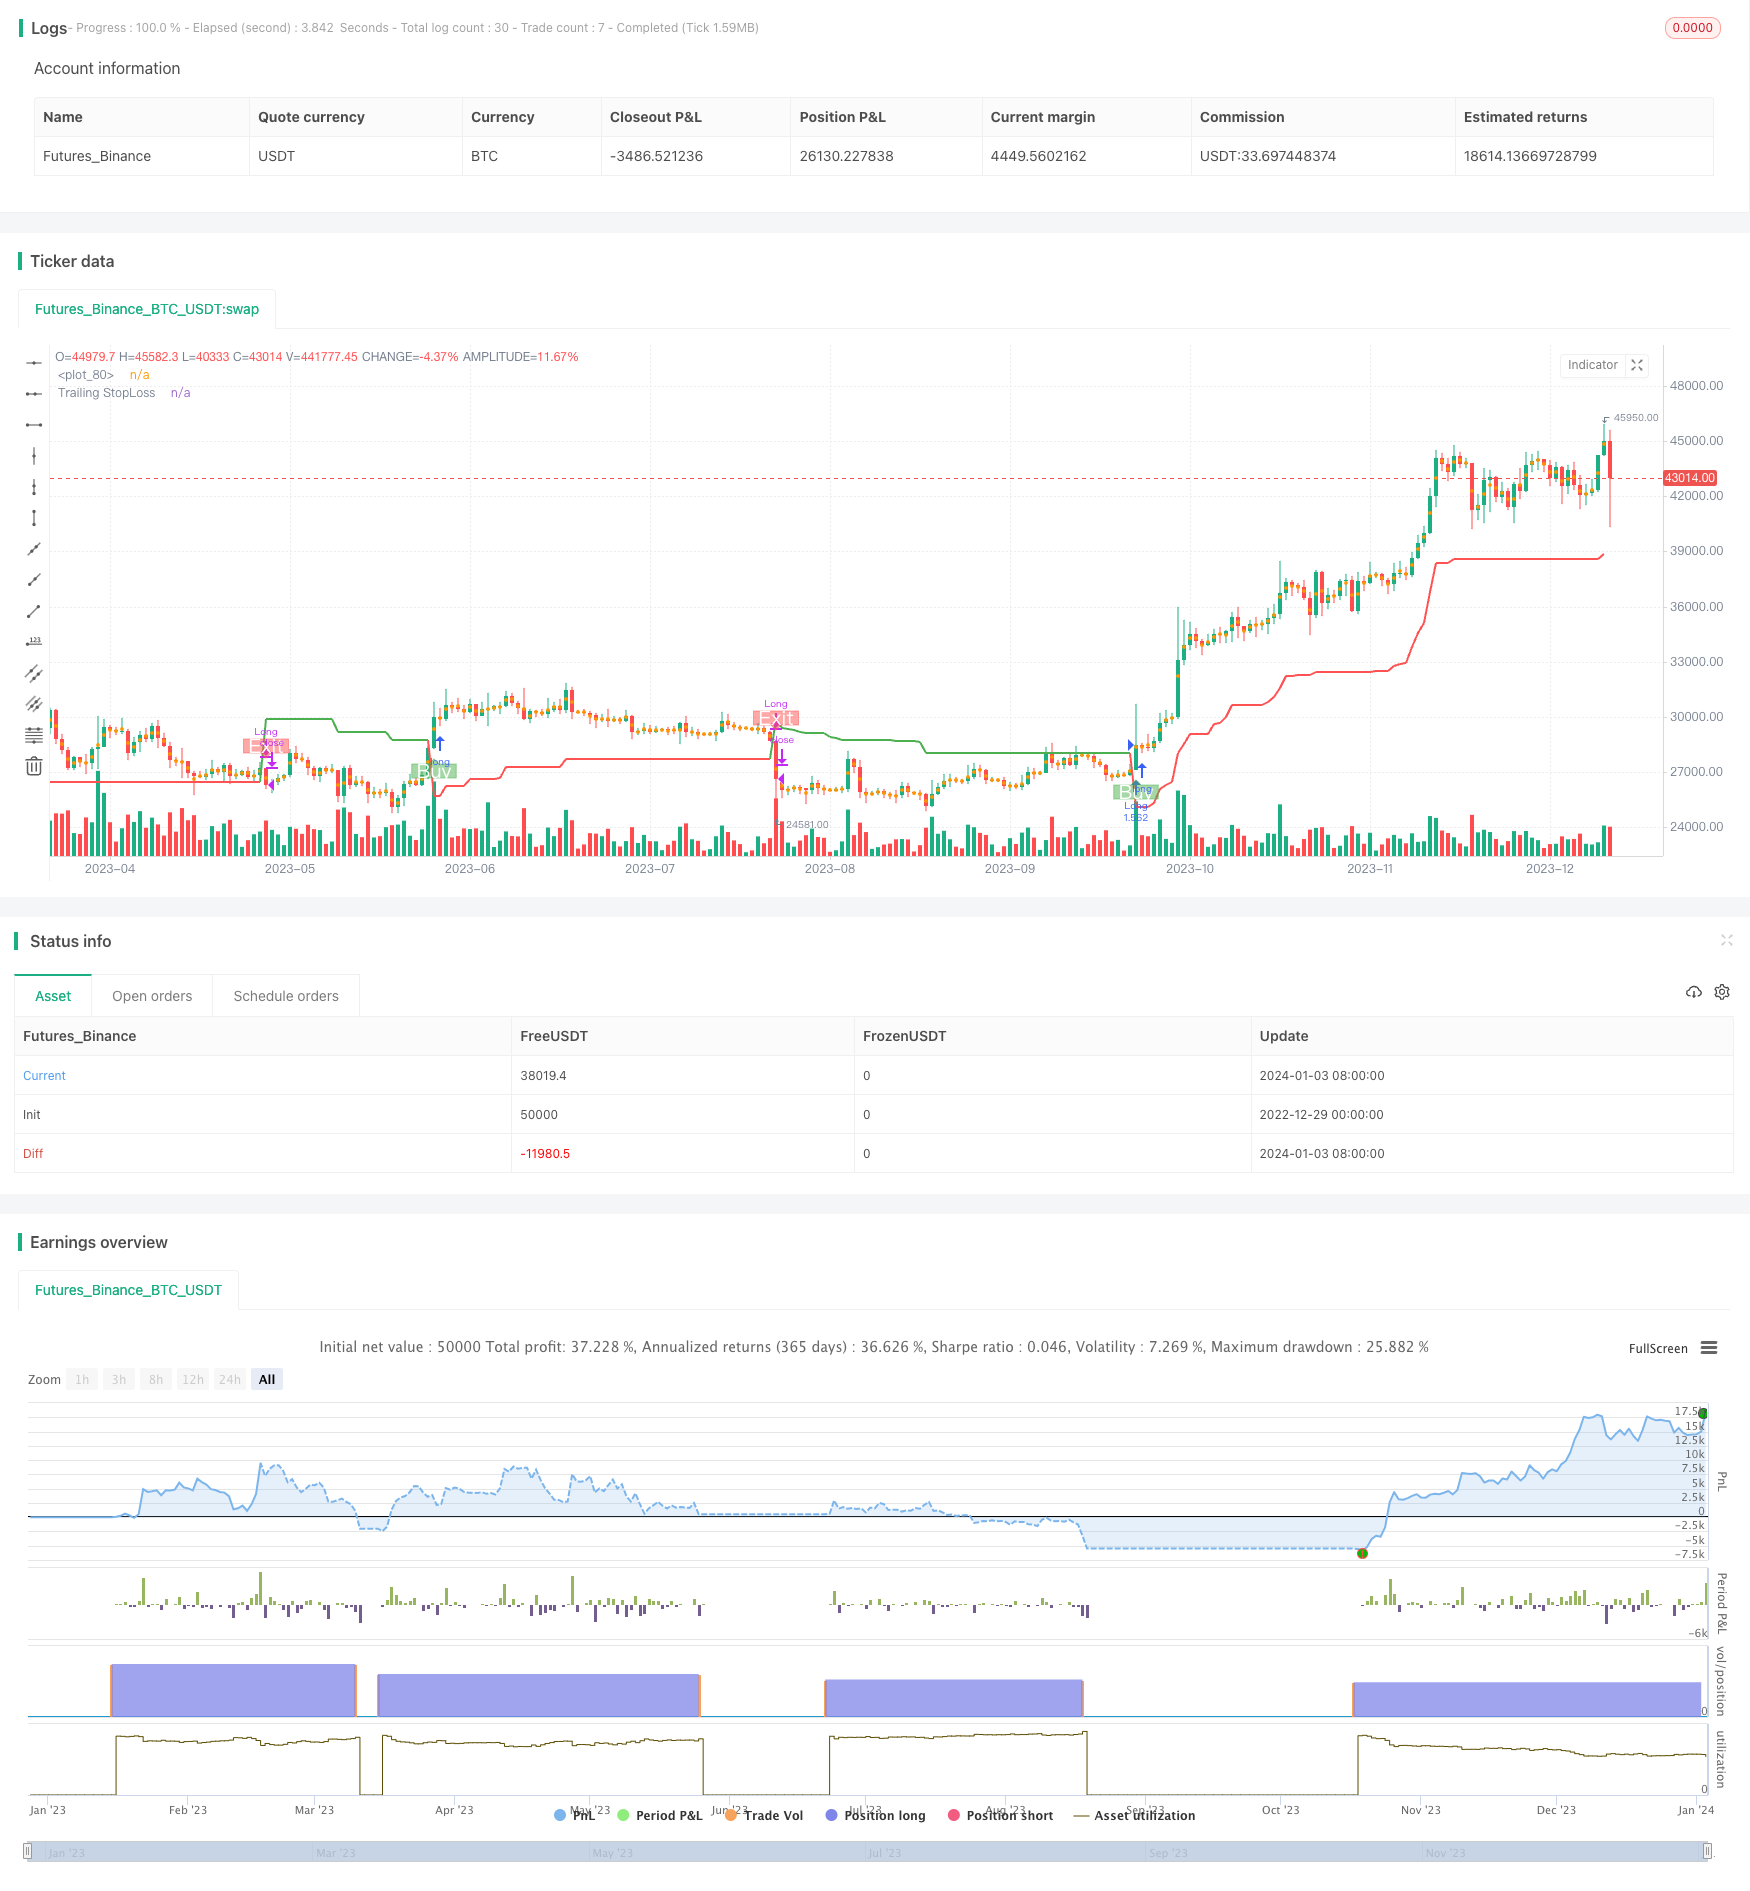
Strategi mengikut arah aliran berdasarkan Purata Julat Benar

Gambaran keseluruhan
Strategi ini adalah strategi trend-following berdasarkan purata gelombang sebenar (ATR). Ia menggunakan ATR untuk mengira nilai penunjuk dan dengan itu menentukan arah trend harga. Strategi ini pada masa yang sama menyediakan mekanisme stop loss untuk mengawal risiko.
Prinsip Strategi
Strategi ini menggunakan tiga parameter utama: Tempoh Tempoh, Peningkatan Peningkatan dan Titik Masuk / Keluar. Parameter lalai adalah ATR 14 kitaran dan 4 kali ganda.
Strategi ini mula-mula mengira harga rata-rata multi-kepala (buyavg) dan harga rata-rata kosong (sellavg), dan kemudian membandingkan harga dengan hubungan kedua-dua harga rata-rata, untuk menentukan arah trend semasa. Jika harga lebih tinggi daripada harga rata-rata kosong, maka ditentukan sebagai multi-kepala; jika harga lebih rendah daripada harga rata-rata kosong, maka ditentukan sebagai kosong.
Di samping itu, strategi ini digabungkan dengan ATR untuk menetapkan Trailing Stop Loss. Kaedahnya ialah: dengan ATR 14 pusingan berat bergerak rata-rata kalikan dengan satu kali (default 4) sebagai jarak berhenti.
Apabila penutupan kerugian dicetuskan, strategi ini akan menebus keuntungan.
Kelebihan Strategik
- Mengambil keputusan berdasarkan trend dan terus menghasilkan keuntungan
- Menggunakan ATR untuk menyesuaikan jarak hentian secara dinamik untuk mengawal risiko dengan berkesan
- Pengiraan titik jual beli mudah dan mudah difahami
Risiko dan tindakan
- Jika trend berubah, kerugian yang lebih besar boleh berlaku
- Sesuaikan kitaran dan pengganda ATR dengan betul untuk mengoptimumkan jarak henti
- WILL mengalami banyak kerugian kecil semasa gempa bumi.
- Menambah syarat penapisan untuk mengelakkan kejatuhan pasaran
- Tetapan parameter yang tidak betul boleh menyebabkan kesan politik yang buruk
- Uji optimasi parameter pelbagai kombinasi untuk mencari parameter terbaik
Arah pengoptimuman strategi
- Menambahkan petunjuk lain untuk menilai isyarat penapisan, mengelakkan keluar dan masuk dalam keadaan gegaran
- Mengoptimumkan kitaran ATR dan parameter penggandaan untuk menjadikan jarak henti lebih munasabah
- Menambah kawalan kedudukan terbuka, menyesuaikan saiz kedudukan mengikut keadaan pasaran
ringkaskan
Strategi ini secara keseluruhannya adalah strategi trend-following yang mudah dan praktikal. Ia hanya memerlukan sedikit parameter yang boleh dilaksanakan, dan dengan ATR, anda dapat menyesuaikan stop loss secara dinamik dan mengawal risiko dengan berkesan.
/*backtest
start: 2022-12-29 00:00:00
end: 2024-01-04 00:00:00
period: 1d
basePeriod: 1h
exchanges: [{"eid":"Futures_Binance","currency":"BTC_USDT"}]
*/

//@version=5
strategy('Trend Strategy by zdmre', shorttitle='Trend Strategy', overlay=true, pyramiding=0, currency=currency.USD, default_qty_type=strategy.percent_of_equity, initial_capital=10000, default_qty_value=100, commission_type=strategy.commission.percent, commission_value=0.005)
show_STOPLOSSprice = input(true, title='Show TrailingSTOP Prices')
src = input(close, title='Source')
out2 = ta.ema(src, 20)

buyavg = (close + high) / 2.02 - high * (1 - open / close) * (1 - low * open / (high * close))
sellavg = ((low + close) / 1.99 + low * (1 - low / open) * (1 - low * open / (close * high)) / 1.1 + out2 )/ 2

// === INPUT BACKTEST RANGE ===
fromMonth = input.int(defval=1, title='From Month', minval=1, maxval=12)
fromDay = input.int(defval=1, title='From Day', minval=1, maxval=31)
fromYear = input.int(defval=2021, title='From Year', minval=1970)
thruMonth = input.int(defval=1, title='Thru Month', minval=1, maxval=12)
thruDay = input.int(defval=1, title='Thru Day', minval=1, maxval=31)
thruYear = input.int(defval=2100, title='Thru Year', minval=1970)

// === INPUT SHOW PLOT ===
showDate = input(defval=true, title='Show Date Range')

// === FUNCTION EXAMPLE ===
start = timestamp(fromYear, fromMonth, fromDay, 00, 00)  // backtest start window
finish = timestamp(thruYear, thruMonth, thruDay, 23, 59)  // backtest finish window
window() => true


// === TRAILING STOP LOSS === //

ATR_Period = input(14)
ATR_Mult = input(4.0)
var float ATR_TrailSL = na
var int pos = na
atr = ta.rma (ta.tr(true), 14)
xATR = ta.atr(ATR_Period)
nLoss = ATR_Mult * xATR

iff_1 = close > nz(ATR_TrailSL[1], 0) ? close - nLoss : close + nLoss
iff_2 = close < nz(ATR_TrailSL[1], 0) and close[1] < nz(ATR_TrailSL[1], 0) ? math.min(nz(ATR_TrailSL[1]), close + nLoss) : iff_1
ATR_TrailSL := close > nz(ATR_TrailSL[1], 0) and close[1] > nz(ATR_TrailSL[1], 0) ? math.max(nz(ATR_TrailSL[1]), close - nLoss) : iff_2

iff_3 = close[1] > nz(ATR_TrailSL[1], 0) and close < nz(ATR_TrailSL[1], 0) ? -1 : nz(pos[1], 0)
pos := close[1] < nz(ATR_TrailSL[1], 0) and close > nz(ATR_TrailSL[1], 0) ? 1 : iff_3

atr_color = pos == -1 ? color.green : pos == 1 ? color.red : color.aqua
atrtrend = plot(ATR_TrailSL, 'Trailing StopLoss', atr_color, linewidth=2)

// ===  Stop Loss === //
slGroup = 'Stop Loss'
useSL = input.bool(false, title='╔══════   Enable   ══════╗', group=slGroup, tooltip='If you are using this strategy for Scalping or Futures market, we do not recommend using Stop Loss.')
SLbased = input.string(title='Based on', defval='Percent', options=['ATR', 'Percent'], group=slGroup, tooltip='ATR: Average True Range\nPercent: eg. 5%.')
multiATR = input.float(10.0, title='ATR   Mult', group=slGroup, inline='atr')
lengthATR = input.int(14, title='Length', group=slGroup, inline='atr')
SLPercent = input.float(5, title='Percent', group=slGroup) * 0.01
Shortposenter = input.bool(false, title='ShortPosition')

longStop = 0.0
shortStop = 0.0

if SLbased == 'ATR'
    longStop := ta.valuewhen(pos == 1, low, 0) - ta.valuewhen(pos == 1, ta.rma(ta.tr(true), lengthATR), 0) * multiATR
    longStopPrev = nz(longStop[1], longStop)
    longStop := close[1] > longStopPrev ? math.max(longStop, longStopPrev) : longStop

    shortStop := ta.valuewhen(pos == -1, ta.rma(ta.tr(true), lengthATR), 0) * multiATR + ta.valuewhen(pos == -1, high, 0)
    shortStopPrev = nz(shortStop[1], shortStop)
    shortStop := close[1] > shortStopPrev ? math.max(shortStop, shortStopPrev) : shortStop
    shortStop
if SLbased == 'Percent'
    longStop := strategy.position_avg_price * (1 - SLPercent)
    shortStop := strategy.position_avg_price * (1 + SLPercent)
    shortStop
exitLong  = pos == -1

// === PlotColor === //
buySignal = pos == 1 and pos[1] == -1
plotshape(buySignal, title="Long", location=location.belowbar, style=shape.labelup, size=size.normal, color=color.new(color.green,50), text='Buy', textcolor=color.white)
exitSignal = pos == -1 and pos[1] == 1
plotshape(exitSignal, title="Exit", location=location.abovebar, style=shape.labeldown, size=size.normal, color=color.new(color.red,50), text='Exit', textcolor=color.white)

hPlot = plot(ohlc4, title="", style=plot.style_circles, linewidth=0, editable = false)
longFill = (pos == 1 ? color.new(color.green,80) : na)
shortFill = (pos == -1 ? color.new(color.red,80) : na)
fill(hPlot, atrtrend,color=longFill)
fill(hPlot,atrtrend, color=shortFill)

// === Strategy === //
strategy.entry('Long', strategy.long,limit = buyavg, when=window() and pos == 1,comment="Entry: "+str.tostring(buyavg))
strategy.close('Long', when=window() and exitLong , comment='Exit: '+str.tostring(sellavg) )

if Shortposenter
    strategy.entry('Short', strategy.short, when=window() and pos== -1,comment="Entry: "+str.tostring(close))
    strategy.close('Short', when=window() and pos == 1 , comment='Exit: ')

if useSL
    strategy.exit('Stop Loss', 'Long', stop=longStop)

// === Show StopLoss Price === //
if show_STOPLOSSprice
    if pos == -1
        label ShortStop = label.new(bar_index, na, 'SL: ' + str.tostring(ATR_TrailSL), color=color.green, textcolor=color.white, style=label.style_none, yloc=yloc.abovebar, size=size.small)
        label.delete(ShortStop[1])

    if pos == 1
        label LongStop = label.new(bar_index, na, 'SL: ' + str.tostring(ATR_TrailSL), color=color.red, textcolor=color.white, style=label.style_none, yloc=yloc.belowbar, size=size.small)
        label.delete(LongStop[1])