Trend Mengikut Strategi Berasaskan Stop Loss Dinamis Dua EMA Crossover
Penulis:ChaoZhang, Tarikh: 2024-01-29 09:57:20Tag:

Ringkasan
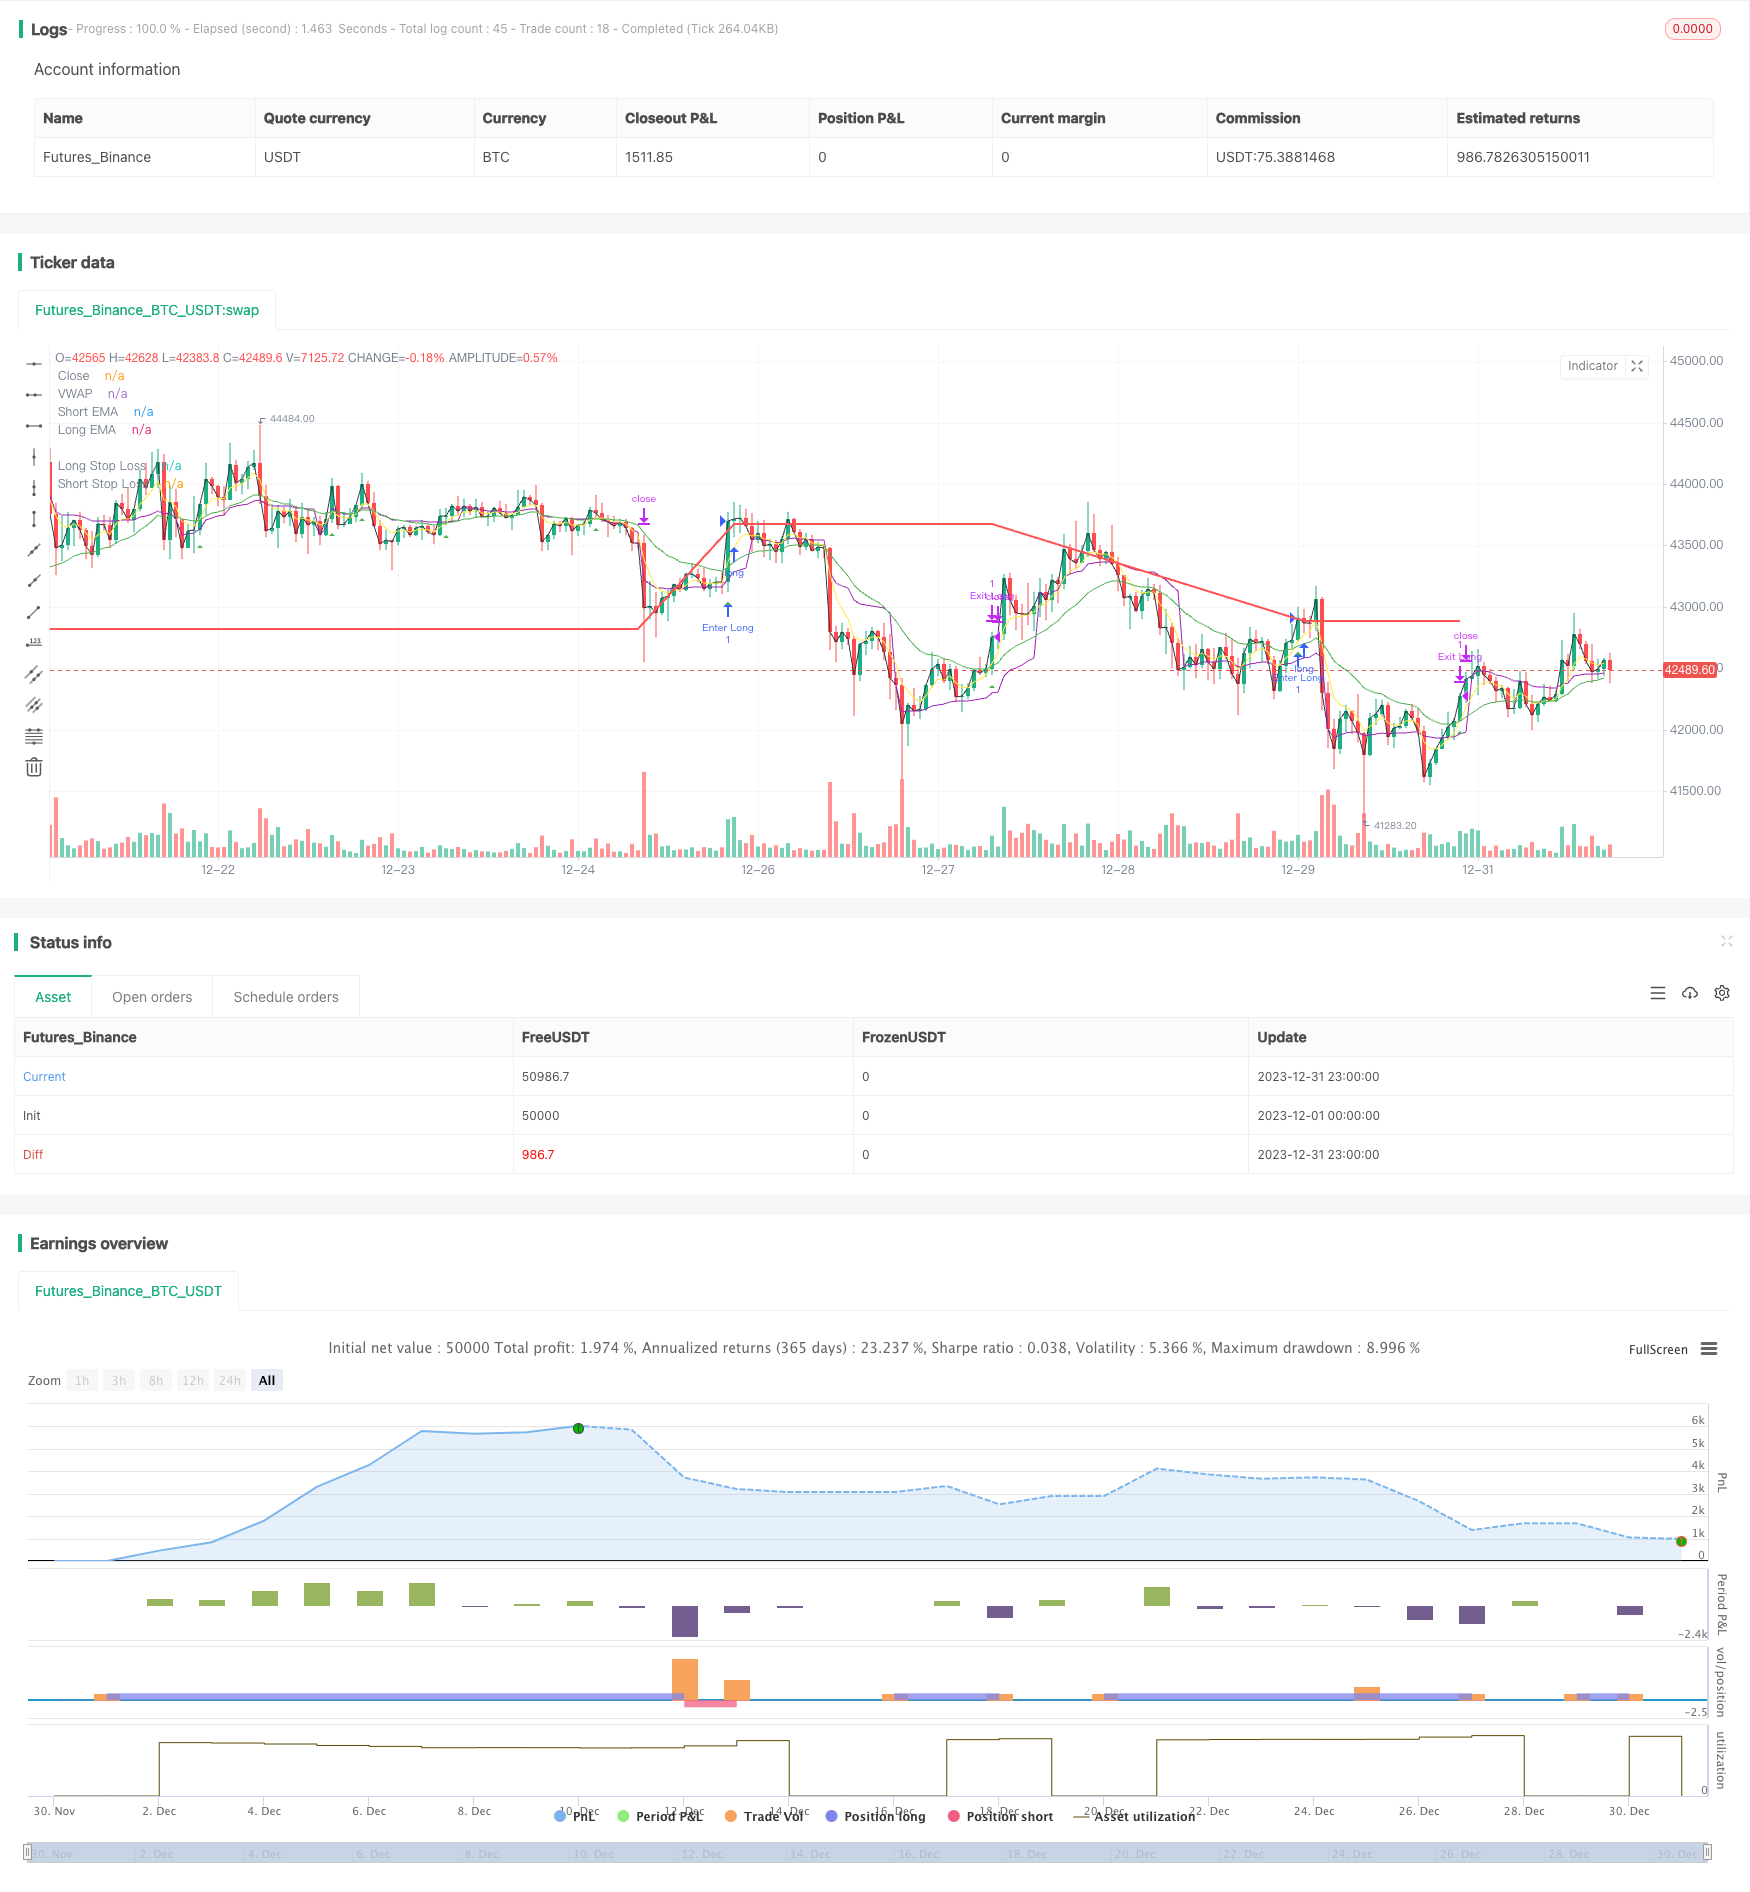
Strategi ini menggunakan salib emas dan salib mati garis EMA untuk mengikuti trend dua arah, dan menubuhkan garis stop loss dinamik untuk kedudukan panjang dan pendek untuk menangkap pergerakan trend di pasaran.
Logika Strategi
- Mengira garis EMA pantas (5 hari) dan garis EMA perlahan (20 hari)
- Pergi panjang apabila garisan pantas melintasi di atas garisan perlahan dari bawah; Pergi pendek apabila garisan pantas melintasi di bawah garisan perlahan dari atas
- Selepas masuk panjang, tetapkan stop loss dinamik pada harga masuk * (1 - peratusan stop loss panjang); Selepas masuk pendek, tetapkan stop loss dinamik pada harga masuk * (1 + peratusan stop loss pendek)
- Kedudukan keluar dengan stop loss apabila harga mencapai tahap stop loss
Analisis Kelebihan
- Garis EMA mempunyai keupayaan yang lebih kuat dalam mengesan trend.
- Stop loss dinamik bergerak bersama-sama dengan keuntungan, memaksimumkan trend menangkap keuntungan
- Penapis tambahan dengan vwap mengelakkan terperangkap dalam whipsaws dan meningkatkan kualiti isyarat
Analisis Risiko
- Sebagai trend murni mengikut strategi, ia mudah terdedah kepada pasaran yang berbeza dengan whipsaws
- Stop loss yang terlalu longgar boleh membawa kepada kerugian yang diperbesar
- Sifat ketinggalan isyarat silang EMA mungkin terlepas titik kemasukan terbaik
Peningkatan seperti pengurusan risiko berasaskan ATR, mengoptimumkan peraturan stop loss, menambah penunjuk penapis dan lain-lain boleh membantu meningkatkan strategi.
Arahan Peningkatan
- Menggabungkan penunjuk stop loss dinamik seperti ATR atau DONCH untuk menetapkan berhenti adaptif yang lebih baik
- Tambah lebih banyak penapis penunjuk seperti MACD, KDJ untuk mengelakkan perdagangan buruk
- Mengoptimumkan parameter untuk mencari kombinasi panjang EMA terbaik
- Menggunakan kaedah pembelajaran mesin untuk menemui parameter optimum
Kesimpulan
Kesimpulannya, ini adalah trend yang sangat tipikal mengikuti strategi. silang EMA berganda dengan kehilangan berhenti dinamik dapat mengunci keuntungan trend dengan berkesan. Sementara itu risiko seperti isyarat yang tertinggal dan berhenti meluas masih wujud. Melalui penyesuaian parameter, pengurusan risiko, penambahan penapis dan lain-lain, penyempurnaan lanjut boleh membawa kepada hasil yang lebih baik.
/*backtest
start: 2023-12-01 00:00:00
end: 2023-12-31 23:59:59
period: 1h
basePeriod: 15m
exchanges: [{"eid":"Futures_Binance","currency":"BTC_USDT"}]
*/

//@version=5

strategy("EMA Crossover Strategy", shorttitle="EMAC", overlay=true,calc_on_every_tick=true)

// Input parameters
shortEmaLength = input(5, title="Short EMA Length")
longEmaLength = input(20, title="Long EMA Length")
priceEmaLength = input(1, title="Price EMA Length")

// Set stop loss level with input options (optional)
longLossPerc = input.float(0.05, title="Long Stop Loss (%)",
     minval=0.0, step=0.1) * 0.01

shortLossPerc = input.float(0.05, title="Short Stop Loss (%)",
     minval=0.0, step=0.1) * 0.01

// Calculating indicators
shortEma = ta.ema(close, shortEmaLength)
longEma = ta.ema(close, longEmaLength)
//priceEma = ta.ema(close, priceEmaLength)
vwap = ta.vwap(close)

// Long entry conditions
longCondition = ta.crossover(shortEma, longEma) and close > vwap
// Short entry conditions
shortCondition = ta.crossunder(shortEma, longEma) and close > vwap

// STEP 2:
// Determine stop loss price
longStopPrice  = strategy.position_avg_price * (1 - longLossPerc)
shortStopPrice = strategy.position_avg_price * (1 + shortLossPerc)


if (longCondition)
    strategy.entry("Enter Long", strategy.long)
    strategy.exit("Exit Long",from_entry = "Enter Long",stop= longStopPrice)
plotshape(series=longCondition, title="Long Signal", color=color.green, style=shape.triangleup, location=location.belowbar)


if (shortCondition)
    strategy.entry("Enter Short", strategy.short)
    strategy.exit("Exit Short", from_entry = "Enter Short",stop = shortStopPrice)
plotshape(series=shortCondition, title="Short Signal", color=color.red, style=shape.triangledown, location=location.abovebar)

// Stop loss levels
//longStopLoss = (1 - stopLossPercent) * close
//shortStopLoss = (1 + stopLossPercent) * close

// Exit conditions
//strategy.exit("Long", from_entry="Long", loss=longStopLoss)
//strategy.exit("Short", from_entry="Short", loss=shortStopLoss)

// Plotting indicators on the chart
plot(shortEma, color=color.yellow, title="Short EMA")
plot(longEma, color=color.green, title="Long EMA")
plot(close, color=color.black, title="Close")
plot(vwap, color=color.purple, title="VWAP")

// Plot stop loss values for confirmation
plot(strategy.position_size > 0 ? longStopPrice : na,
     color=color.red, style=plot.style_line,
     linewidth=2, title="Long Stop Loss")

plot(strategy.position_size < 0 ? shortStopPrice : na,
     color=color.blue, style=plot.style_line,
     linewidth=2, title="Short Stop Loss")
// Plotting stop loss lines
//plot(longStopLoss, color=color.red, title="Long Stop Loss", linewidth=2, style=plot.style_line)
//plot(shortStopLoss, color=color.aqua, title="Short Stop Loss", linewidth=2, style=plot.style_line)
- Strategi Arbitraj Cross-Cycle Berdasarkan Pelbagai Penunjuk
- Bollinger Band breakout strategi adalah jangka panjang hanya strategi mengejar momentum
- Strategi Perdagangan Kuantitatif Kemenangan yang sempurna berdasarkan Penunjuk BB Berganda dan RSI
- Strategi Stop Loss dan Take Profit berasaskan RSI
- Strategi Penembusan Saluran Purata Bergerak
- Strategi Ujian Pemisahan Masa Tetap
- Masa dan Ruang yang dioptimumkan Multi Timeframe MACD Strategy
- Strategi Dagangan Kuantitatif Berdasarkan Stock RSI dan MFI
- Strategi Dagangan Komposit Berbilang Penunjuk
- Strategi Dagangan Jangka Pendek EMA Crossover
- Strategi Beli Box Darvas
- Strategi momentum relatif
- Trend Gelombang dan Trend Berasaskan VWMA Berikutan Strategi Quant
- Strategi Crossover Purata Bergerak
- Market Cypher Gelombang B Strategi Dagangan Automated
- Strategi Ujian Kembali Pembalikan Kunci