Berdasarkan strategi momentum balas berganda
Gambaran keseluruhan
Strategi kuantiti reversal berganda mewujudkan perdagangan trend dengan menggabungkan isyarat reversal harga dan isyarat reversal kadar turun naik. Ia terutamanya berdasarkan pada 123 bentuk penilaian titik reversal harga, sambil membantu menggunakan kadar turun naik saluran Donchian untuk menyaring isyarat palsu.
Prinsip Strategi
Bahagian harga berbalik menggunakan penghakiman bentuk 123. Yang bererti bahawa dua garis K terdahulu berbalik (naik atau turun), dan garis K ketiga berbalik (naik atau turun), oleh itu disebut 123 bentuk. Apabila harga mengalami tiga garis K berbalik, biasanya menunjukkan trend jangka pendek yang akan berbalik.
Bahagian berbalik kadar turun naik menggunakan turun naik saluran Donchian. Saluran Donchian terutama mencerminkan keluasan harga. Apabila turun naik harga meningkat, lebar saluran Donchian juga akan meluas; apabila turun naik harga berkurang, lebar saluran Donchian juga akan menyempit.
Secara keseluruhannya, strategi ini memastikan kebolehpercayaan isyarat perdagangan dan mengawal risiko melalui pengesahan terbalik dua kali, yang merupakan strategi trend yang agak mantap.
Kelebihan Strategik
- Mekanisme penapisan berganda untuk memastikan kebolehpercayaan isyarat dagangan dan mengelakkan kerosakan palsu
- Mengendalikan risiko dan mengurangkan kemungkinan kerugian
- Berpeluang untuk memegang saham dalam jangka masa panjang, mengelakkan kebisingan pasaran, dan meraih keuntungan tambahan
- Parameter optimum mempunyai ruang yang besar dan boleh disesuaikan dengan keadaan optimum
- Gaya yang unik dan berkesan dalam kombinasi dengan petunjuk teknikal yang biasa
Risiko Strategik
- Bergantung kepada optimasi parameter, parameter yang salah boleh menjejaskan prestasi strategi
- Strategi penangguhan kerugian perlu dipertingkatkan lagi, dan kawalan penarikan balik maksimum perlu diperbaiki.
- Frekuensi perdagangan mungkin rendah, tidak sesuai untuk perdagangan algoritma frekuensi tinggi
- Pilih varieti yang sesuai dan tempoh masa yang terhad
- Pembelajaran mesin dan lain-lain boleh digunakan untuk mencari parameter optimum
Arah pengoptimuman
- Menambah modul stop-loss adaptif yang dapat mengurangkan penarikan balik maksimum dengan ketara
- Menambah Indeks Jumlah Dagangan untuk Memastikan Masuk Apabila Jumlah Dagangan Menembus
- Optimumkan parameter untuk kestabilan yang terbaik
- Bereksperimen dengan pelbagai jenis dan tempoh masa untuk mencari persekitaran yang sesuai
- Cuba dengan kombinasi indikator atau strategi lain untuk mencapai 1 + 1 > 2
ringkaskan
Strategi kuantiti berbalik ganda dengan pengesahan ganda berbalik harga dan berbalik kadar turun naik, mencapai kawalan risiko yang lebih baik. Berbanding dengan satu petunjuk, ia menapis banyak bunyi dan kestabilan yang lebih baik. Dengan pengoptimuman parameter, peningkatan modul penghalang, pengenalan tenaga kuantitatif, strategi ini dapat meningkatkan kualiti isyarat dan kestabilan pendapatan. Ia sesuai untuk menjadi sebahagian daripada strategi jangka panjang menengah seperti saham, mata wang digital, dan lain-lain, dengan kombinasi yang munasabah dengan modul lain, dapat memperoleh keuntungan tambahan yang baik.
/*backtest
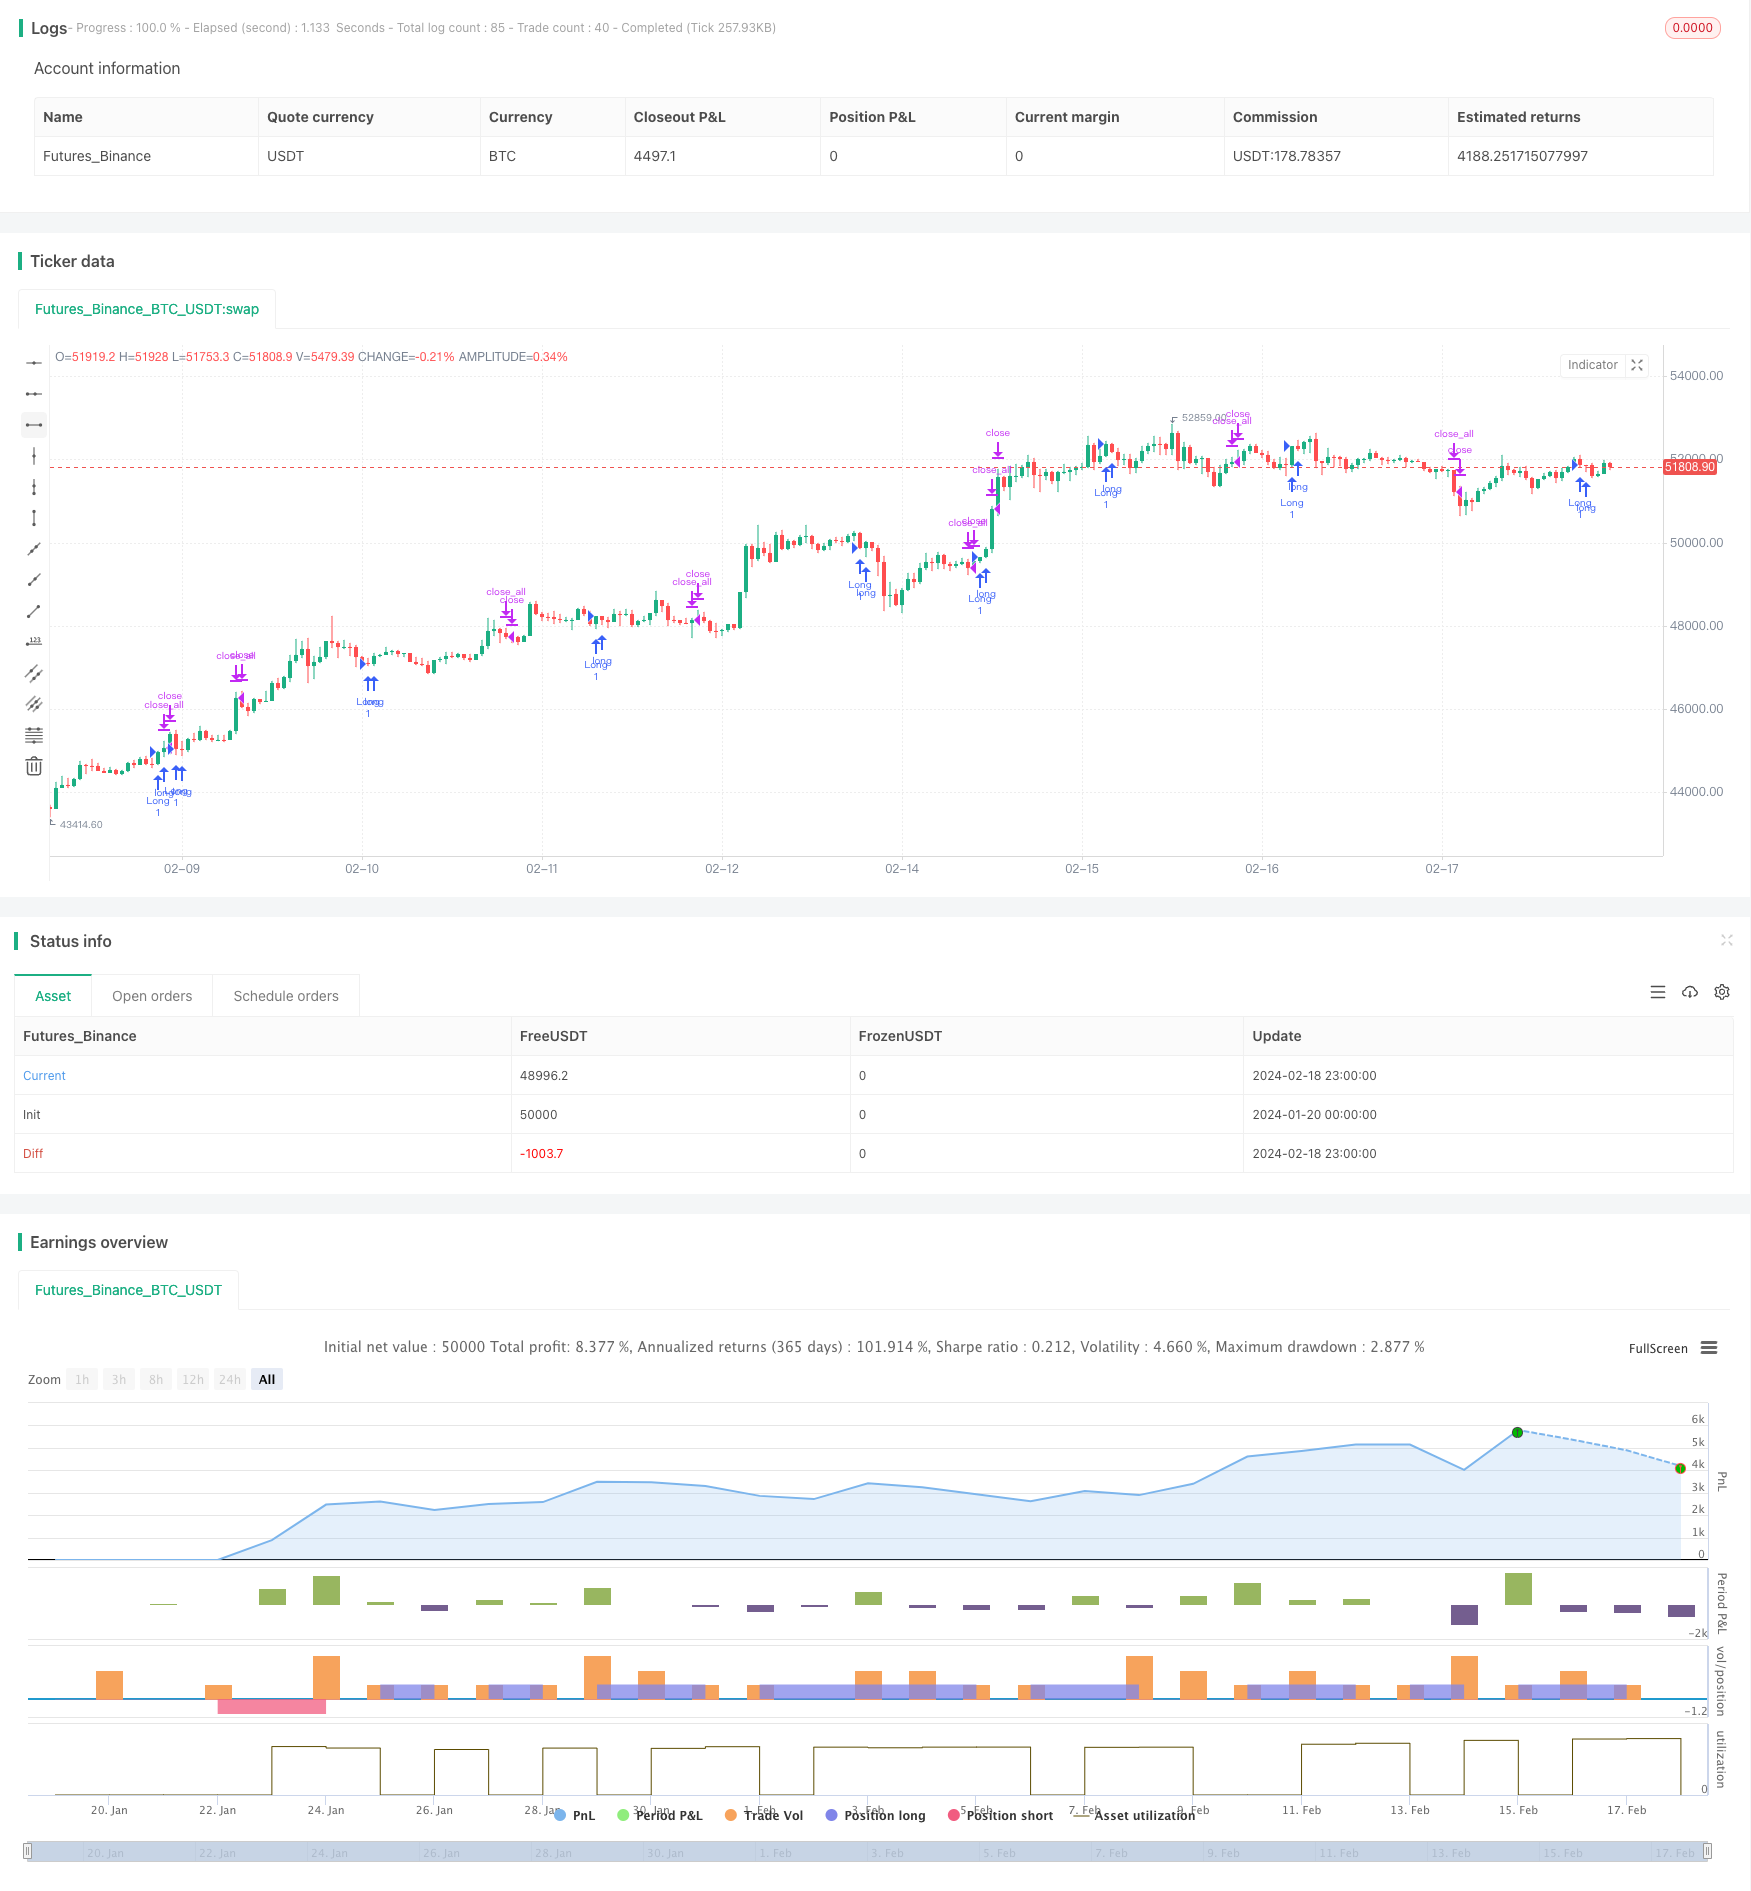
start: 2024-01-20 00:00:00
end: 2024-02-19 00:00:00
period: 1h
basePeriod: 15m
exchanges: [{"eid":"Futures_Binance","currency":"BTC_USDT"}]
*/
//@version=4
////////////////////////////////////////////////////////////
// Copyright by HPotter v1.0 06/03/2020
// This is combo strategies for get a cumulative signal.
//
// First strategy
// This System was created from the Book "How I Tripled My Money In The
// Futures Market" by Ulf Jensen, Page 183. This is reverse type of strategies.
// The strategy buys at market, if close price is higher than the previous close
// during 2 days and the meaning of 9-days Stochastic Slow Oscillator is lower than 50.
// The strategy sells at market, if close price is lower than the previous close price
// during 2 days and the meaning of 9-days Stochastic Fast Oscillator is higher than 50.
//
// Second strategy
// The Donchian Channel was developed by Richard Donchian and it could be compared
// to the Bollinger Bands. When it comes to volatility analysis, the Donchian Channel
// Width was created in the same way as the Bollinger Bandwidth technical indicator was.
//
// As was mentioned above the Donchian Channel Width is used in technical analysis to measure
// volatility. Volatility is one of the most important parameters in technical analysis.
// A price trend is not just about a price change. It is also about volume traded during this
// price change and volatility of a this price change. When a technical analyst focuses his/her
// attention solely on price analysis by ignoring volume and volatility, he/she only sees a part
// of a complete picture only. This could lead to a situation when a trader may miss something and
// lose money. Lets take a look at a simple example how volatility may help a trader:
//
// Most of the price based technical indicators are lagging indicators.
// When price moves on low volatility, it takes time for a price trend to change its direction and
// it could be ok to have some lag in an indicator.
// When price moves on high volatility, a price trend changes its direction faster and stronger.
// An indicator's lag acceptable under low volatility could be financially suicidal now - Buy/Sell signals could be generated when it is already too late.
//
// Another use of volatility - very popular one - it is to adapt a stop loss strategy to it:
// Smaller stop-loss recommended in low volatility periods. If it is not done, a stop-loss could
// be generated when it is too late.
// Bigger stop-loss recommended in high volatility periods. If it is not done, a stop-loss could
// be triggered too often and you may miss good trades.
//
// WARNING:
// - For purpose educate only
// - This script to change bars colors.
////////////////////////////////////////////////////////////
Reversal123(Length, KSmoothing, DLength, Level) =>
vFast = sma(stoch(close, high, low, Length), KSmoothing)
vSlow = sma(vFast, DLength)
pos = 0.0
pos := iff(close[2] < close[1] and close > close[1] and vFast < vSlow and vFast > Level, 1,
iff(close[2] > close[1] and close < close[1] and vFast > vSlow and vFast < Level, -1, nz(pos[1], 0)))
pos
DCW(length, smoothe) =>
pos = 0.0
xUpper = highest(high, length)
xLower = lowest(low, length)
xDonchianWidth = xUpper - xLower
xSmoothed = sma(xDonchianWidth, smoothe)
pos := iff(xDonchianWidth > xSmoothed, -1,
iff(xDonchianWidth < xSmoothed, 1, nz(pos[1], 0)))
pos
strategy(title="Combo Backtest 123 Reversal & Donchian Channel Width", shorttitle="Combo", overlay = true)
Length = input(14, minval=1)
KSmoothing = input(1, minval=1)
DLength = input(3, minval=1)
Level = input(50, minval=1)
//-------------------------
LengthDCW = input(20, minval=1)
SmootheSCW = input(22, minval=1)
reverse = input(false, title="Trade reverse")
posReversal123 = Reversal123(Length, KSmoothing, DLength, Level)
posDCW = DCW(LengthDCW, SmootheSCW)
pos = iff(posReversal123 == 1 and posDCW == 1 , 1,
iff(posReversal123 == -1 and posDCW == -1, -1, 0))
possig = iff(reverse and pos == 1, -1,
iff(reverse and pos == -1 , 1, pos))
if (possig == 1)
strategy.entry("Long", strategy.long)
if (possig == -1)
strategy.entry("Short", strategy.short)
if (possig == 0)
strategy.close_all()
barcolor(possig == -1 ? #b50404: possig == 1 ? #079605 : #0536b3 )