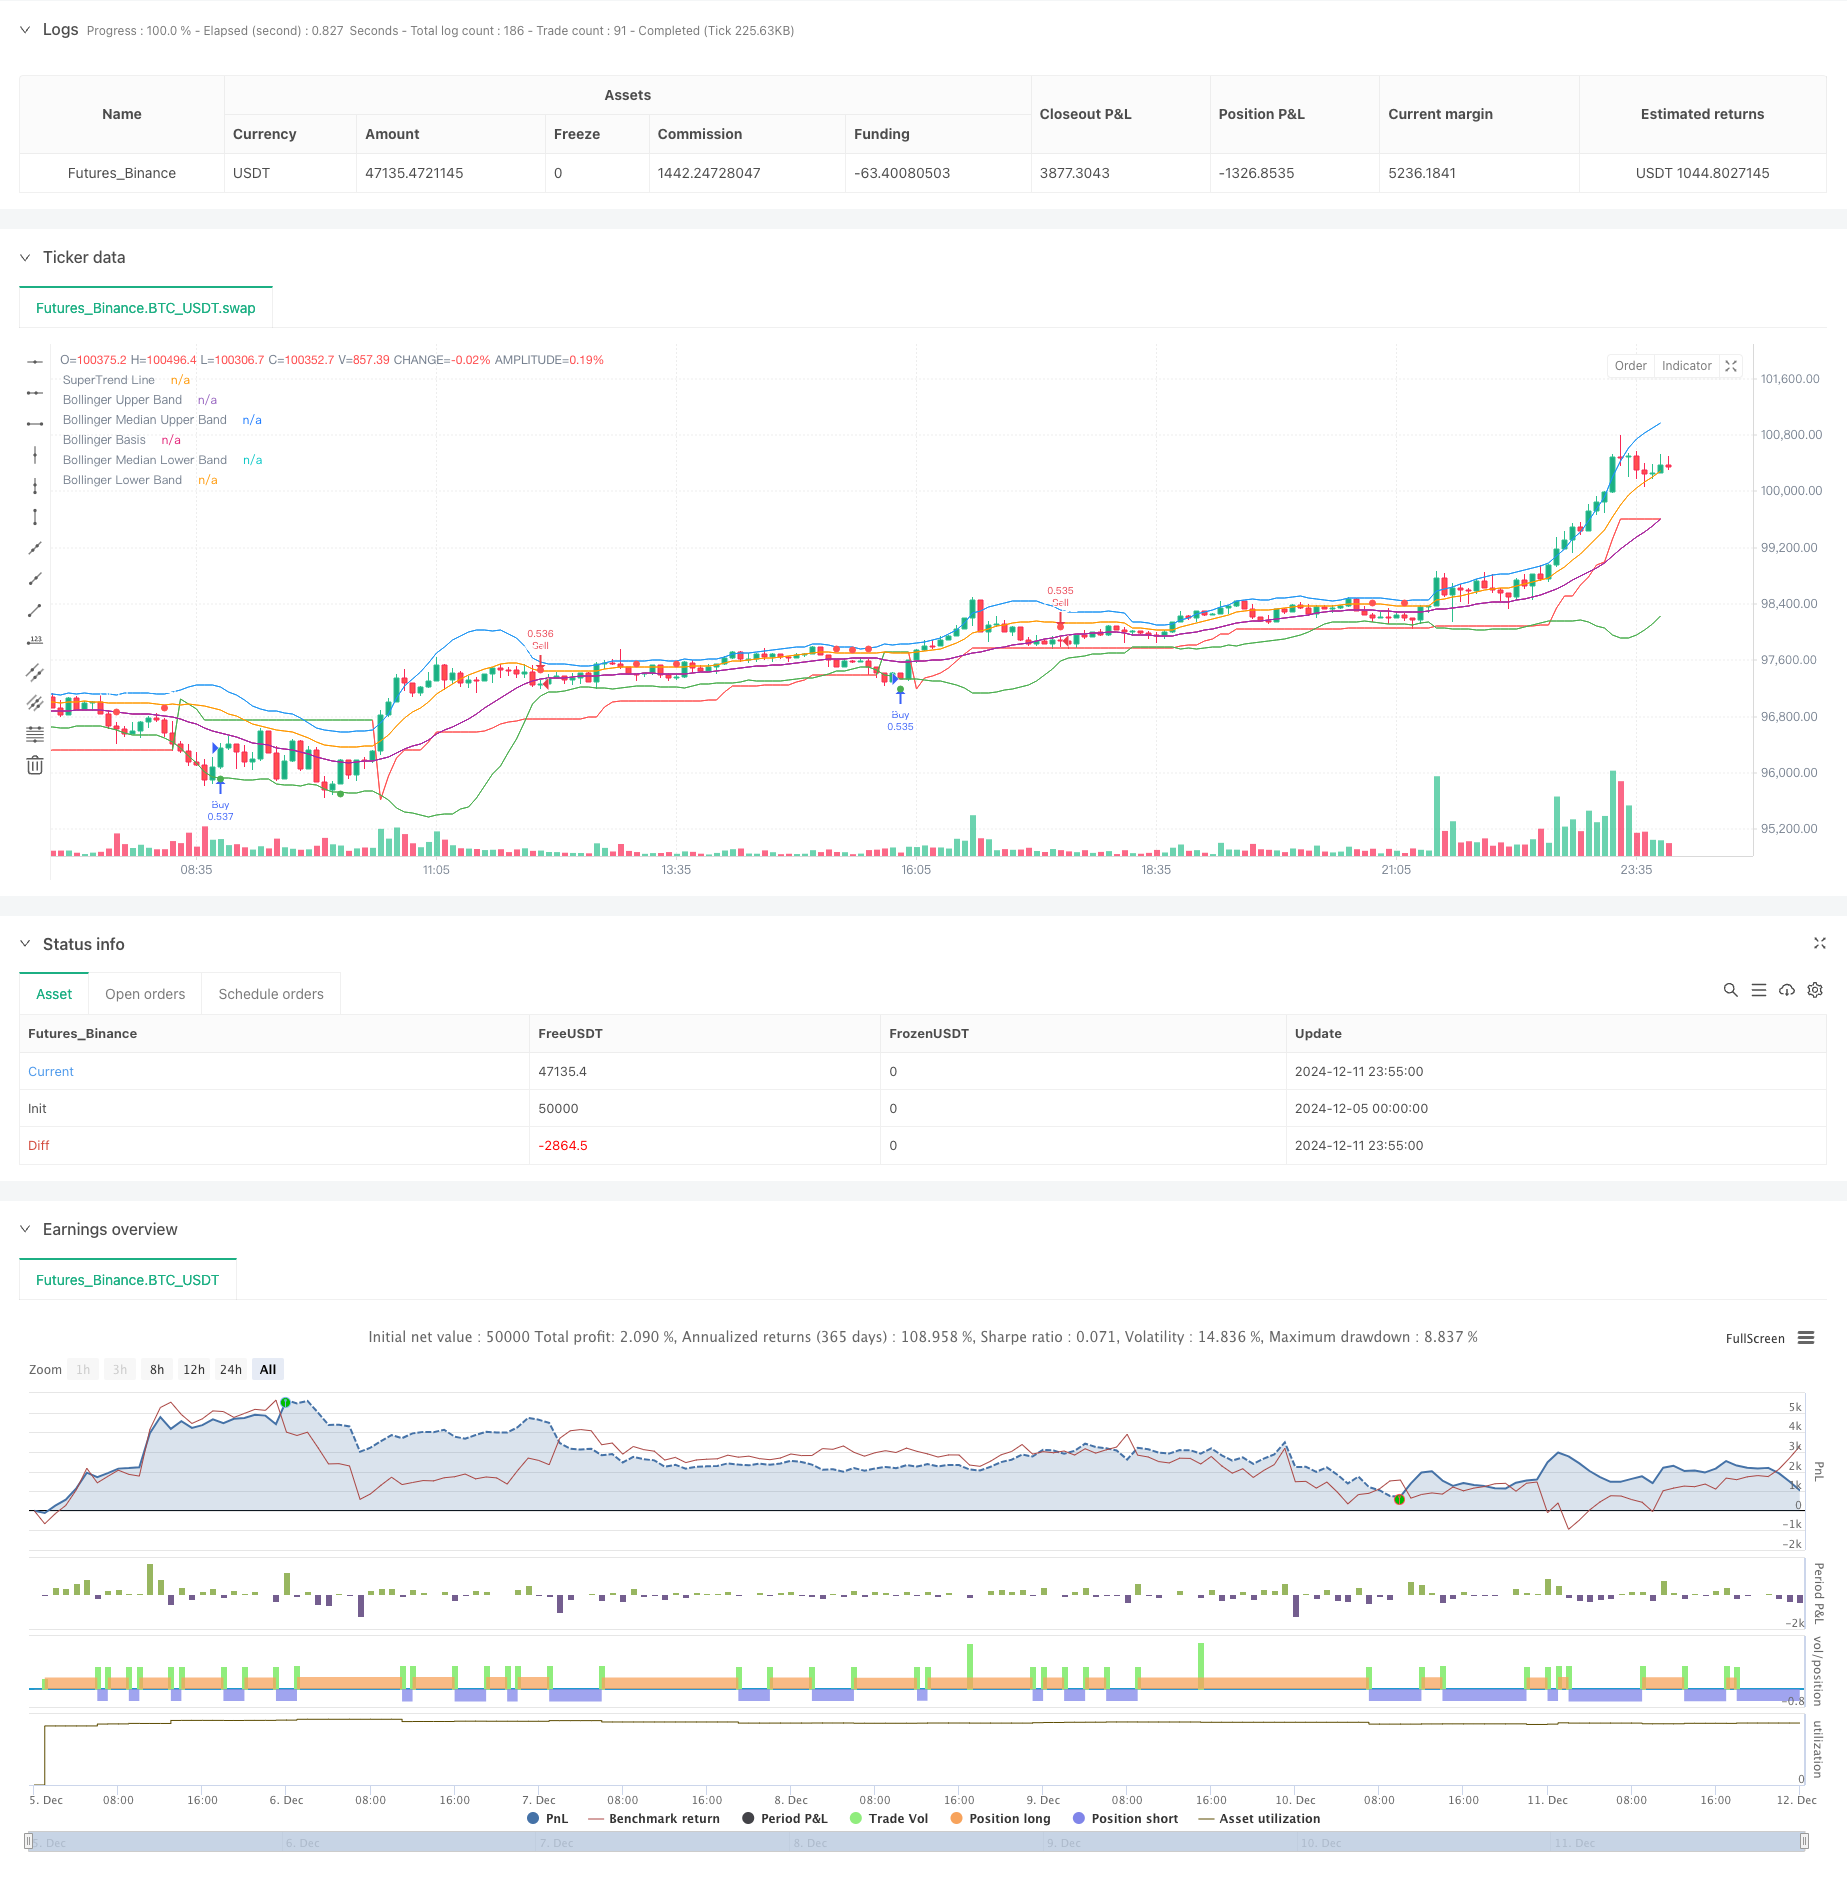
Gambaran Keseluruhan Strategi
Ini adalah strategi perdagangan pintar yang menggabungkan tanda Brin dan tanda supertrend. Strategi ini digunakan untuk mengenal pasti kawasan turun naik pasaran melalui Brin, sambil menggunakan tanda supertrend untuk mengesahkan arah trend pasaran, untuk berdagang di kedudukan kebarangkalian yang tinggi.
Prinsip Strategi
Logik teras strategi adalah berdasarkan elemen utama berikut:
- Menggunakan pita Brin 20 kitaran, bandwidth 2 perbezaan piawai, membina atas, tengah, bawah dan dua garis tengah
- Indikator Supertrend menggunakan ATR 10 kitaran dan faktor 3 kali ganda
- Isyarat masuk:
- Multicore entry: apabila harga menyentuh garis bawah Brin dan indikator super trend adalah dalam arah multiroad
- Kemasukan kosong: apabila harga menyentuh Brin Belt dan indikator Super Trend adalah arah kosong
- Isyarat keluar:
- Bermulut: Apabila harga penutupan jatuh di bawah garis trend super dan trend bertukar menjadi kosong
- Keluar kepala kosong: apabila harga penutupan menembusi garis trend super dan trend bertukar menjadi kepala
Kelebihan Strategik
- Mekanisme pengesahan dua kali meningkatkan kebolehpercayaan perdagangan: pengesanan arah aliran super trend dengan kombinasi antara pergerakan dalam Brin Belt dan mengurangkan risiko penembusan palsu
- Sesuaikan diri dengan turun naik pasaran: Brinband akan menyesuaikan bandwidth secara automatik mengikut turun naik pasaran, menjadikan strategi beradaptasi dengan baik
- Isyarat dagangan yang jelas: syarat masuk dan keluar jelas, mudah dilaksanakan dan dikesan semula
- Tetapan parameter yang fleksibel: panjang jalur Brin, ganda jalur lebar dan parameter super trend boleh disesuaikan mengikut keadaan pasaran yang berbeza
- Kesan visual yang baik: menggunakan warna dan bentuk yang berbeza untuk menandakan isyarat dagangan untuk memudahkan analisis dan pemantauan
Risiko Strategik
- Risiko pasaran goyah: Isyarat palsu yang boleh berlaku dalam keadaan goyah di pasaran
- Risiko keterbelakangan: Burin dan super trend adalah penunjuk keterbelakangan, yang mungkin terlepas titik masuk terbaik dalam pergerakan pantas
- Kepekaan parameter: Tetapan parameter yang berbeza boleh membawa kepada perbezaan besar dalam prestasi strategi Strategi ini disyorkan untuk mengawal risiko seperti berikut:
- Tetapkan kedudukan stop loss untuk mengawal risiko tunggal
- Pertimbangkan untuk berhenti berdagang semasa turun naik yang teruk
- Parameter yang dioptimumkan secara berkala untuk menyesuaikan diri dengan perubahan pasaran
Arah pengoptimuman strategi
- Menambah penapis kadar turun naik pasaran:
- Menyesuaikan saiz kedudukan dalam keadaan turun naik yang tinggi
- Menambah penapis ATR untuk mengelakkan dagangan semasa turun naik berlebihan
- Meningkatkan mekanisme penangguhan kerugian:
- Pemasangan stop loss dinamik berdasarkan lebar jalur Brin
- Reka bentuk strategi hentian dinamik yang digabungkan dengan kecenderungan super
- Menambah penapis masa:
- Mengelakkan data penting
- Tetapkan parameter yang berbeza untuk tempoh masa yang berbeza
- Mekanisme pengesahan isyarat yang dioptimumkan
- Tingkatkan pengesahan volum
- Pertimbangkan untuk meningkatkan indikator kekuatan trend
ringkaskan
Ini adalah sistem perdagangan lengkap yang menggabungkan analisis teknikal dengan petunjuk klasik, yang dapat berprestasi baik dalam trend dan turun naik melalui sinergi Brin Belt dan Super Trend. Reka bentuk visual strategi dan fleksibiliti parameter menjadikannya sangat praktikal. Dengan arah pengoptimuman yang disarankan, kestabilan dan keuntungan strategi dapat ditingkatkan lagi.
/*backtest
start: 2024-12-05 00:00:00
end: 2024-12-12 00:00:00
period: 5m
basePeriod: 5m
exchanges: [{"eid":"Futures_Binance","currency":"BTC_USDT"}]
*/

//@version=5
strategy("Bollinger Band & SuperTrend Strategy (Standard Chart)", overlay=true, default_qty_type=strategy.percent_of_equity, default_qty_value=100)

// Bollinger Bands Settings
length_bb = input.int(20, title="Bollinger Band Length")
mult_bb = input.float(2.0, title="Bollinger Band Multiplier")
[bb_upper, bb_basis, bb_lower] = ta.bb(close, length_bb, mult_bb)

// Median Bands
bb_median_upper = (bb_upper + bb_basis) / 2
bb_median_lower = (bb_lower + bb_basis) / 2

// SuperTrend Settings
atr_length = input.int(10, title="ATR Length")
factor = input.float(3.0, title="SuperTrend Factor")

// SuperTrend Calculation based on standard chart OHLC data
[supertrend, direction] = ta.supertrend(factor, atr_length)

// Plotting Bollinger Bands
plot(bb_upper, color=color.red, title="Bollinger Upper Band")
plot(bb_median_upper, color=color.orange, title="Bollinger Median Upper Band")
plot(bb_basis, color=color.blue, title="Bollinger Basis")
plot(bb_median_lower, color=color.purple, title="Bollinger Median Lower Band")
plot(bb_lower, color=color.green, title="Bollinger Lower Band")

// Plotting SuperTrend
supertrend_color = direction > 0 ? color.green : color.red
plot(supertrend, color=supertrend_color, style=plot.style_line, title="SuperTrend Line")

// Customizable Signal Shape Inputs
buy_shape = input.string("shape_triangle_up", title="Buy Signal Shape", options=["shape_triangle_up", "shape_circle", "shape_cross", "shape_diamond", "shape_flag"])
sell_shape = input.string("shape_triangle_down", title="Sell Signal Shape", options=["shape_triangle_down", "shape_circle", "shape_cross", "shape_diamond", "shape_flag"])

// Entry Conditions
buy_condition = ta.crossover(low, bb_lower) and direction > 0
sell_condition = ta.crossunder(high, bb_upper) and direction < 0

// Exit Conditions
exit_buy_condition = ta.crossunder(close, supertrend) and direction < 0
exit_sell_condition = ta.crossover(close, supertrend) and direction > 0

// Strategy Logic
if buy_condition
    strategy.entry("Buy", strategy.long)
if sell_condition
    strategy.entry("Sell", strategy.short)

if exit_buy_condition
    strategy.close("Buy")
if exit_sell_condition
    strategy.close("Sell")

// Plot Buy Signal Shape
plotshape(series=buy_condition, title="Buy Signal", location=location.belowbar, color=color.green, style=buy_shape, text="BUY", textcolor=color.white)

// Plot Sell Signal Shape
plotshape(series=sell_condition, title="Sell Signal", location=location.abovebar, color=color.red, style=sell_shape, text="SELL", textcolor=color.white)