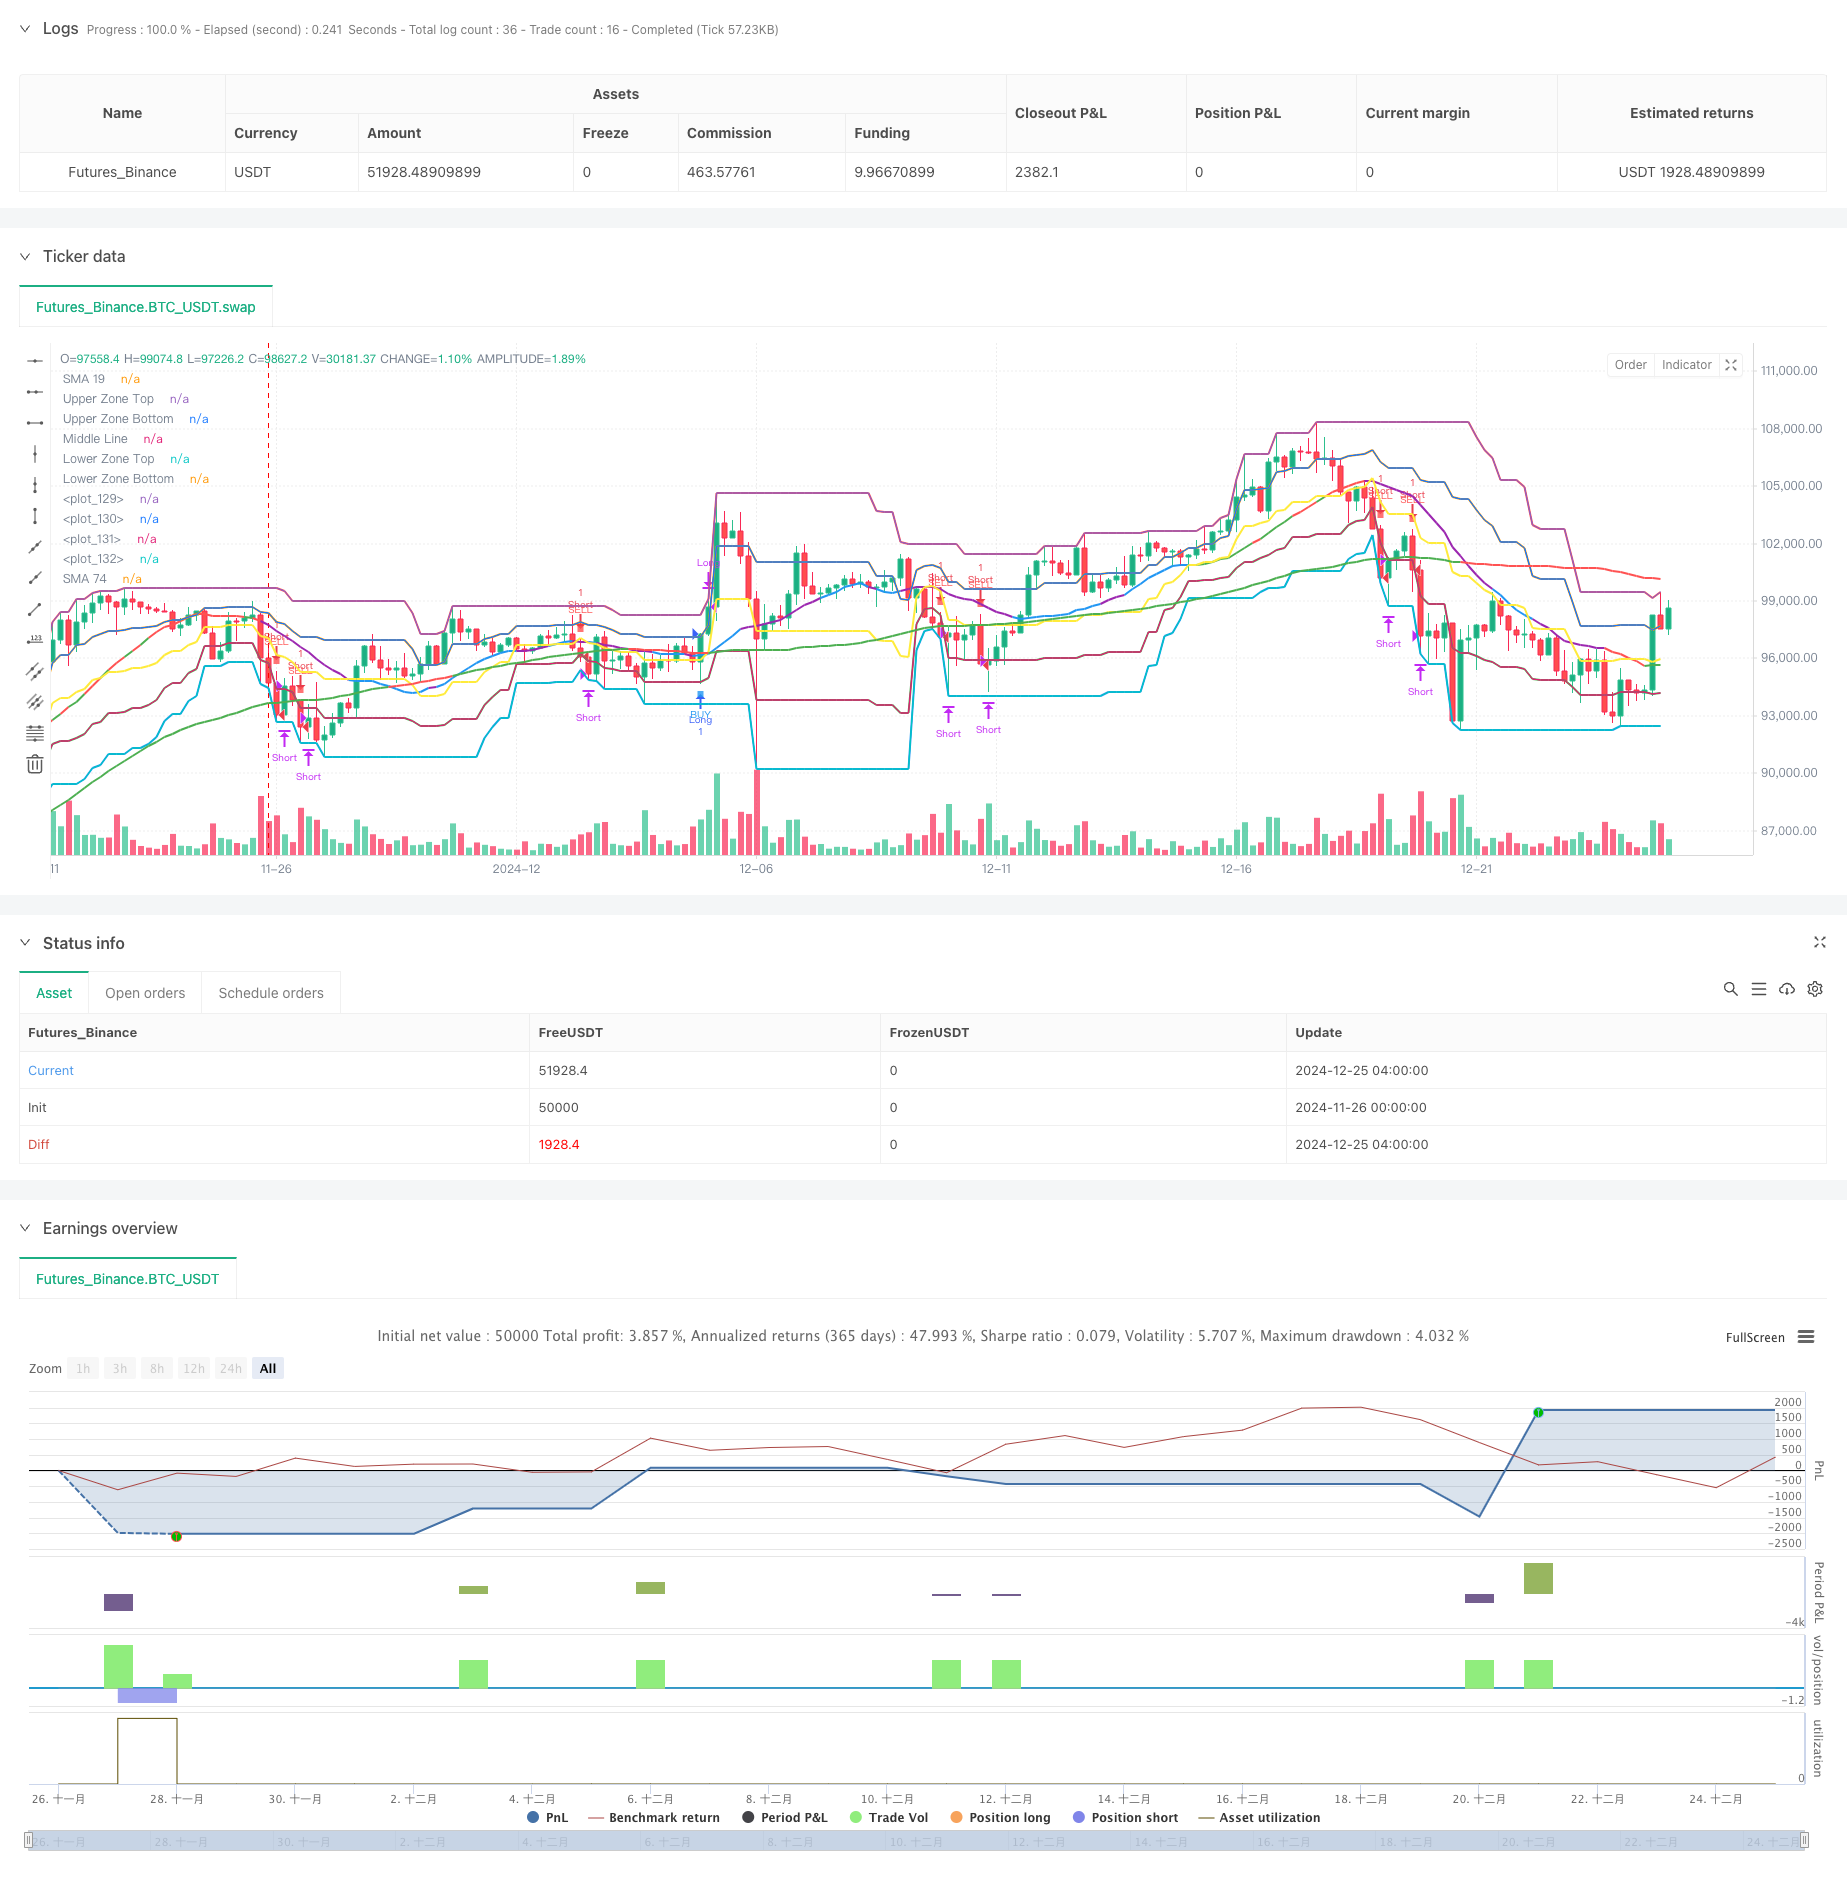
Gambaran keseluruhan
Strategi ini adalah sistem perdagangan yang mengikuti trend yang menggabungkan pelbagai purata bergerak ((SMA) dan penunjuk rawak ((KDJ)). Dengan menetapkan jarak harga dan keadaan penilaian trend, perdagangan dilakukan apabila trend pasaran jelas. Strategi ini menggunakan mekanisme berhenti rugi dinamik, menyesuaikan pengurusan pegangan mengikut pergerakan pasaran, melindungi keuntungan dan tidak keluar terlalu awal.
Prinsip Strategi
Strategi ini berdasarkan komponen teras berikut:
- Sistem dua hala: menggunakan 19 kitaran dan 74 kitaran SMA sebagai alat penilaian trend
- Julat harga: Bahagikan julat harga kepada 5 peringkat untuk menilai kekuatan dan kelemahan pasaran
- Indikator rawak: menggunakan 60 kitaran penunjuk rawak untuk membuat keputusan overbought dan oversold
- Pengesahan trend: menilai trend yang berterusan melalui pergerakan 3 garis K berturut-turut
- Syarat kemasukan: harga menembusi 74 kitaran SMA dan berada dalam julat harga yang sesuai
- Mekanisme Stop Loss: Menggunakan Stop Loss Tracking, Keluar Dari Perlawanan Apabila Trend Berubah
Kelebihan Strategik
- Integriti Sistem: Menggabungkan trend tracking dan indikator momentum untuk memberikan analisis pasaran yang menyeluruh
- Pengurusan risiko: Menggunakan pelbagai mekanisme hentian, termasuk hentian keras dan hentian yang dikesan
- Ketabahan: menyesuaikan diri dengan keadaan pasaran yang berbeza dengan menyesuaikan parameter
- Trend Capture: Mengambil Trend Jangka Menengah dan Jangka Panjang dan Mengelakkan Isyarat Palsu
- Pengurusan pegangan: menyesuaikan pegangan mengikut keadaan pasaran yang dinamik, meningkatkan kecekapan penggunaan dana
Risiko Strategik
- Risiko pasaran goyah: Peluang perdagangan yang kerap berlaku di pasaran setapak
- Risiko tergelincir: kemungkinan tergelincir yang lebih besar dalam keadaan pantas
- Kepekaan parameter: Kombinasi parameter yang berbeza boleh membawa kepada perbezaan besar dalam prestasi strategi
- Ketergantungan kepada keadaan pasaran: strategi yang lebih baik dalam pasaran yang menunjukkan trend
- Risiko pengurusan dana: Operasi penuh mungkin membawa risiko pengeluaran yang lebih besar
Arah pengoptimuman strategi
- Memperkenalkan penunjuk kadar turun naik: Pertimbangkan untuk menambah penunjuk ATR untuk menyesuaikan kedudukan hentian secara dinamik
- Optimumkan masa kemasukan: anda boleh menambah pengesahan jumlah pesanan untuk meningkatkan ketepatan kemasukan
- Pengurusan wang yang lebih baik: Cadangan untuk menambah modul pengurusan kedudukan, menyesuaikan kedudukan mengikut dinamik risiko
- Menambah penilaian keadaan pasaran: penapis isyarat perdagangan dengan penambahan penunjuk kekuatan trend
- Peningkatan mekanisme hentian kerugian: peratusan pengesanan hentian kerugian boleh dipertimbangkan untuk meningkatkan fleksibiliti
ringkaskan
Strategi ini membina sistem perdagangan yang lengkap dengan gabungan pelbagai petunjuk teknikal, dengan keupayaan untuk mengesan trend yang baik dan mekanisme pengurusan risiko. Walaupun mungkin menghadapi cabaran dalam keadaan pasaran tertentu, dengan pengoptimuman dan penyempurnaan yang berterusan, strategi ini dijangka dapat mengekalkan prestasi yang stabil dalam keadaan pasaran yang berbeza.
/*backtest
start: 2024-11-26 00:00:00
end: 2024-12-25 08:00:00
period: 4h
basePeriod: 4h
exchanges: [{"eid":"Futures_Binance","currency":"BTC_USDT"}]
*/

//@version=5
strategy("Purple SMA Strategy", overlay=true)

// === INPUTS ===
zoneLength = input.int(20, "Price Zone Length", minval=5)
tickSize = input.float(1.0, "Tick Size for Hard Stop")
hardStopTicks = input.int(50, "Hard Stop Loss in Ticks")

// === CALCULATE ZONES ===
h = ta.highest(high, zoneLength)
l = ta.lowest(low, zoneLength)
priceRange = h - l
lvl5 = h
lvl4 = l + (priceRange * 0.75)  // Orange line
lvl3 = l + (priceRange * 0.50)  // Yellow line
lvl2 = l + (priceRange * 0.25)  // Green line
lvl1 = l

// === INDICATORS ===
sma19 = ta.sma(close, 19)
sma74 = ta.sma(close, 74)

// === CANDLE COLOR CONDITIONS ===
isGreenCandle = close > open
isRedCandle = close < open

// === CONTINUOUS TREND DETECTION ===
isThreeGreenCandles = close > open and close[1] > open[1] and close[2] > open[2]
isThreeRedCandles = close < open and close[1] < open[1] and close[2] < open[2]

var bool inGreenTrend = false
var bool inRedTrend = false

// Update trends
if isThreeGreenCandles
    inGreenTrend := true
    inRedTrend := false
if isThreeRedCandles
    inRedTrend := true
    inGreenTrend := false
if (inGreenTrend and isRedCandle) or (inRedTrend and isGreenCandle)
    inGreenTrend := false
    inRedTrend := false

// === STOCHASTIC CONDITIONS ===
k = ta.stoch(close, high, low, 60)
d = ta.sma(k, 10)
isOverbought = d >= 80
isOversold = d <= 20
stochUp = d > d[1]
stochDown = d < d[1]

// === SMA COLOR LOGIC ===
sma19Color = if isOverbought and stochUp
    color.green
else if isOverbought and stochDown
    color.red
else if isOversold and stochUp
    color.green
else if isOversold and stochDown
    color.red
else if stochUp
    color.blue
else if stochDown
    color.purple
else
    color.gray

sma74Color = sma74 < sma19 ? color.green : color.red

// === CROSSING CONDITIONS ===
crossUpSMA = ta.crossover(close, sma74)
crossDownSMA = ta.crossunder(close, sma74)

// === ENTRY CONDITIONS ===
buyCondition = crossUpSMA and close > lvl4
sellCondition = crossDownSMA and close < lvl2

// === POSITION MANAGEMENT ===
var float stopLevel = na
var bool xMode = false

// Entry and Stop Loss
if buyCondition
    strategy.entry(id="Long", direction=strategy.long)
    stopLevel := close - (hardStopTicks * tickSize)
    xMode := false

if sellCondition
    strategy.entry(id="Short", direction=strategy.short)
    stopLevel := close + (hardStopTicks * tickSize)
    xMode := false

// Update stops based on X's
if strategy.position_size != 0 and (inGreenTrend or inRedTrend)
    xMode := true
    if strategy.position_size > 0  // Long position
        stopLevel := low
    else  // Short position
        stopLevel := high

// Exit logic
if strategy.position_size > 0  // Long position
    if low <= stopLevel
        strategy.close(id="Long")
    else if xMode and not (inGreenTrend or inRedTrend)
        strategy.close(id="Long")

if strategy.position_size < 0  // Short position
    if high >= stopLevel
        strategy.close(id="Short")
    else if xMode and not (inGreenTrend or inRedTrend)
        strategy.close(id="Short")

// === PLOTTING ===
plot(sma19, "SMA 19", color=sma19Color, linewidth=2)
plot(sma74, "SMA 74", color=sma74Color, linewidth=2)
plot(lvl5, "Upper Zone Top", color=color.red, linewidth=2)
plot(lvl4, "Upper Zone Bottom", color=color.orange, linewidth=2)
plot(lvl3, "Middle Line", color=color.yellow, linewidth=2)
plot(lvl2, "Lower Zone Top", color=color.green, linewidth=2)
plot(lvl1, "Lower Zone Bottom", color=color.blue, linewidth=2)

// Plot X signals
plotshape(inGreenTrend, title="Bullish Line", style=shape.xcross, location=location.belowbar, color=color.white, size=size.tiny)
plotshape(inRedTrend, title="Bearish Line", style=shape.xcross, location=location.abovebar, color=color.white, size=size.tiny)

// Zone fills
var p1 = plot(lvl5, display=display.none)
var p2 = plot(lvl4, display=display.none)
var p3 = plot(lvl2, display=display.none)
var p4 = plot(lvl1, display=display.none)
fill(p1, p2, color=color.new(color.red, 90))
fill(p3, p4, color=color.new(color.green, 90))

// Plot entry signals
plotshape(buyCondition, title="Buy", style=shape.square, location=location.belowbar, color=color.new(color.blue, 20), size=size.tiny, text="BUY", textcolor=color.blue)
plotshape(sellCondition, title="Sell", style=shape.square, location=location.abovebar, color=color.new(color.red, 20), size=size.tiny, text="SELL", textcolor=color.red)