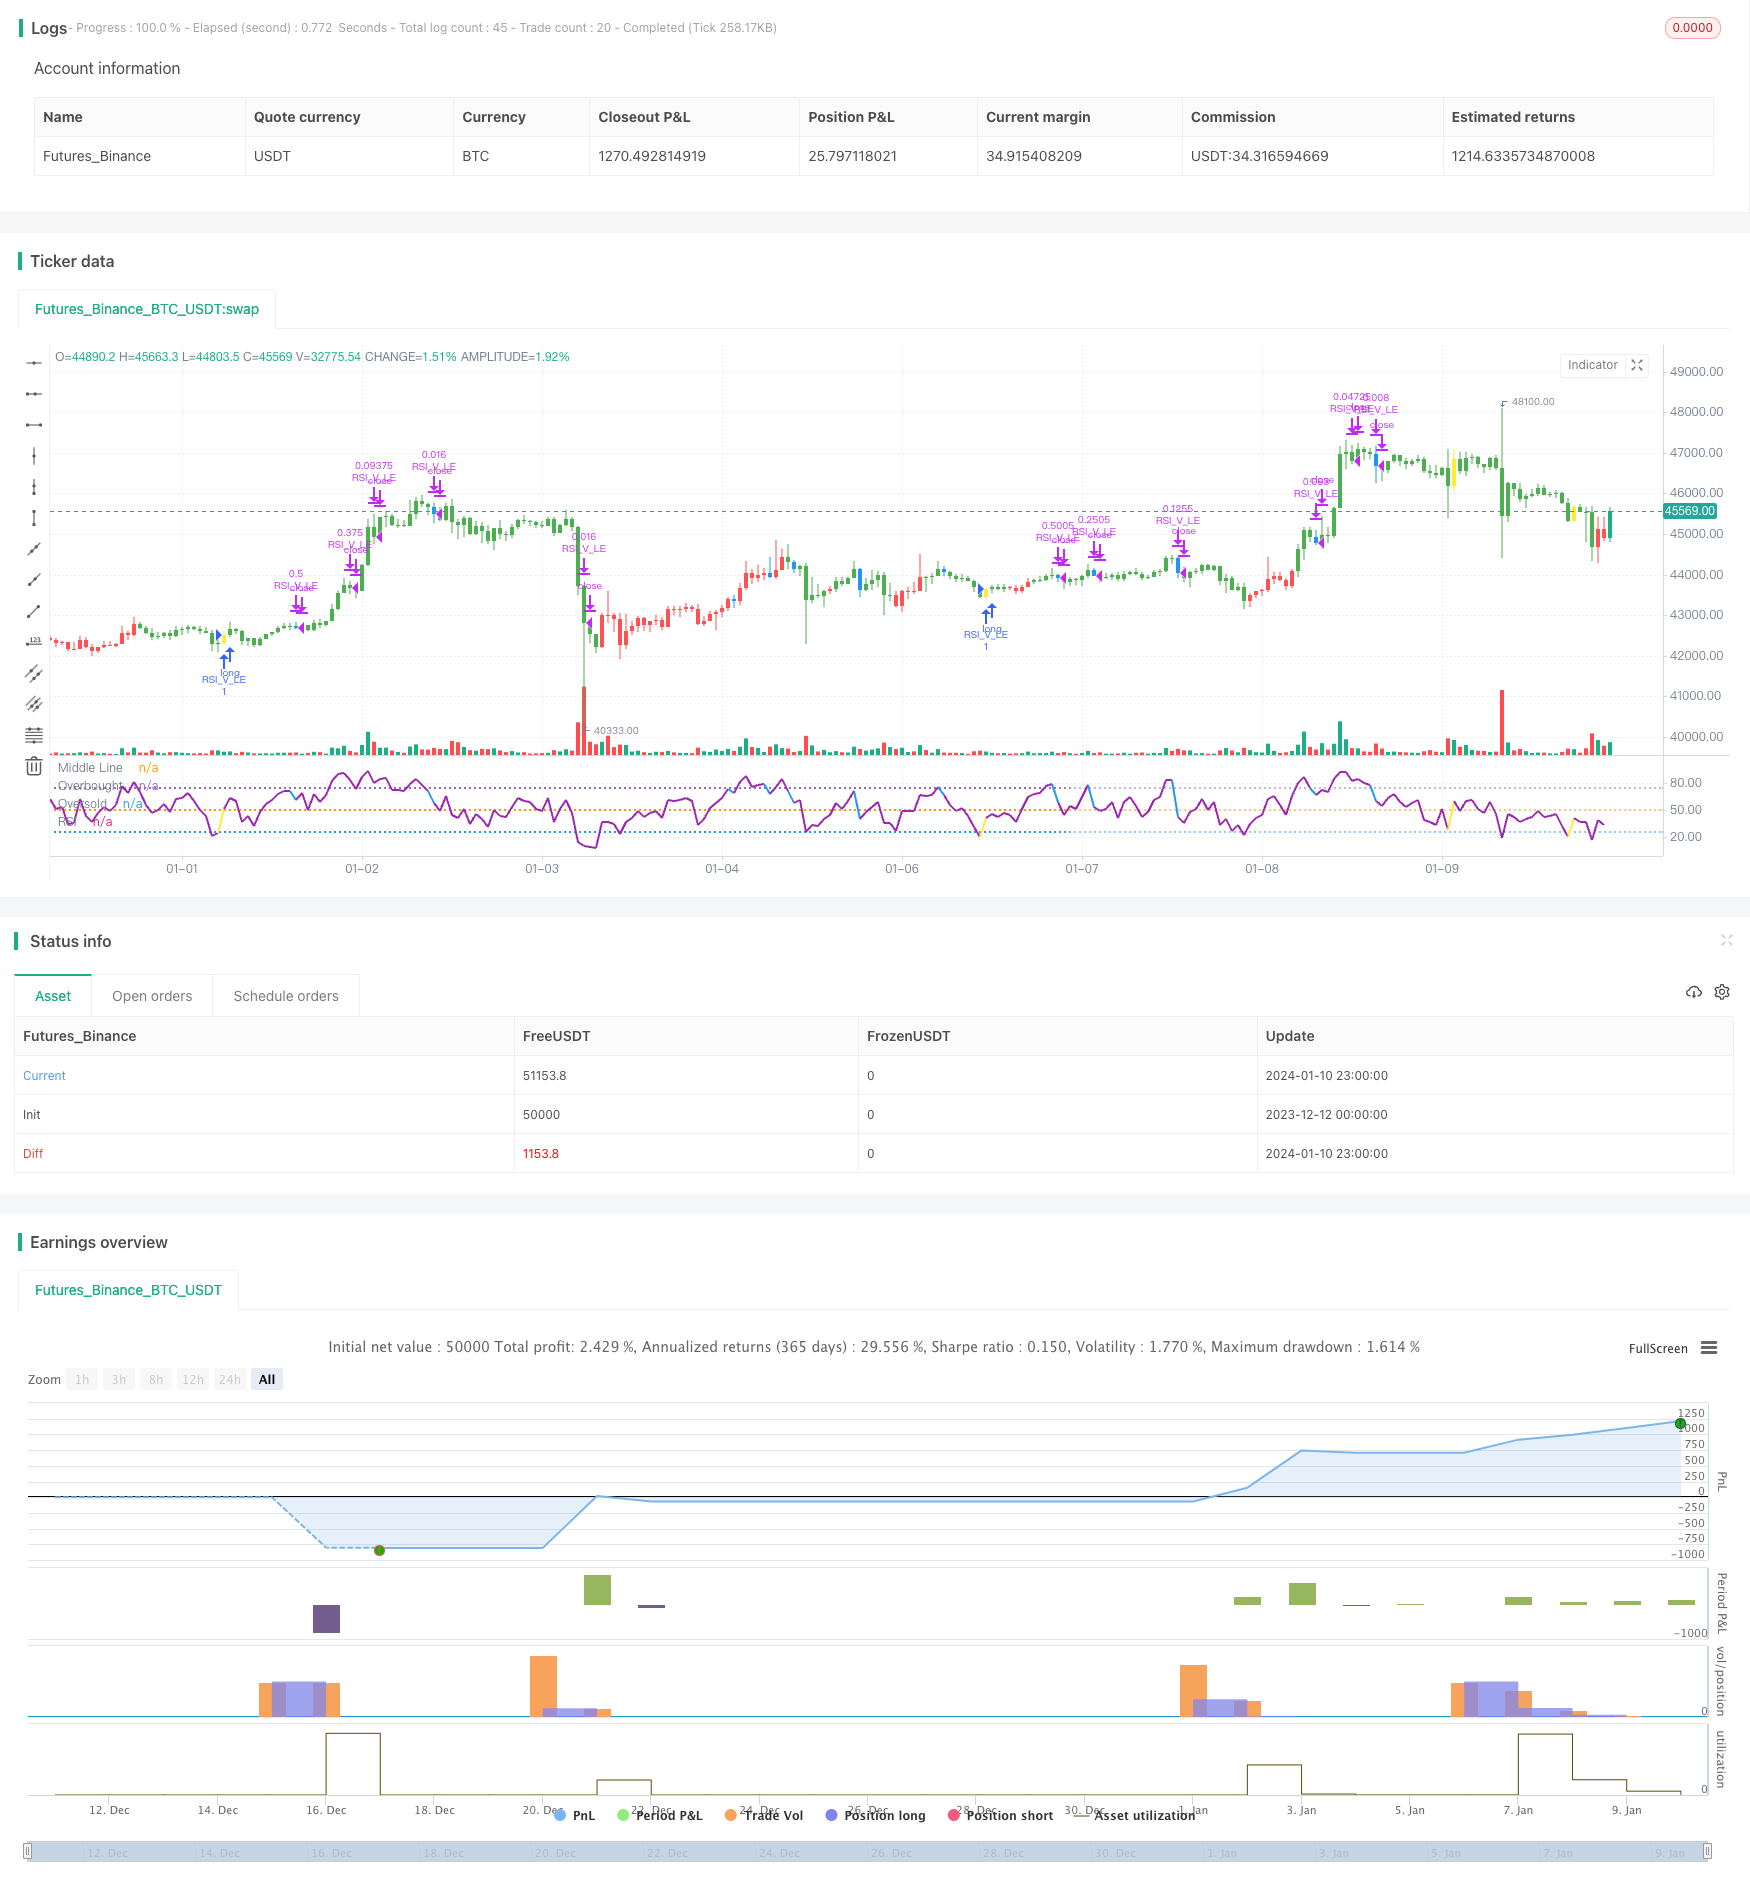
Estratégia de negociação de balanço de padrão em forma de V do RSI
Autora:ChaoZhang, Data: 2024-01-12 13:52:55Tags:

Resumo
Esta estratégia baseia-se no padrão em forma de V formado pelo indicador RSI, combinado com filtros EMA, para desenvolver uma estratégia de negociação lucrativa de curto prazo confiável.
Estratégia lógica
- Utilize a EMA de 20 dias acima da EMA de 50 dias como julgamento da tendência de alta a longo prazo
- O RSI forma um padrão em forma de V, indicando oportunidades de rebote de sobrevenda
- Baixo da barra anterior é inferior ao anterior 2 bares
baixo - O RSI da barra atual é superior ao RSI das 2 barras anteriores
- Baixo da barra anterior é inferior ao anterior 2 bares
- O RSI cruza acima de 30 como o sinal de conclusão do padrão em forma de V para ir longo
- Estabelecer um stop loss a 8% abaixo do preço de entrada
- Quando o RSI cruzar 70, começar a fechar posições e mover o stop loss para o preço de entrada
- Quando o RSI cruzar 90, feche 3/4 posições
- Quando o RSI for abaixo de 10 / stop loss desencadeado, feche todas as posições
Análise das vantagens
- Usar a EMA para julgar a direcção geral do mercado, evitar a negociação contra a tendência
- O padrão em forma de V do RSI capta oportunidades de reversão da média quando a sobrevenda
- Mecanismos múltiplos de stop loss para controlar os riscos
Análise de riscos
- Uma forte tendência de queda pode acarretar perdas irreparáveis
- Os sinais RSI em forma de V podem dar sinais falsos, levando a perdas desnecessárias
Orientações de otimização
- Otimizar os parâmetros do RSI para encontrar padrões em forma de V mais confiáveis
- Incorporar outros indicadores para aumentar a fiabilidade dos sinais de reversão
- Refinar a estratégia de stop loss, equilíbrio entre a prevenção da agressividade excessiva e a pontualidade da stop loss
Resumo
Esta estratégia integra o filtro EMA e o julgamento do padrão em forma de RSI V para formar uma estratégia de negociação de curto prazo confiável. Pode efetivamente aproveitar as oportunidades de rebote quando sobrevendido. Com otimização contínua em parâmetros e modelos, melhorando os mecanismos de stop loss, esta estratégia pode ser ainda melhorada em estabilidade e lucratividade.
/*backtest
start: 2023-12-12 00:00:00
end: 2024-01-11 00:00:00
period: 1h
basePeriod: 15m
exchanges: [{"eid":"Futures_Binance","currency":"BTC_USDT"}]
*/

// This source code is subject to the terms of the Mozilla Public License 2.0 at https://mozilla.org/MPL/2.0/
// © mohanee

//@version=4
//strategy("RSI V Pattern", overlay=true)
strategy(title="RSI V Pattern", overlay=false )

//Strategy Rules
//ema20 is above ema50  --- candles are colored  green on the chart
//RSI value sharply coming up which makes a V shape ,  colored in yellow on the chart
//RSI V pattern should occur from below 30

len = input(title="RSI Period", minval=1, defval=5)
stopLoss = input(title="Stop Loss %", minval=1, defval=8)

myRsi = rsi(close,len)

longEmaVal=ema(close,50)
shortEmaVal=ema(close,20)

//plot emas
//plot(longEmaVal, title="Long EMA" ,linewidth=2, color=color.orange, trackprice=true)
//plot(shortEmaVal, title="Short EMA" ,linewidth=2, color=color.green, trackprice=true)


longCondition =  ema(close,20)>ema(close,50)   and (low[1]<low[2] and  low[1]<low[3]) and (myRsi>myRsi[1] and myRsi>myRsi[2] ) and crossover(myRsi,30) //  (   and myRsi<60)

//(myRsi<60 and myRsi>30)  and myRsi>myRsi[1] and (myRsi[1]<myRsi[2]  or  myRsi[1]<myRsi[3]) and (myRsi[2]<30)  and (myRsi[3]<30 and myRsi[4]>=30)


barcolor(shortEmaVal>longEmaVal?color.green:color.red)
//longCondition = crossover(sma(close, 14), sma(close, 28))
barcolor(longCondition?color.yellow:na)
strategy.entry("RSI_V_LE", strategy.long, when=longCondition )
//stoploss value at 10%
stopLossValue=strategy.position_avg_price -  (strategy.position_avg_price*stopLoss/100)
//stopLossValue=valuewhen(longCondition,low,3)


//takeprofit at RSI highest  reading
//at RSI75 move the stopLoss to entry price
moveStopLossUp=strategy.position_size>0 and crossunder(myRsi,70)
barcolor(moveStopLossUp?color.blue:na)
stopLossValue:=crossover(myRsi,70) ? strategy.position_avg_price:stopLossValue

//stopLossValue:=moveStopLossUp?strategy.position_avg_price:stopLossValue
rsiPlotColor=longCondition ?color.yellow:color.purple
rsiPlotColor:= moveStopLossUp ?color.blue:rsiPlotColor
plot(myRsi, title="RSI", linewidth=2, color=rsiPlotColor)
//longCondition?color.yellow:#8D1699)
hline(50, title="Middle Line", linestyle=hline.style_dotted)
obLevel = hline(75, title="Overbought", linestyle=hline.style_dotted)
osLevel = hline(25, title="Oversold", linestyle=hline.style_dotted)
fill(obLevel, osLevel, title="Background", color=#9915FF, transp=90)


//when RSI crossing down 70 , close 1/2 position and move stop loss to average entry price
strategy.close("RSI_V_LE",  qty=strategy.position_size*1/2, when=strategy.position_size>0 and crossunder(myRsi,70))

//when RSI reaches high reading 90 and crossing down close 3/4 position
strategy.close("RSI_V_LE",  qty=strategy.position_size*3/4, when=strategy.position_size>0 and crossunder(myRsi,90))


//close everything when Rsi goes down below to 10 or stoploss hit
//just keeping RSI cross below 10 , can work as stop loss , which also keeps you long in the trade ... however sharp declines could  make large loss
//so I combine RSI goes below 10 OR stoploss hit  , whichever comes first - whole posiition closed
longCloseCondition=crossunder(myRsi,10)  or close<stopLossValue
strategy.close("RSI_V_LE", qty=strategy.position_size,when=longCloseCondition )
Mais.
- Tendência seguindo uma estratégia baseada na diferença da média móvel
- Estratégia de negociação de inércia de inversão quantitativa de dois fatores
- Estratégia de ruptura da EMA
- Estratégia Quant Trading Baseada na Nuvem Ichimoku
- Estratégia de reversão de tendências criptográficas baseada em pontos altos e baixos de oscilação pivot
- Estratégia de negociação do oscilador de saldo final
- Estratégia de cruzamento da média móvel exponencial
- Estratégia dupla de obtenção de lucros da EMA Golden Cross
- Estratégia de regressão dinâmica do Pai Natal
- Estratégia de negociação quantitativa do índice RSI
- A estratégia de volatilidade do ATR para o impulso de ruptura
- Estratégia de Momentum RSI Baseada em Interpolação Polinomial
- Estratégia combinada de inversão de impulso
- Estratégia de Hash Ribbons BTC
- Estratégia de cruzamento de médias móveis de vários níveis para mestres quant
- Estratégia de negociação de reversão do rácio de volume
- Estratégia de cruzamento da média móvel ponderada do momento dinâmico
- Estratégia de negociação de poder de touro
- Estratégia de acompanhamento da média móvel diária para o valor do ouro
- Média móvel de vários prazos combinada com as horas de negociação Estratégia quantitativa de negociação