Visão geral
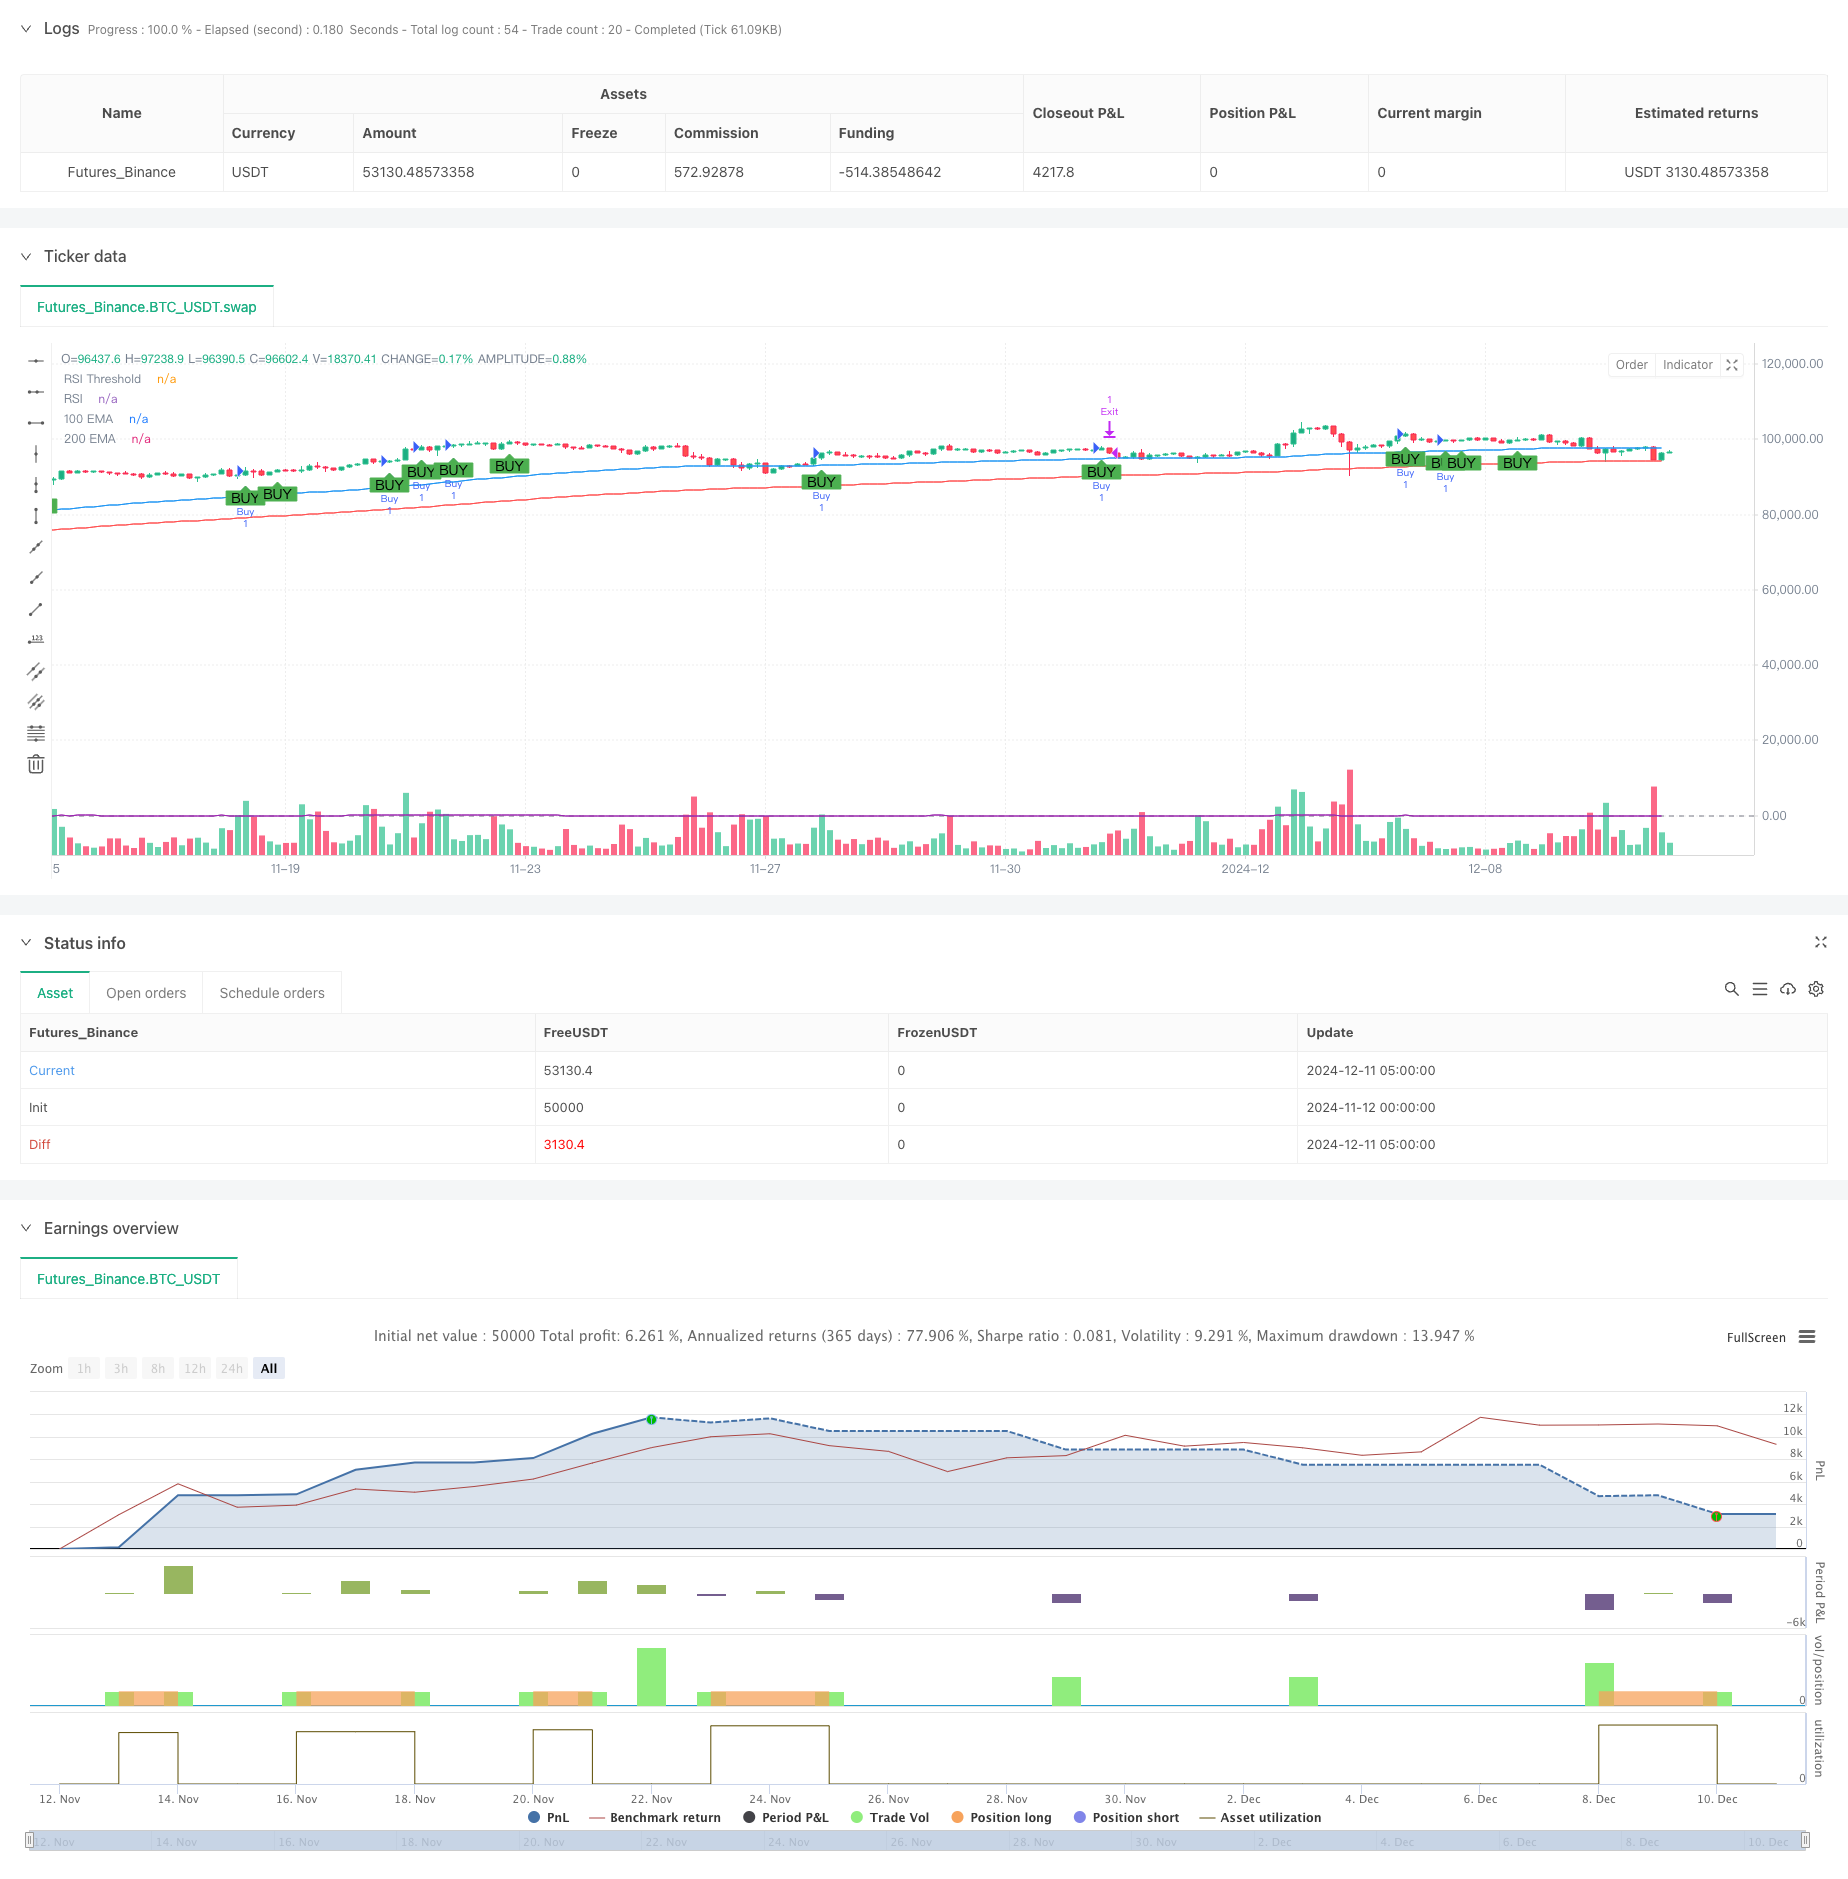
A estratégia é um sistema de acompanhamento de tendências baseado em análise técnica, combinando um sistema de linhas médias, um indicador de dinâmica RSI e um indicador de volatilidade ATR para confirmar oportunidades de negociação por meio de verificação de múltiplos sinais. A estratégia usa linhas médias de cruzamento de múltiplos períodos para determinar a tendência do mercado, ao mesmo tempo em que combina a dinâmica RSI para confirmar a força dos preços e, finalmente, usa a configuração de stop loss e ganho de vantagem do ATR dinâmico para formar um sistema de negociação completo.
Princípio da estratégia
A lógica central da estratégia inclui três partes-chave:
- Julgamento de tendências: Use a média móvel indexada (EMA) de 100 ciclos e 200 ciclos para confirmar a direção da tendência do mercado. Quando a EMA de curto prazo está acima da EMA de longo prazo, o mercado está em uma tendência ascendente.
- Sinais de entrada: com base na confirmação da tendência, a estratégia procura um padrão de absorção de bullish como ponto de entrada específico e filtra os sinais usando o indicador RSI. Quando o RSI é maior que 50, o mercado tem suficiente dinâmica ascendente.
- Gerenciamento de posições: usa o ATR de 14 ciclos para medir a volatilidade do mercado e, de acordo com isso, configura dinamicamente os níveis de stop loss e profit. O stop loss é definido em 1,1 vezes o ATR e o profit é definido em 2,0 vezes o ATR, o que garante uma taxa de ganho e perda maior que 1.
Vantagens estratégicas
- Verificação de múltiplos sinais: reduz significativamente o impacto de sinais falsos através da combinação de tendências, configurações de preços e indicadores de dinâmica.
- Gerenciamento de risco dinâmico: configuração de stop loss e profit baseada no ATR, capaz de se adaptar à volatilidade do mercado, evitando as limitações trazidas pelo ponto fixo.
- Características de acompanhamento de tendências: o sistema de linha média é usado para avaliar as tendências, evitando transações desnecessárias em mercados horizontais ou de baixa.
- Estrutura de negociação completa: contém um sistema completo de estratégias de entrada, saída e gestão de posições.
Risco estratégico
- Atraso na tendência: A EMA como indicador de atraso pode levar a um atraso no tempo de entrada, podendo perder o melhor ponto de entrada em mercados de alta volatilidade.
- Risco de liquidação de mercado: em mercados horizontais, a frequência de cruzamento de linhas médias pode levar a uma sobre-negociação.
- Risco de falha de ruptura: a forma de absorção de feijão pode ocorrer em falhas de ruptura e precisa ser gerenciada por um rigoroso controle de risco.
- Risco de configuração de stop loss: um ATR muito pequeno pode levar a um stop loss muito frequente, enquanto um multiplicador muito grande pode ter um risco muito grande.
Direção de otimização da estratégia
- Introdução de indicadores de tráfego: pode-se aumentar a confiabilidade do sinal adicionando a confirmação de tráfego.
- Optimizar o ciclo de linha média: pode ser ajustado de acordo com as diferentes características do mercado, para que ele se adapte melhor ao ritmo do mercado.
- Melhorar o mecanismo de stop loss: pode-se considerar a adição de stop loss móvel, a proteção já é lucrativa se a tendência continuar.
- Aumentar o filtro de mercado: introduzir a determinação da amplitude de flutuação e reduzir a frequência de negociação em um ambiente de mercado excessivamente volátil.
- Parâmetros de otimização do RSI: pode ser feito um retrospecto com base em dados históricos para encontrar o melhor limite do RSI e o ciclo de cálculo.
Resumir
A estratégia, através da integração de vários indicadores técnicos, constrói um sistema de acompanhamento de tendências logicamente completo. A vantagem da estratégia reside na verificação de múltiplos sinais e no gerenciamento de riscos dinâmicos, mas também precisa cuidar de lidar com riscos como atraso de tendências e falsas rupturas.
/*backtest
start: 2024-11-12 00:00:00
end: 2024-12-11 08:00:00
period: 3h
basePeriod: 3h
exchanges: [{"eid":"Futures_Binance","currency":"BTC_USDT"}]
*/

//@version=5
strategy("Bullish Engulfing with EMA Crossover and ATR-Based SL/TP with RSI Filter", overlay=true)

// Inputs for moving averages
short_ema_length = input.int(100, title="Short EMA Length")
long_ema_length = input.int(200, title="Long EMA Length")

// RSI Input
rsi_length = input.int(14, title="RSI Length")
rsi_threshold = input.float(50, title="RSI Threshold")

// Calculate the Exponential Moving Averages (EMAs)
short_ema = ta.ema(close, short_ema_length)
long_ema = ta.ema(close, long_ema_length)

// Plot EMAs on the chart
plot(short_ema, color=color.blue, title="100 EMA")
plot(long_ema, color=color.red, title="200 EMA")

// Calculate RSI
rsi_value = ta.rsi(close, rsi_length)

// Plot RSI on a separate panel
hline(rsi_threshold, "RSI Threshold", color=color.gray)
plot(rsi_value, color=color.purple, title="RSI")

// Bullish Engulfing Pattern
bullish_engulfing = close > open[1] and open < close[1] and close > open

// Define strategy entry condition with RSI filter
long_condition = bullish_engulfing and short_ema > long_ema and rsi_value > rsi_threshold

// Plot a buy signal when conditions are met
plotshape(long_condition, style=shape.labelup, location=location.belowbar, color=color.green, title="Buy Signal", text="BUY")

// ATR Calculation
atr_length = input.int(14, title="ATR Length")
atr_value = ta.atr(atr_length)

// Define Stop Loss and Take Profit as levels
stop_loss_level = 1.1 * atr_value
take_profit_level = 2.0 * atr_value

// Execute Strategy Entry
if (long_condition)
    strategy.entry("Buy", strategy.long)

// Adjust SL and TP levels using the entry price
if (strategy.position_size > 0)
    // Calculate SL and TP relative to the entry price
    stop_price = strategy.position_avg_price - stop_loss_level
    limit_price = strategy.position_avg_price + take_profit_level

    // Exit strategy with SL and TP
    strategy.exit("Exit", from_entry="Buy", stop=stop_price, limit=limit_price)