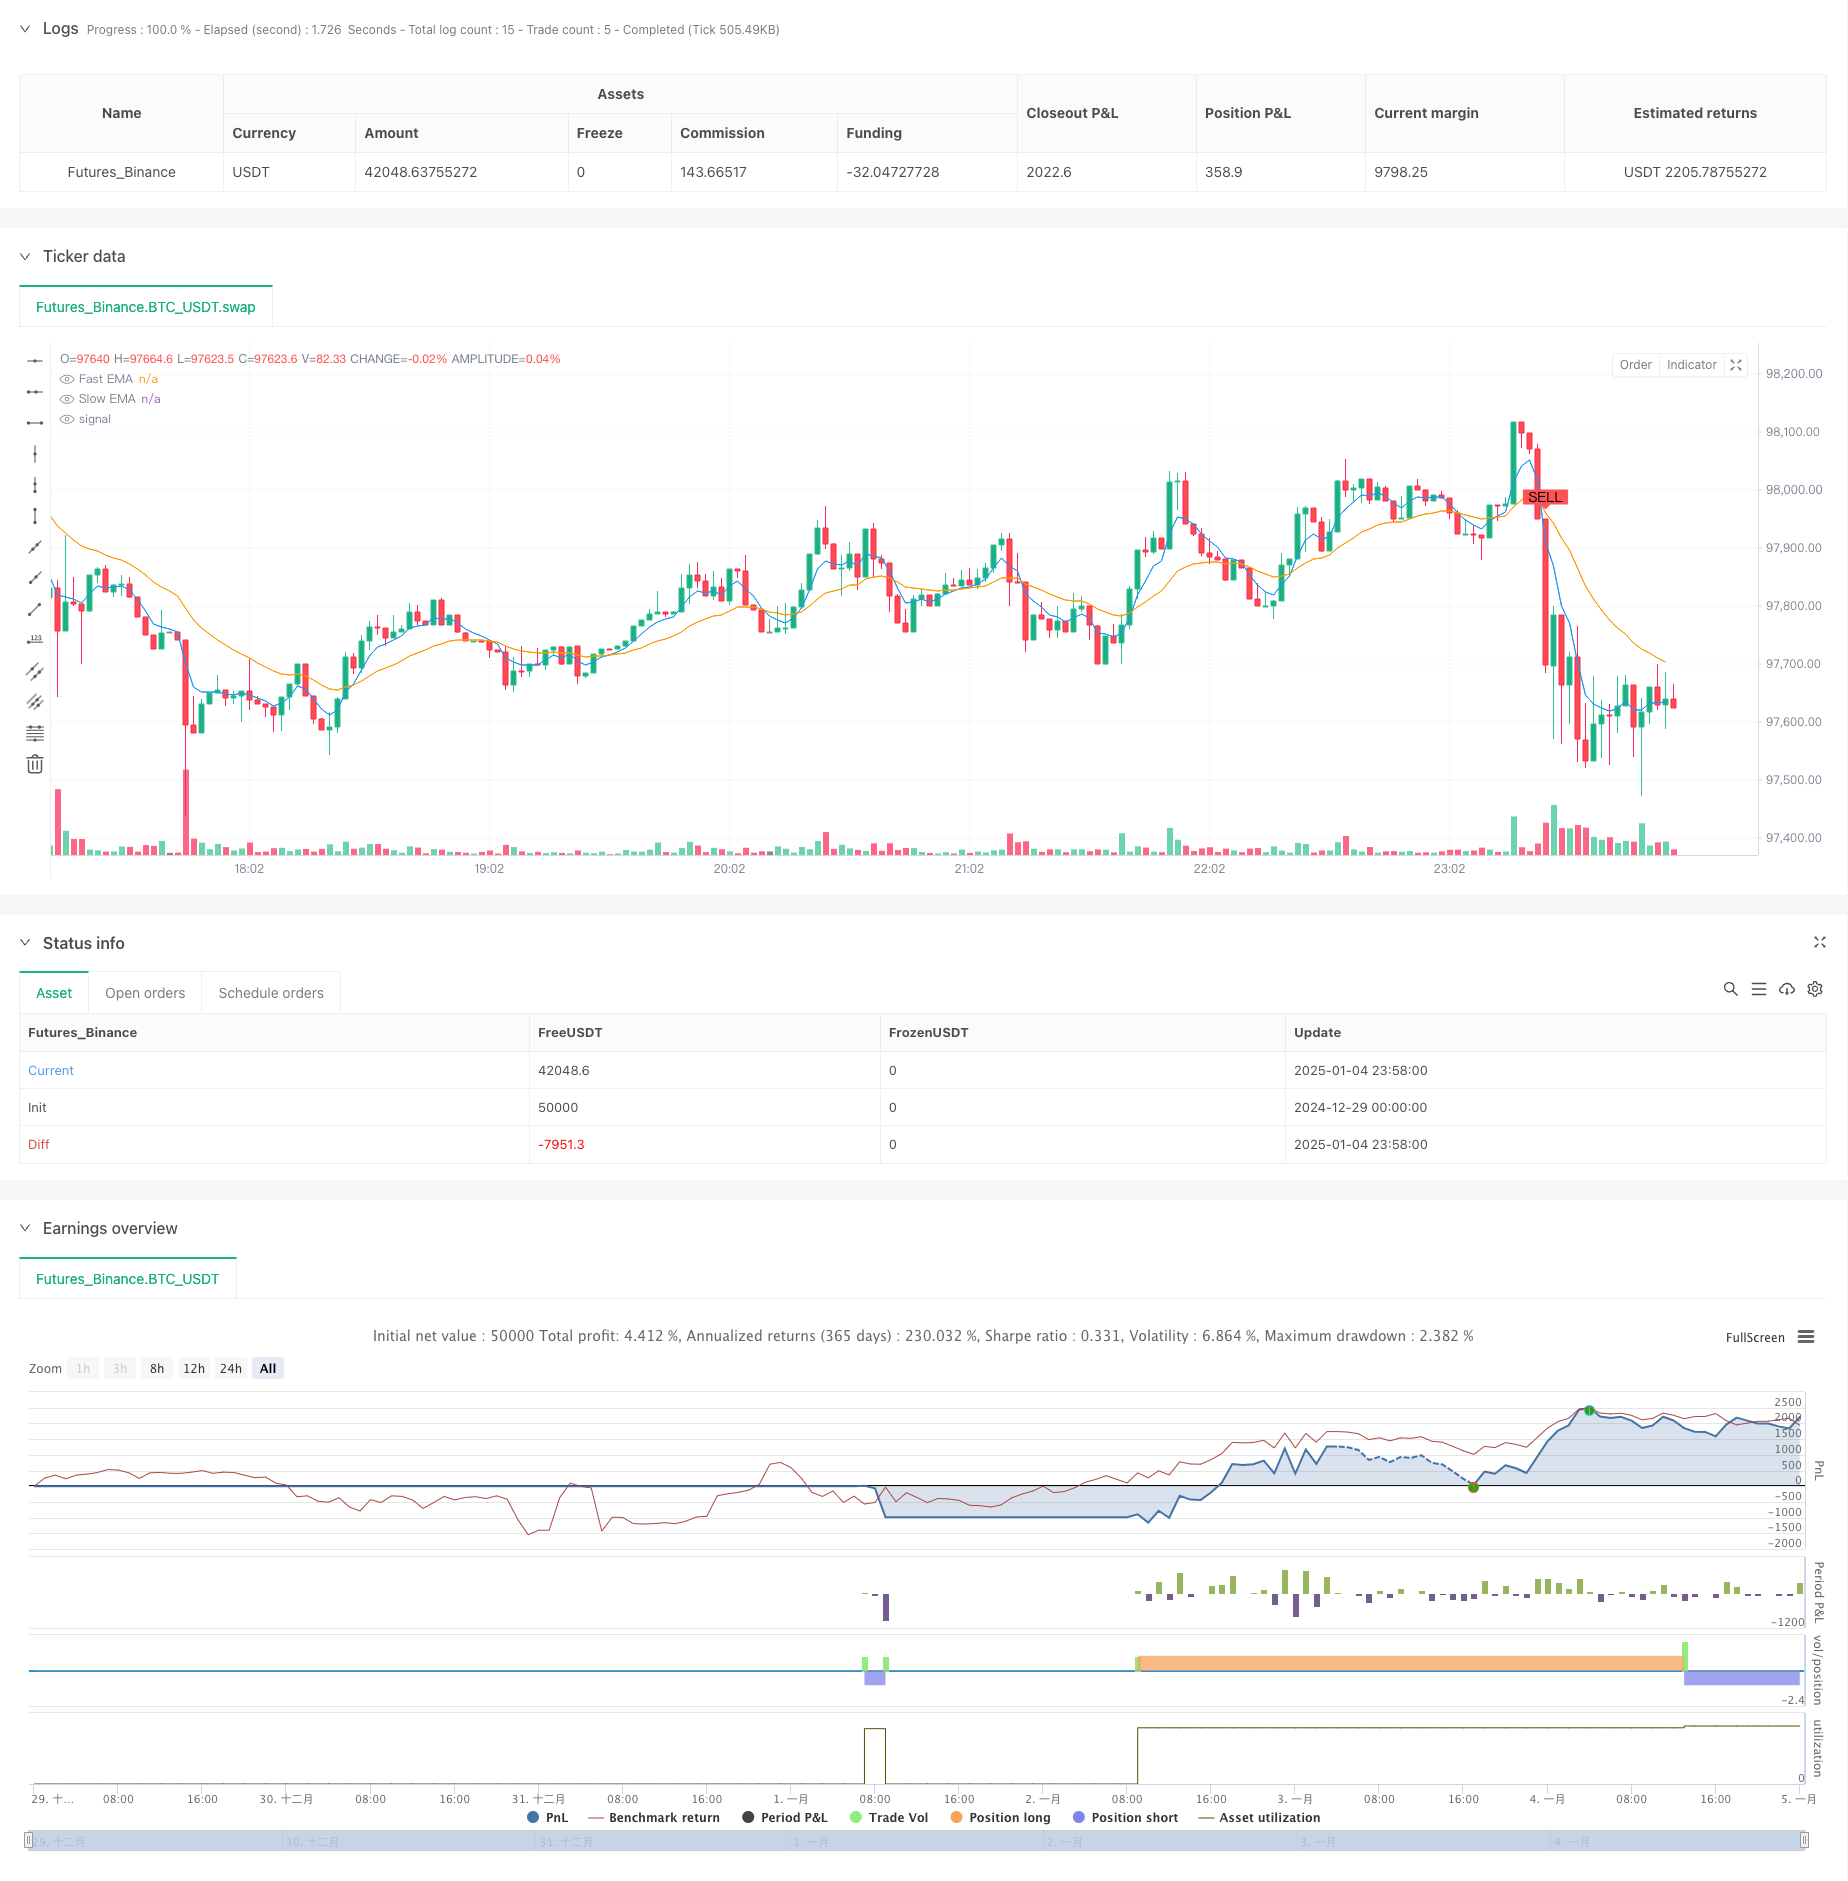
Visão geral
A estratégia é um sistema de negociação que acompanha tendências e combina sinais de cruzamento de média móvel com gerenciamento dinâmico de risco. Ele usa médias móveis exponenciais rápidas e lentas (EMA) para identificar tendências de mercado e as combina com o indicador Average True Range (ATR) para otimizar o momento de entrada. Ao mesmo tempo, a estratégia integra mecanismos de proteção tripla: stop loss percentual, lucro alvo e trailing stop loss.
Princípio da estratégia
A lógica central da estratégia é baseada nos seguintes elementos-chave:
- Use o crossover EMA de 5 e 20 períodos para determinar a direção da tendência
- Aumente a confiabilidade dos sinais de negociação filtrando com múltiplos ATR
- Disparar sinais de negociação quando ocorre o cruzamento da EMA e o preço sai do canal ATR
- Imediatamente após abrir uma posição, defina um stop loss fixo de 1% e uma meta de lucro de 5%.
- Use trailing stops baseados em ATR para proteger lucros
- Transações bidirecionais longas e curtas, aproveite totalmente as oportunidades de mercado
Vantagens estratégicas
- O sistema de sinais combina indicadores de tendência e volatilidade para melhorar a precisão da negociação
- Os canais ATR dinâmicos podem se adaptar às características de volatilidade de diferentes ambientes de mercado
- O mecanismo de controle de risco triplo fornece proteção completa para transações
- Os parâmetros são altamente ajustáveis, facilitando a otimização de acordo com diferentes características do mercado.
- O sistema possui alto grau de automação, reduzindo o impacto emocional da intervenção humana
Risco estratégico
- Os cruzamentos de EMA podem ficar para trás e levar à perda de pontos de entrada em mercados voláteis
- Os stops de porcentagem fixa podem não ser flexíveis o suficiente durante períodos de alta volatilidade
- Transações frequentes podem resultar em taxas de transação mais altas
- Sinais falsos frequentes podem ocorrer em mercados com limites de variação
- Trailing stops podem levar a saídas antecipadas em recuos rápidos
Direção de otimização da estratégia
- Introdução de indicadores de volume para verificar a validade das tendências
- Adicionar mecanismo de identificação do ambiente de mercado e usar parâmetros diferentes em diferentes condições de mercado
- Otimizar múltiplos ATR e estabelecer um sistema de parâmetros dinâmicos adaptativos
- Combine mais indicadores técnicos para filtrar sinais falsos
- Desenvolver soluções de gestão de fundos mais flexíveis
Resumir
Esta é uma estratégia de acompanhamento de tendências bem elaborada e logicamente clara. Ao capturar tendências por meio do cruzamento de médias móveis, usar o ATR para controlar riscos e coordenar com vários mecanismos de stop-loss, um sistema de negociação completo é formado. As principais vantagens da estratégia são seu controle de risco abrangente e alta personalização, mas na negociação real, você precisa prestar atenção aos problemas de sinais falsos e custos de transação. Por meio das direções de otimização sugeridas, ainda há espaço para melhorias adicionais na estratégia.
/*backtest
start: 2024-12-29 00:00:00
end: 2025-01-05 00:00:00
period: 2m
basePeriod: 2m
exchanges: [{"eid":"Futures_Binance","currency":"BTC_USDT"}]
*/

// This Pine Script™ code is subject to the terms of the Mozilla Public License 2.0 at https://mozilla.org/MPL/2.0/
// © jesusperezguitarra89

//@version=6
strategy("High Profit Buy/Sell Signals", overlay=true)

// Parámetros ajustables
fastLength = input.int(5, title="Fast EMA Length")
slowLength = input.int(20, title="Slow EMA Length")
atrLength = input.int(10, title="ATR Length")
atrMultiplier = input.float(2.5, title="ATR Multiplier")
stopLossPercent = input.float(1.0, title="Stop Loss %")
takeProfitPercent = input.float(5.0, title="Take Profit %")
trailingStop = input.float(2.0, title="Trailing Stop %")

// Cálculo de EMAs
fastEMA = ta.ema(close, fastLength)
slowEMA = ta.ema(close, slowLength)

// Cálculo del ATR
atr = ta.atr(atrLength)

// Señales de compra y venta
longCondition = ta.crossover(fastEMA, slowEMA) and close > slowEMA + atrMultiplier * atr
shortCondition = ta.crossunder(fastEMA, slowEMA) and close < slowEMA - atrMultiplier * atr

// Dibujar señales en el gráfico
plotshape(series=longCondition, location=location.belowbar, color=color.green, style=shape.labelup, text="BUY")
plotshape(series=shortCondition, location=location.abovebar, color=color.red, style=shape.labeldown, text="SELL")

// Estrategia de backtesting para marcos de tiempo en minutos
if longCondition
    strategy.entry("Buy", strategy.long)
    strategy.exit("Take Profit", from_entry="Buy", limit=close * (1 + takeProfitPercent / 100), stop=close * (1 - stopLossPercent / 100), trail_points=atr * trailingStop)
if shortCondition
    strategy.entry("Sell", strategy.short)
    strategy.exit("Take Profit", from_entry="Sell", limit=close * (1 - takeProfitPercent / 100), stop=close * (1 + stopLossPercent / 100), trail_points=atr * trailingStop)

// Mostrar EMAs
plot(fastEMA, color=color.blue, title="Fast EMA")
plot(slowEMA, color=color.orange, title="Slow EMA")