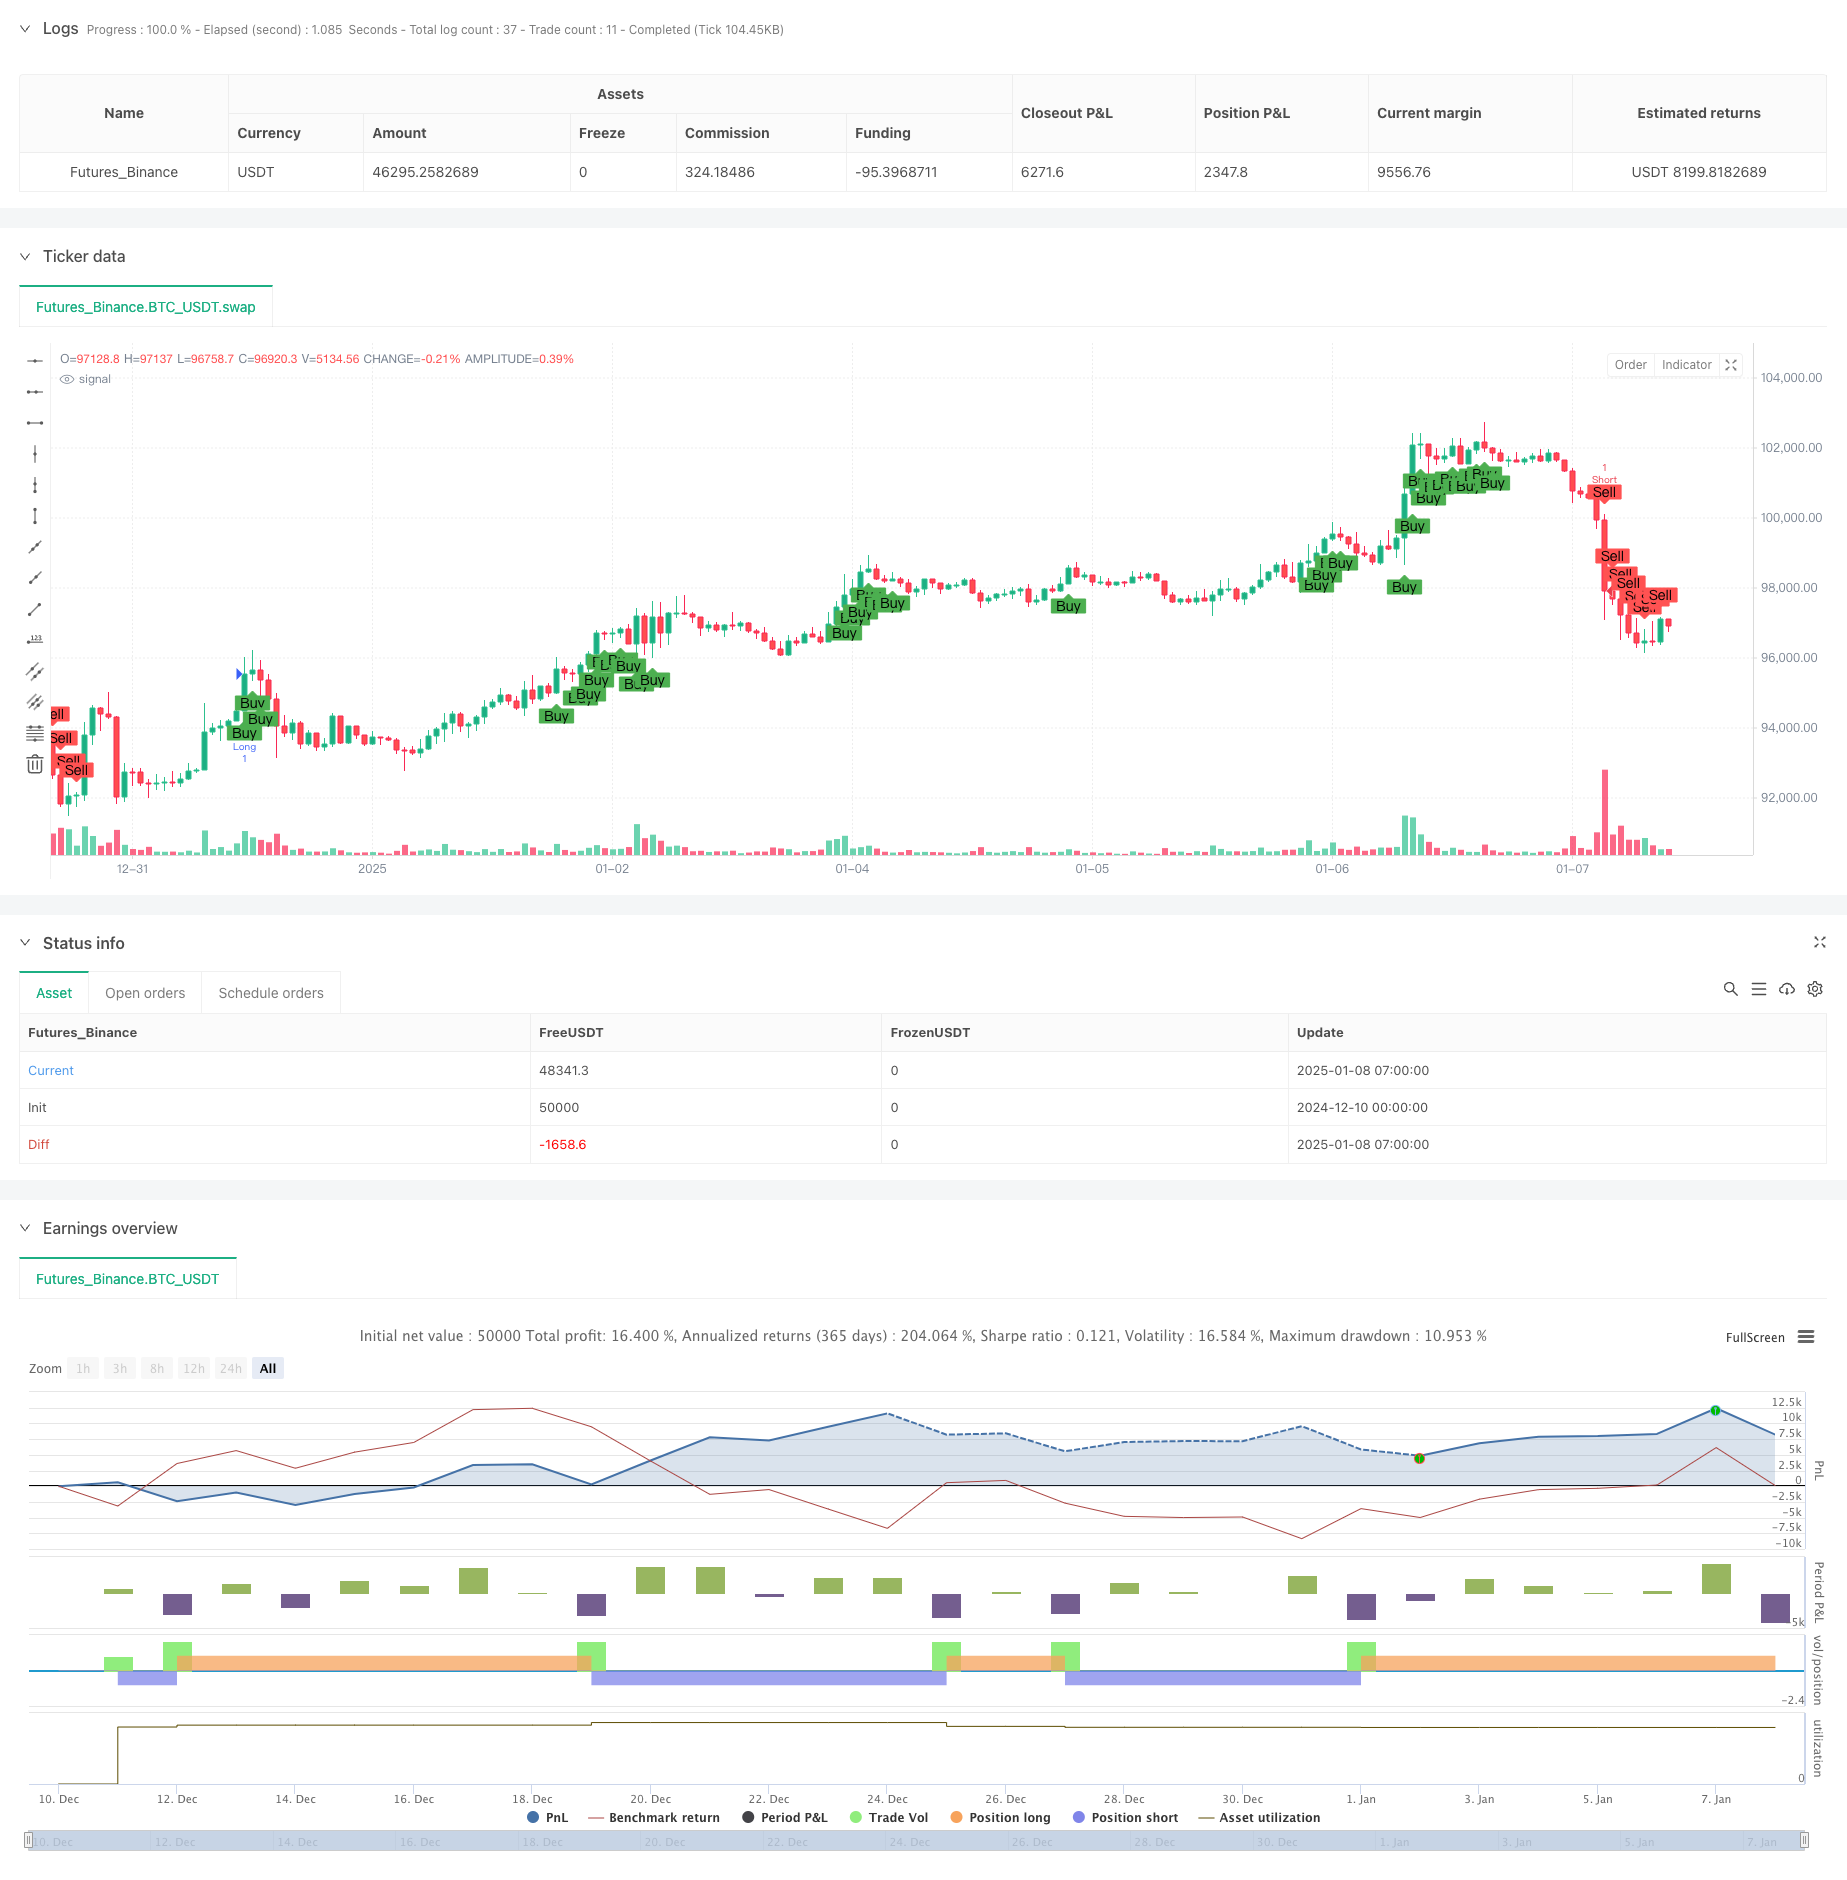
Visão geral
Esta é uma estratégia de acompanhamento de tendências que combina a média móvel exponencial (MME) e o índice de força relativa (IFR). A estratégia monitora o cruzamento das EMAs rápidas e lentas e combina os níveis de sobrecompra e sobrevenda do indicador RSI, bem como a divergência do RSI, para determinar sinais de negociação, captando assim efetivamente as tendências do mercado. A estratégia é executada em um período de 1 hora e melhora a precisão das transações por meio da verificação de vários indicadores técnicos.
Princípio da estratégia
A lógica central da estratégia inclui os seguintes elementos-chave:
- Use as EMAs de 9 e 26 períodos para determinar a direção da tendência. Se a linha rápida estiver acima da linha lenta, é considerada uma tendência ascendente, caso contrário, é uma tendência descendente.
- Use o indicador RSI de 14 períodos e defina 65 e 35 como limites de disparo para sinais longos e curtos.
- Detecte divergências do RSI em um período de 1 hora, identificando possíveis reversões de tendência comparando máximas e mínimas de preços com máximas e mínimas do RSI.
- Os sinais de negociação longos devem atender às seguintes condições: EMA rápido está acima de EMA lento, RSI é maior que 65 e não há divergência de baixa do RSI
- Os sinais de negociação curta devem atender às seguintes condições: EMA rápido está abaixo de EMA lento, RSI é menor que 35 e não há divergência de alta do RSI
Vantagens estratégicas
- A validação cruzada de vários indicadores técnicos melhora a confiabilidade dos sinais de negociação
- Reduza o risco de falsas fugas detectando divergências RSI
- Combinando as vantagens do rastreamento de tendências e da sobrecompra e sobrevenda, ele não só consegue captar as grandes tendências, mas também não perde as oportunidades de negociação de curto prazo.
- Os parâmetros podem ser otimizados e ajustados de acordo com diferentes características do mercado
- A lógica da estratégia é clara, fácil de entender e implementar
Risco estratégico
- EMA como um indicador defasado pode levar a pontos de entrada subótimos
- O RSI pode gerar muitos sinais de negociação em um mercado instável
- O julgamento de divergência pode ser mal avaliado, especialmente em mercados altamente voláteis
- Uma rápida reviravolta no mercado pode causar um grande retrocesso Medidas de mitigação:
- Configurações de stop loss e take profit podem ser adicionadas
- Considere adicionar verificação do indicador de volume
- Ajustando os limites do RSI em um mercado volátil
Direção de otimização da estratégia
- Introdução de limites RSI adaptáveis para ajuste dinâmico de acordo com as flutuações do mercado
- Adicionar indicador de volume como confirmação de sinal
- Desenvolvendo um algoritmo de detecção de divergência mais preciso
- Adicionar mecanismo de gerenciamento de stop loss e take profit
- Considere adicionar um filtro de volatilidade de mercado
Resumir
Esta estratégia constrói um sistema de negociação relativamente completo combinando o sistema de média móvel, indicadores de momentum e análise de divergência. A estratégia se concentra em múltiplas verificações de sinais, reduzindo efetivamente o risco de erros de julgamento. Embora haja um certo atraso, a estratégia tem bom valor de aplicação prática por meio da otimização de parâmetros e melhorias no gerenciamento de riscos.
/*backtest
start: 2024-12-10 00:00:00
end: 2025-01-08 08:00:00
period: 1h
basePeriod: 1h
exchanges: [{"eid":"Futures_Binance","currency":"BTC_USDT"}]
*/

//@version=5
strategy("EMA9_RSI_Strategy_LongShort", overlay=true)

// Parameters
fastLength = input.int(9, minval=1, title="Fast EMA Length")
slowLength = input.int(26, minval=1, title="Slow EMA Length")
rsiPeriod = input.int(14, minval=1, title="RSI Period")
rsiLevelLong = input.int(65, minval=1, title="RSI Level (Long)")
rsiLevelShort = input.int(35, minval=1, title="RSI Level (Short)")

// Define 1-hour timeframe
timeframe_1h = "60"

// Fetch 1-hour data
high_1h = request.security(syminfo.tickerid, timeframe_1h, high)
low_1h = request.security(syminfo.tickerid, timeframe_1h, low)
rsi_1h = request.security(syminfo.tickerid, timeframe_1h, ta.rsi(close, rsiPeriod))

// Current RSI
rsi = ta.rsi(close, rsiPeriod)

// Find highest/lowest price and corresponding RSI in the 1-hour timeframe
highestPrice_1h = ta.highest(high_1h, 1) // ราคาสูงสุดใน 1 ช่วงของ timeframe 1 ชั่วโมง
lowestPrice_1h = ta.lowest(low_1h, 1)   // ราคาต่ำสุดใน 1 ช่วงของ timeframe 1 ชั่วโมง
highestRsi_1h = ta.valuewhen(high_1h == highestPrice_1h, rsi_1h, 0)
lowestRsi_1h = ta.valuewhen(low_1h == lowestPrice_1h, rsi_1h, 0)

// Detect RSI Divergence for Long
bearishDivLong = high > highestPrice_1h and rsi < highestRsi_1h
bullishDivLong = low < lowestPrice_1h and rsi > lowestRsi_1h
divergenceLong = bearishDivLong or bullishDivLong

// Detect RSI Divergence for Short (switch to low price for divergence check)
bearishDivShort = low > lowestPrice_1h and rsi < lowestRsi_1h
bullishDivShort = high < highestPrice_1h and rsi > highestRsi_1h
divergenceShort = bearishDivShort or bullishDivShort

// Calculate EMA
emaFast = ta.ema(close, fastLength)
emaSlow = ta.ema(close, slowLength)

// Long Conditions
longCondition = emaFast > emaSlow and rsi > rsiLevelLong and not divergenceLong

// Short Conditions
shortCondition = emaFast < emaSlow and rsi < rsiLevelShort and not divergenceShort

// Plot conditions
plotshape(longCondition, title="Buy", location=location.belowbar, color=color.green, style=shape.labelup, text="Buy")
plotshape(shortCondition, title="Sell", location=location.abovebar, color=color.red, style=shape.labeldown, text="Sell")

// Execute the strategy
if (longCondition)
    strategy.entry("Long", strategy.long, comment="entry long")

if (shortCondition)
    strategy.entry("Short", strategy.short, comment="entry short")

// Alert
alertcondition(longCondition, title="Buy Signal", message="Buy signal triggered!")
alertcondition(shortCondition, title="Sell Signal", message="Sell signal triggered!")