Том Демарк Последовательная тепловая карта
Автор:Чао Чжан, Дата: 2022-05-08 17:19:47Тэги:Тенденции
Этот индикатор использует TD Sequential Tom DeMark
Помимо цифр ценовые свечи окрашены в соответствии с последовательностью. Бычьи цвета начинаются от ярко-желтого (TD 1 = начало тренда) до темно-красного (TD 13 = тренд исчерпан) Березовые цвета начинаются от ярко-синего (TD 1 = начало тренда) до темно-синего (TD 13 = тренд исчерпан)
DeMark рекомендует использовать только для краткосрочных перемен цен, но, как вы можете видеть на графике, он также работает для графика LUNA 1D. Также очень хорошо работает с свечами Хайкина Аши.
Используйте его в сочетании, например, с
Если у вас есть какие-либо идеи о том, как оптимизировать код, пожалуйста, не стесняйтесь делиться
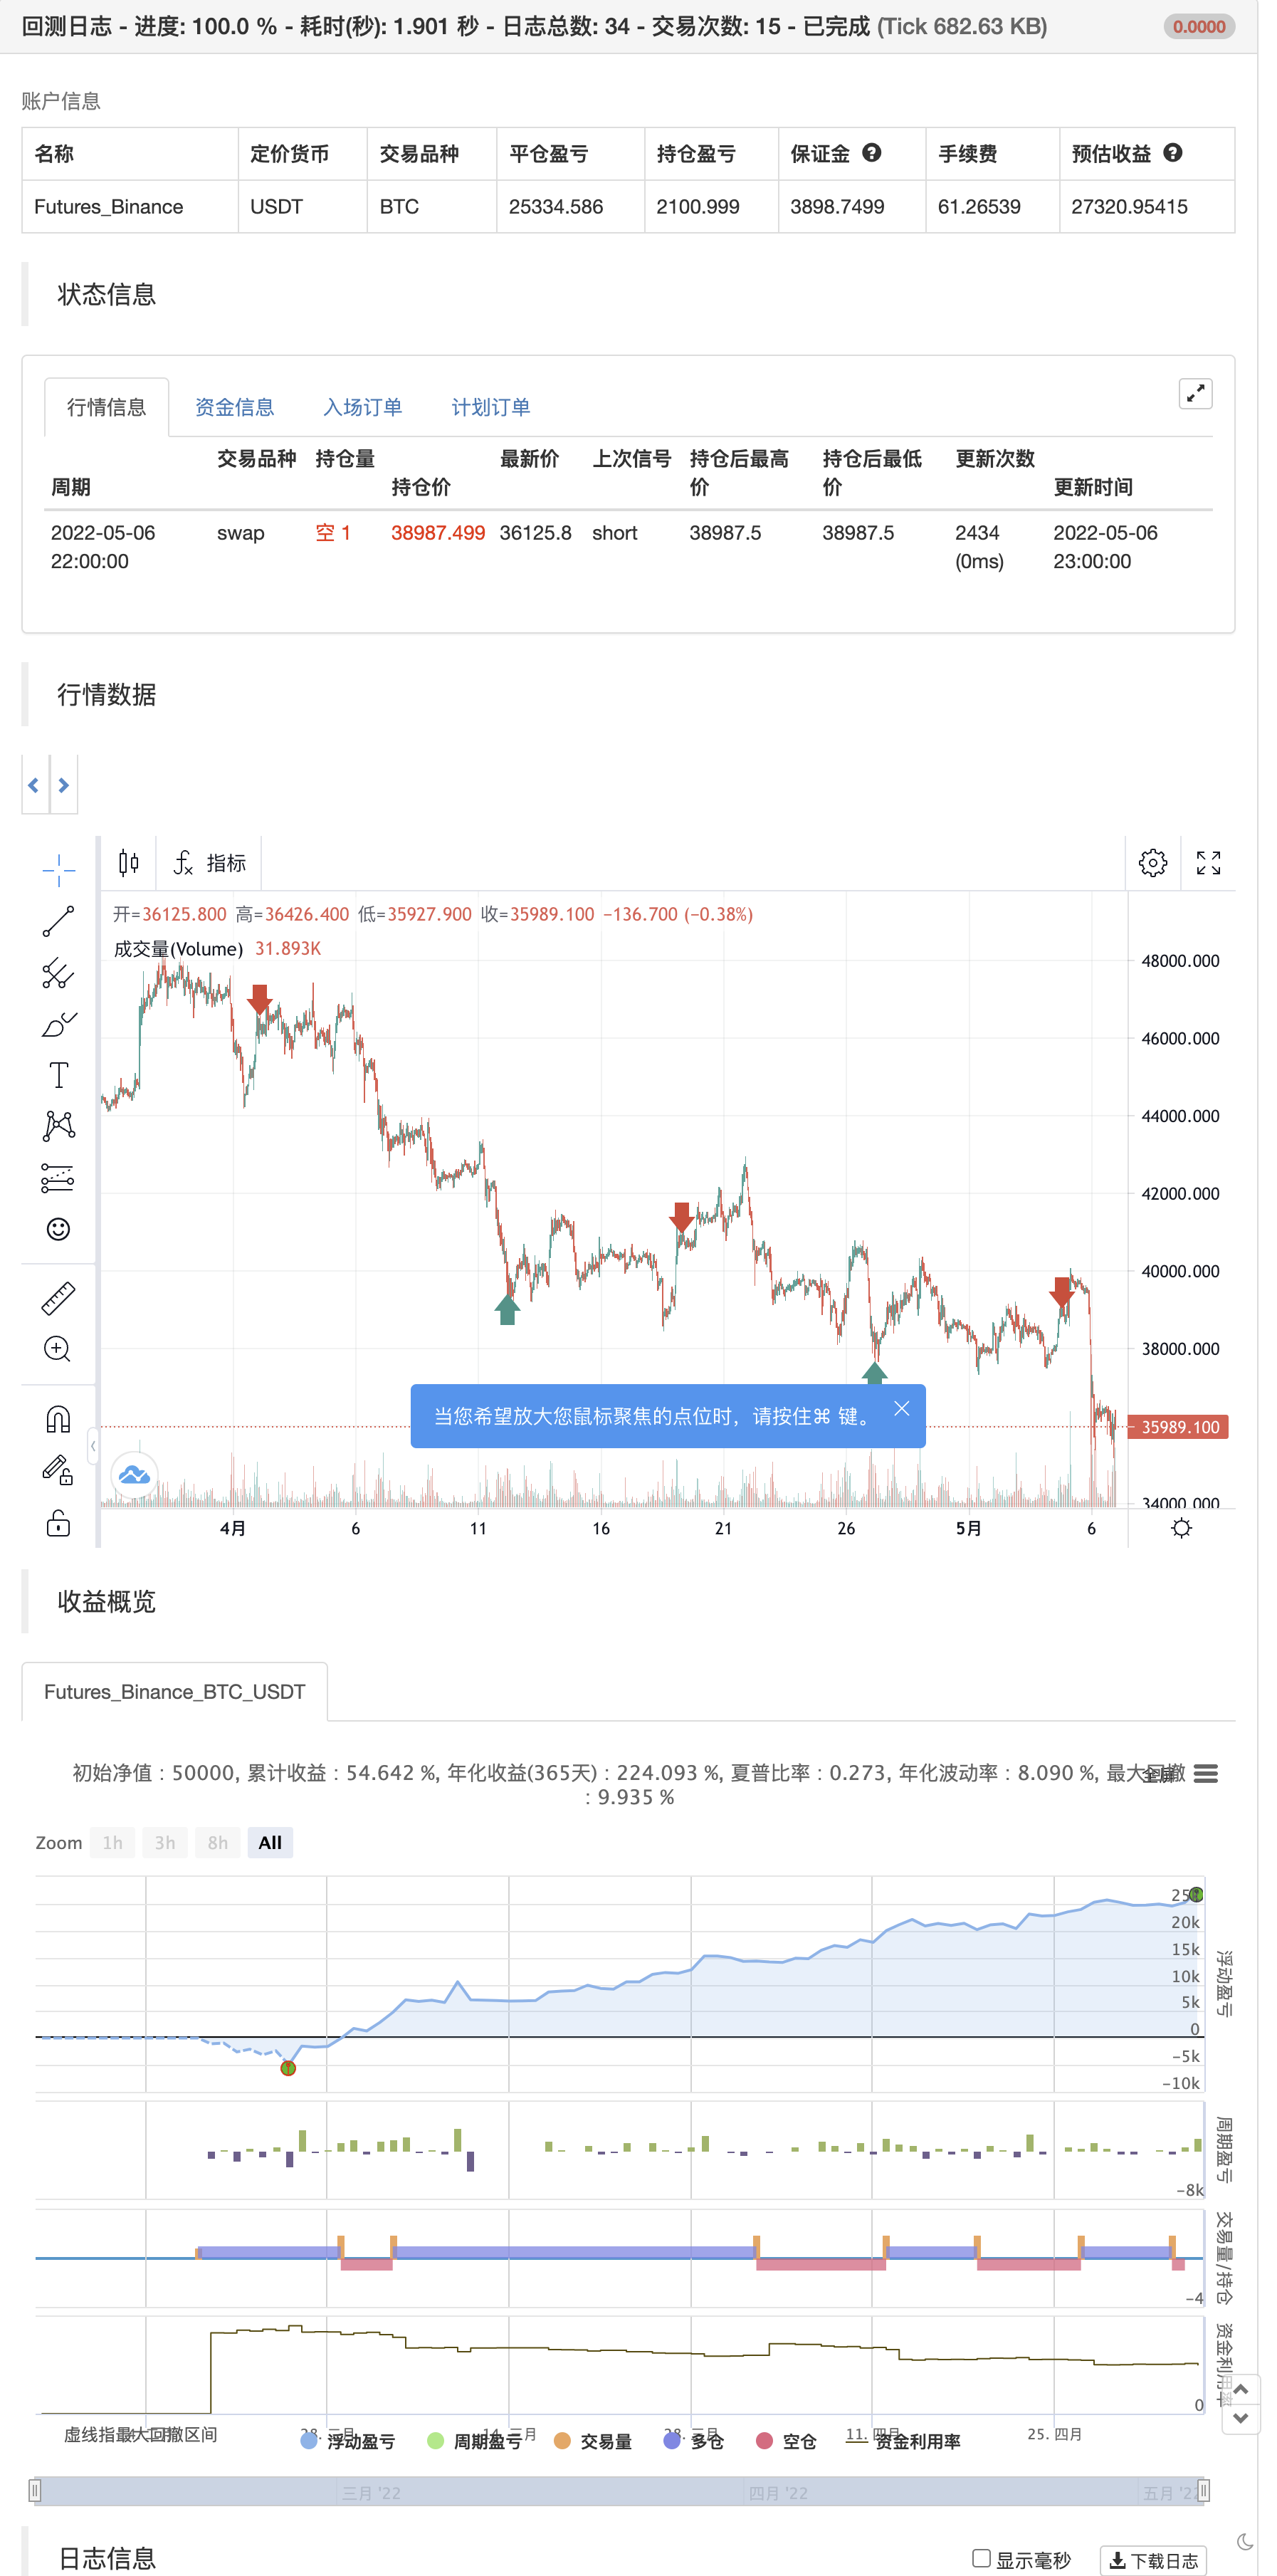
обратная проверка

////////////////////////////////////////// Tom DeMark heatmap © by Indicator-Jones /////////////////////////////////////////
//
// This indicator uses Tom DeMark’s TD Sequential counting from 1 to 13.
// Number 9 and 13 usually identify an exhausted trend and mark trend reversal.
// The important numbers get displayed as labels (7-13), where 9 and 13 are both highlighted as "Long" or "Short".
// Besides the numbers the price candles are colored based upon the sequence.
// Bullish colors are starting from bright yellow (TD 1 = start of trend) to dark red (TD 13 = trend exhausted)
// Bearish colors are starting from bright blue (TD 1 = start of trend) to dark blue (TD 13 = trend exhausted)
//
// DeMark recommends to be used for short term price reversals only but as you can see in the chart, it also works for LUNA 1D chart.
// Also works very well with Heikin Ashi candles.
// Use it in combination with for example the "Tom DeMark Pressure Ratio" to find tops and bottoms.
// You can change the timeframes, disable lables/barcolor and customise colors to your liking.
//
// If you have any idea on how to optimise the code, please feel free to share :)
//
// Inspired by "Stochastic Heat Map" from @Violent
//
////////////////////////////////////////////////////////////////////////////////////////////////////////////////////////////

//@version=5
indicator(title='Tom DeMark Sequential Heat Map', shorttitle='TD heatmap', overlay=true, timeframe='')
//A heat map for TD counts. If you find this useful or yank the code, please consider a donation :)

// -------- Inputs --------
paintBars = input(title='Paint Bars', defval=true)
showLabels = input(title='Show labels', defval=true)

buy_col = input(#32CD32,0,'Colors',inline='col')
sell_col = input(#F44336,0,'',inline='col')
text_col = input(#FFFFFF,0,'',inline='col')


// -------- Bearish trend (blue) color selection --------
getBuyColor(count) =>
    if count == 1
        color.new(#11e7f2,0)
    else
        if count == 2
            color.new(#11d9f2,0)
        else
            if count == 3
                color.new(#11cbf2,0)
            else
                if count == 4
                    color.new(#11aff2,0)
                else
                    if count == 5
                        color.new(#1193f2,0)
                    else
                        if count == 6
                            color.new(#1176f2,0)
                        else
                            if count == 7
                                color.new(#105df4,0)
                            else
                                if count == 8
                                    color.new(#1051f5,0)
                                else
                                    if count == 9
                                        color.new(#0f44f5,0)
                                    else
                                        if count == 10
                                            color.new(#0c3de0,0)
                                        else
                                            if count == 11
                                                color.new(#0935ca,0)
                                            else
                                                if count == 12
                                                    color.new(#062eb4,0)
                                                else
                                                    if count == 13
                                                        color.new(#02269e,0)

// -------- Bullish trend (blue) color selection --------
getSellColor(count) =>
    if count == 1
        color.new(#eef211,0)
    else
        if count == 2
            color.new(#efdc11,0)
        else
            if count == 3
                color.new(#f0c511,0)
            else
                if count == 4
                    color.new(#f1af11,0)
                else
                    if count == 5
                        color.new(#f29811,0)
                    else
                        if count == 6
                            color.new(#f28811,0)
                        else
                            if count == 7
                                color.new(#f27811,0)
                            else
                                if count == 8
                                    color.new(#f26811,0)
                                else
                                    if count == 9
                                        color.new(#f25811,0)
                                    else
                                        if count == 10
                                            color.new(#ea420d,0)
                                        else
                                            if count == 11
                                                color.new(#e12c09,0)
                                            else
                                                if count == 12
                                                    color.new(#d81605,0)
                                                else
                                                    if count == 13
                                                        color.new(#cf0000,0)

// -------- Calculate bearish trend sequence --------
buySetup = 0
buySetup := close < close[4] ? buySetup[1] == 13 ? 1 : buySetup[1] + 1 : 0


// -------- Calculate bullish trend sequence --------
sellSetup = 0
sellSetup := close > close[4] ? sellSetup[1] == 13 ? 1 : sellSetup[1] + 1 : 0


// -------- Paint bars --------
barColour = buySetup >= 1 ? getBuyColor(buySetup) : sellSetup >= 1 ? getSellColor(sellSetup) : na
//barcolor(paintBars ? barColour : na, title='Bar colors (heatmap)')


if buySetup == 13
    strategy.entry("Enter Long", strategy.long)
else if sellSetup == 13
    strategy.entry("Enter Short", strategy.short)
- Линейная тенденция
- Модель фибоначчи
- Периодическая тенденция
- Супер тренд B
- Киджунсенская линия с крестом
- Диамантный тренд
- Импульс 2.0
- Тенденция Хайкина-Аши
- Точки переворота Демарка
- Уравненная линия
- РСИ МФО Ob+Os
- Стратегия MACD Willy
- RSI - Сигналы покупки и продажи
- Тенденция Хайкина-Аши
- HA Противоположность рынка
- Гладкий осциллятор облака Ичимоку
- Williams %R - сглаженный
- QQE MOD + SSL Hybrid + Взрыв в Вадда Аттар
- Купить/продать Strat
- Трехкратный супертенд с EMA и ADX
- jma + dwma по мультизерну
- MAGIC MACD
- Показатель Z с помощью сигналов
- Путешествие в Пиньи
- 3EMA + Боуллингер + PIVOT
- Багеты многозерновые
- Милемашина
- Индикатор обратного движения K I
- Поглощающие свечи
- М.А. Император инсиликонот