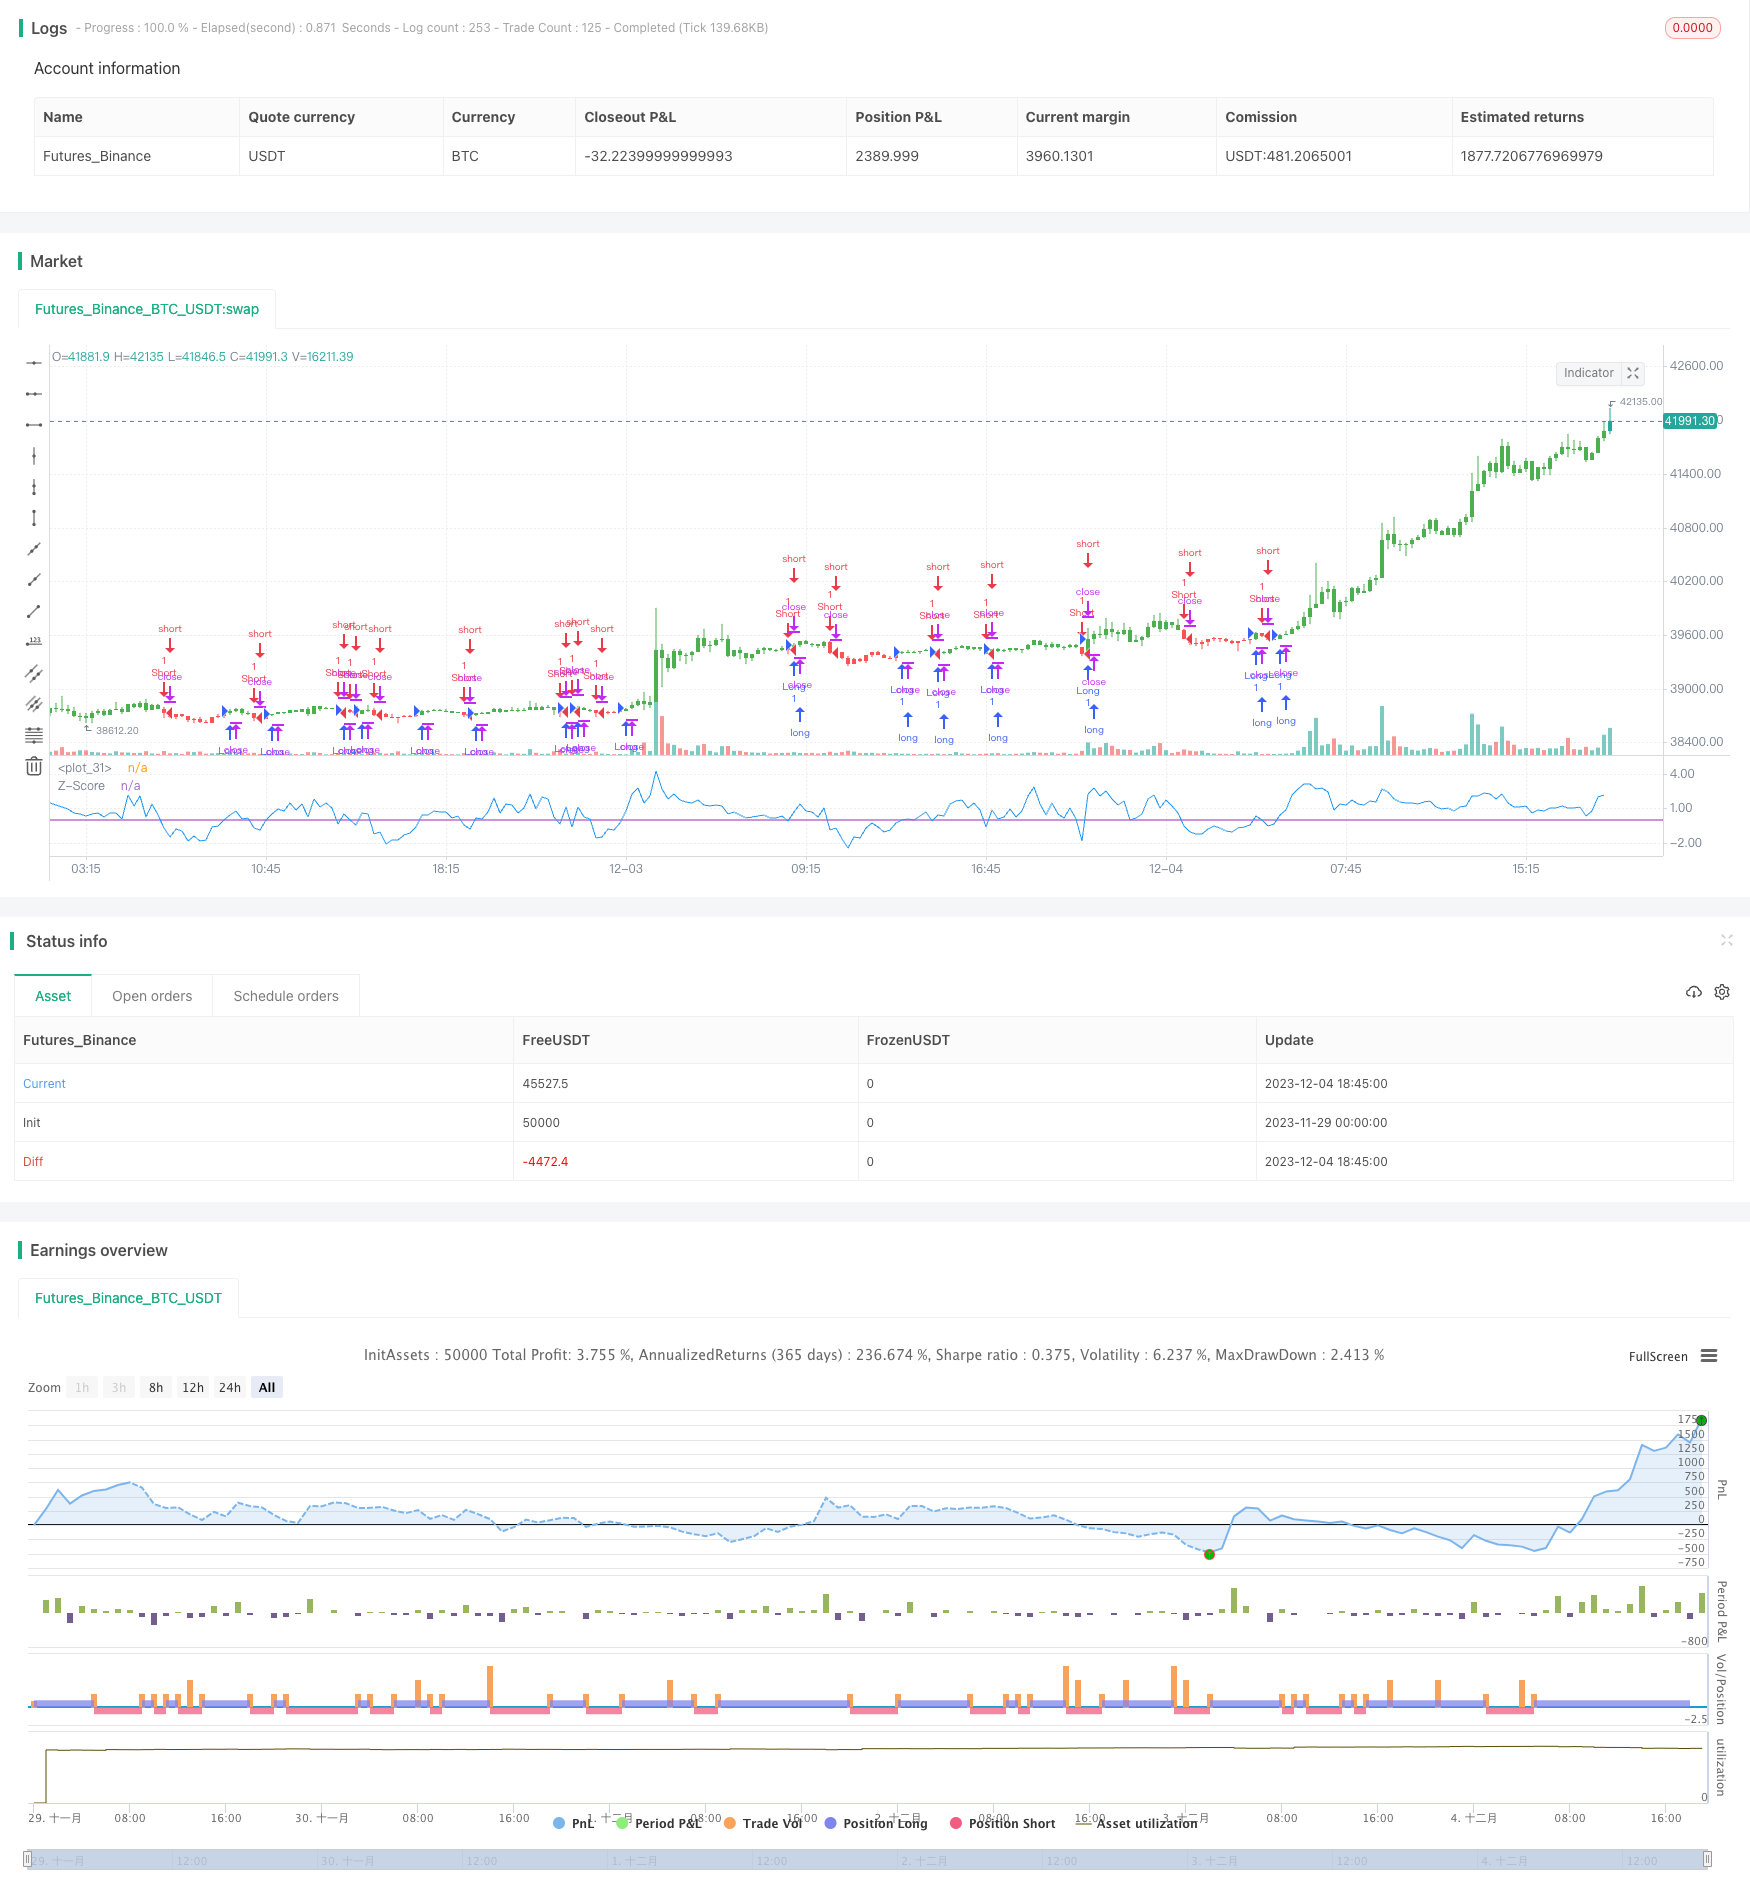
Стратегия прорыва цены Z-Score
Автор:Чао Чжан, Дата: 2023-12-07 15:17:43Тэги:

Обзор
Стратегия Z-Score использует индикатор Z-Score, чтобы определить, находится ли текущая цена в аномальном состоянии, чтобы генерировать торговые сигналы.
Принцип стратегии
Основным показателем этой стратегии является Z-оценка цены, рассчитанная следующим образом:
Z_score = (C - SMA(n)) / StdDev(C,n)
где C - цена закрытия, SMA (n) - простая скользящая средняя за n периодов, а StdDev (C,n) - стандартное отклонение цены закрытия за n периодов.
Z-очко отражает степень отклонения текущей цены от средней цены. Когда цена z-очко больше определенного положительного порога (например, +2), это означает, что текущая цена выше средней цены на 2 стандартных отклонения, что является относительно высоким уровнем. Когда она меньше определенного отрицательного порога (например, -2), это означает, что текущая цена ниже средней цены на 2 стандартных отклонения, что является относительно низким уровнем.
Эта стратегия сначала рассчитывает z-балл цены, затем устанавливает положительный и отрицательный порог (например, 0 и 0). Когда z-балл выше положительного порога, он генерирует сигнал покупки. Когда ниже отрицательного порога, он генерирует сигнал продажи.
Анализ преимуществ
- Использование ценового Z-score для оценки аномалий цен является распространенным и эффективным количественным методом
- Легко достичь как длинной, так и короткой торговли
- Гибкие настройки параметров, регулируемый цикл, порог и т.д.
- Может сочетаться с другими показателями для формирования торговой системы
Анализ рисков
- Стратегия Z-Score грубая и подвержена ложным сигналам
- Необходимо установить соответствующие параметры, такие как цикл и порог
- Необходимость рассмотрения стратегий стоп-лосса для контроля риска
Руководство по оптимизации
- Оптимизировать параметры цикла для поиска лучшего цикла
- Оптимизировать положительные и отрицательные пороги для уменьшения ложных сигналов
- Добавить условия фильтра, комбинировать с другими показателями
- Добавить стратегии стоп-лосса
Резюме
Стратегия Z-score оценивает, находится ли текущая цена в аномальном состоянии, и торгует в соответствии с положительным и отрицательным ценовым Z-score. Эта стратегия проста и проста в реализации, позволяет вести двустороннюю торговлю, но также имеет некоторые риски. Оптимизируя параметры, добавляя стоп-лосс и комбинируя с другими индикаторами, эта стратегия может быть улучшена, чтобы сформировать полную количественную торговую систему.
/*backtest
start: 2023-11-29 00:00:00
end: 2023-12-04 19:00:00
period: 15m
basePeriod: 5m
exchanges: [{"eid":"Futures_Binance","currency":"BTC_USDT"}]
*/

//@version=2
////////////////////////////////////////////////////////////
//  Copyright by HPotter v1.0 18/01/2017
// The author of this indicator is Veronique Valcu. The z-score (z) for a data
// item x measures the distance (in standard deviations StdDev) and direction
// of the item from its mean (U):
//     z = (x-StdDev) / U
// A value of zero indicates that the data item x is equal to the mean U, while
// positive or negative values show that the data item is above (x>U) or below
// (x Values of +2 and -2 show that the data item is two standard deviations
// above or below the chosen mean, respectively, and over 95.5% of all data
// items are contained within these two horizontal references (see Figure 1).
// We substitute x with the closing price C, the mean U with simple moving
// average (SMA) of n periods (n), and StdDev with the standard deviation of
// closing prices for n periods, the above formula becomes:
//     Z_score = (C - SMA(n)) / StdDev(C,n)
// The z-score indicator is not new, but its use can be seen as a supplement to
// Bollinger bands. It offers a simple way to assess the position of the price
// vis-a-vis its resistance and support levels expressed by the Bollinger Bands.
// In addition, crossings of z-score averages may signal the start or the end of
// a tradable trend. Traders may take a step further and look for stronger signals
// by identifying common crossing points of z-score, its average, and average of average.
//
// You can change long to short in the Input Settings
// Please, use it only for learning or paper trading. Do not for real trading.
////////////////////////////////////////////////////////////
strategy(title="Z-Score Strategy", shorttitle="Z-Score Strategy")
Period = input(20, minval=1)
Trigger = input(0)
reverse = input(false, title="Trade reverse")
hline(Trigger, color=purple, linestyle=line)
xStdDev = stdev(close, Period)
xMA = sma(close, Period)
nRes = (close - xMA) / xStdDev
pos = iff(nRes > Trigger, 1,
	   iff(nRes < Trigger, -1, nz(pos[1], 0)))
possig = iff(reverse and pos == 1, -1,
          iff(reverse and pos == -1, 1, pos))
if (possig == 1)
    strategy.entry("Long", strategy.long)
if (possig == -1)
    strategy.entry("Short", strategy.short)
barcolor(possig == -1 ? red: possig == 1 ? green : blue )
plot(nRes, color=blue, title="Z-Score")
- Стратегия отмены тренда полос Боллинджера
- Количественная стратегия торговли на основе StochRSI
- Стратегия выхода из двойного EMA
- Торговая стратегия RSI аллигатора
- Стратегия сочетания RSI и стохастического RSI
- Стратегия перекрестного перехода двойной железной дороги
- Краткосрочная стратегия торговли на основе SMA и EMA
- Динамическая стратегия импульса
- Стратегия торговли биткойнами в течение суток Джона на основе нескольких индикаторов
- Стратегия медленного среднего движения
- Стратегия реверсионного ретрассемента Фибоначчи
- Двухфакторная стратегия торговли
- Двойная стратегия торговли EMA Golden Cross
- Стратегия торговли BTC, основанная на перекрестном использовании скользящей средней
- Стратегия раннего оповещения по снижению показателя MACD
- Стратегия адаптивной скользящей средней
- Стратегия торговли золотым соотношением среднего обратного тренда
- Тенденционная стратегия торговли на основе нескольких скользящих средних
- Стратегия сигнала покупки с двойным индикатором
- Стратегия двойной кроссоверной торговли скользящими средними