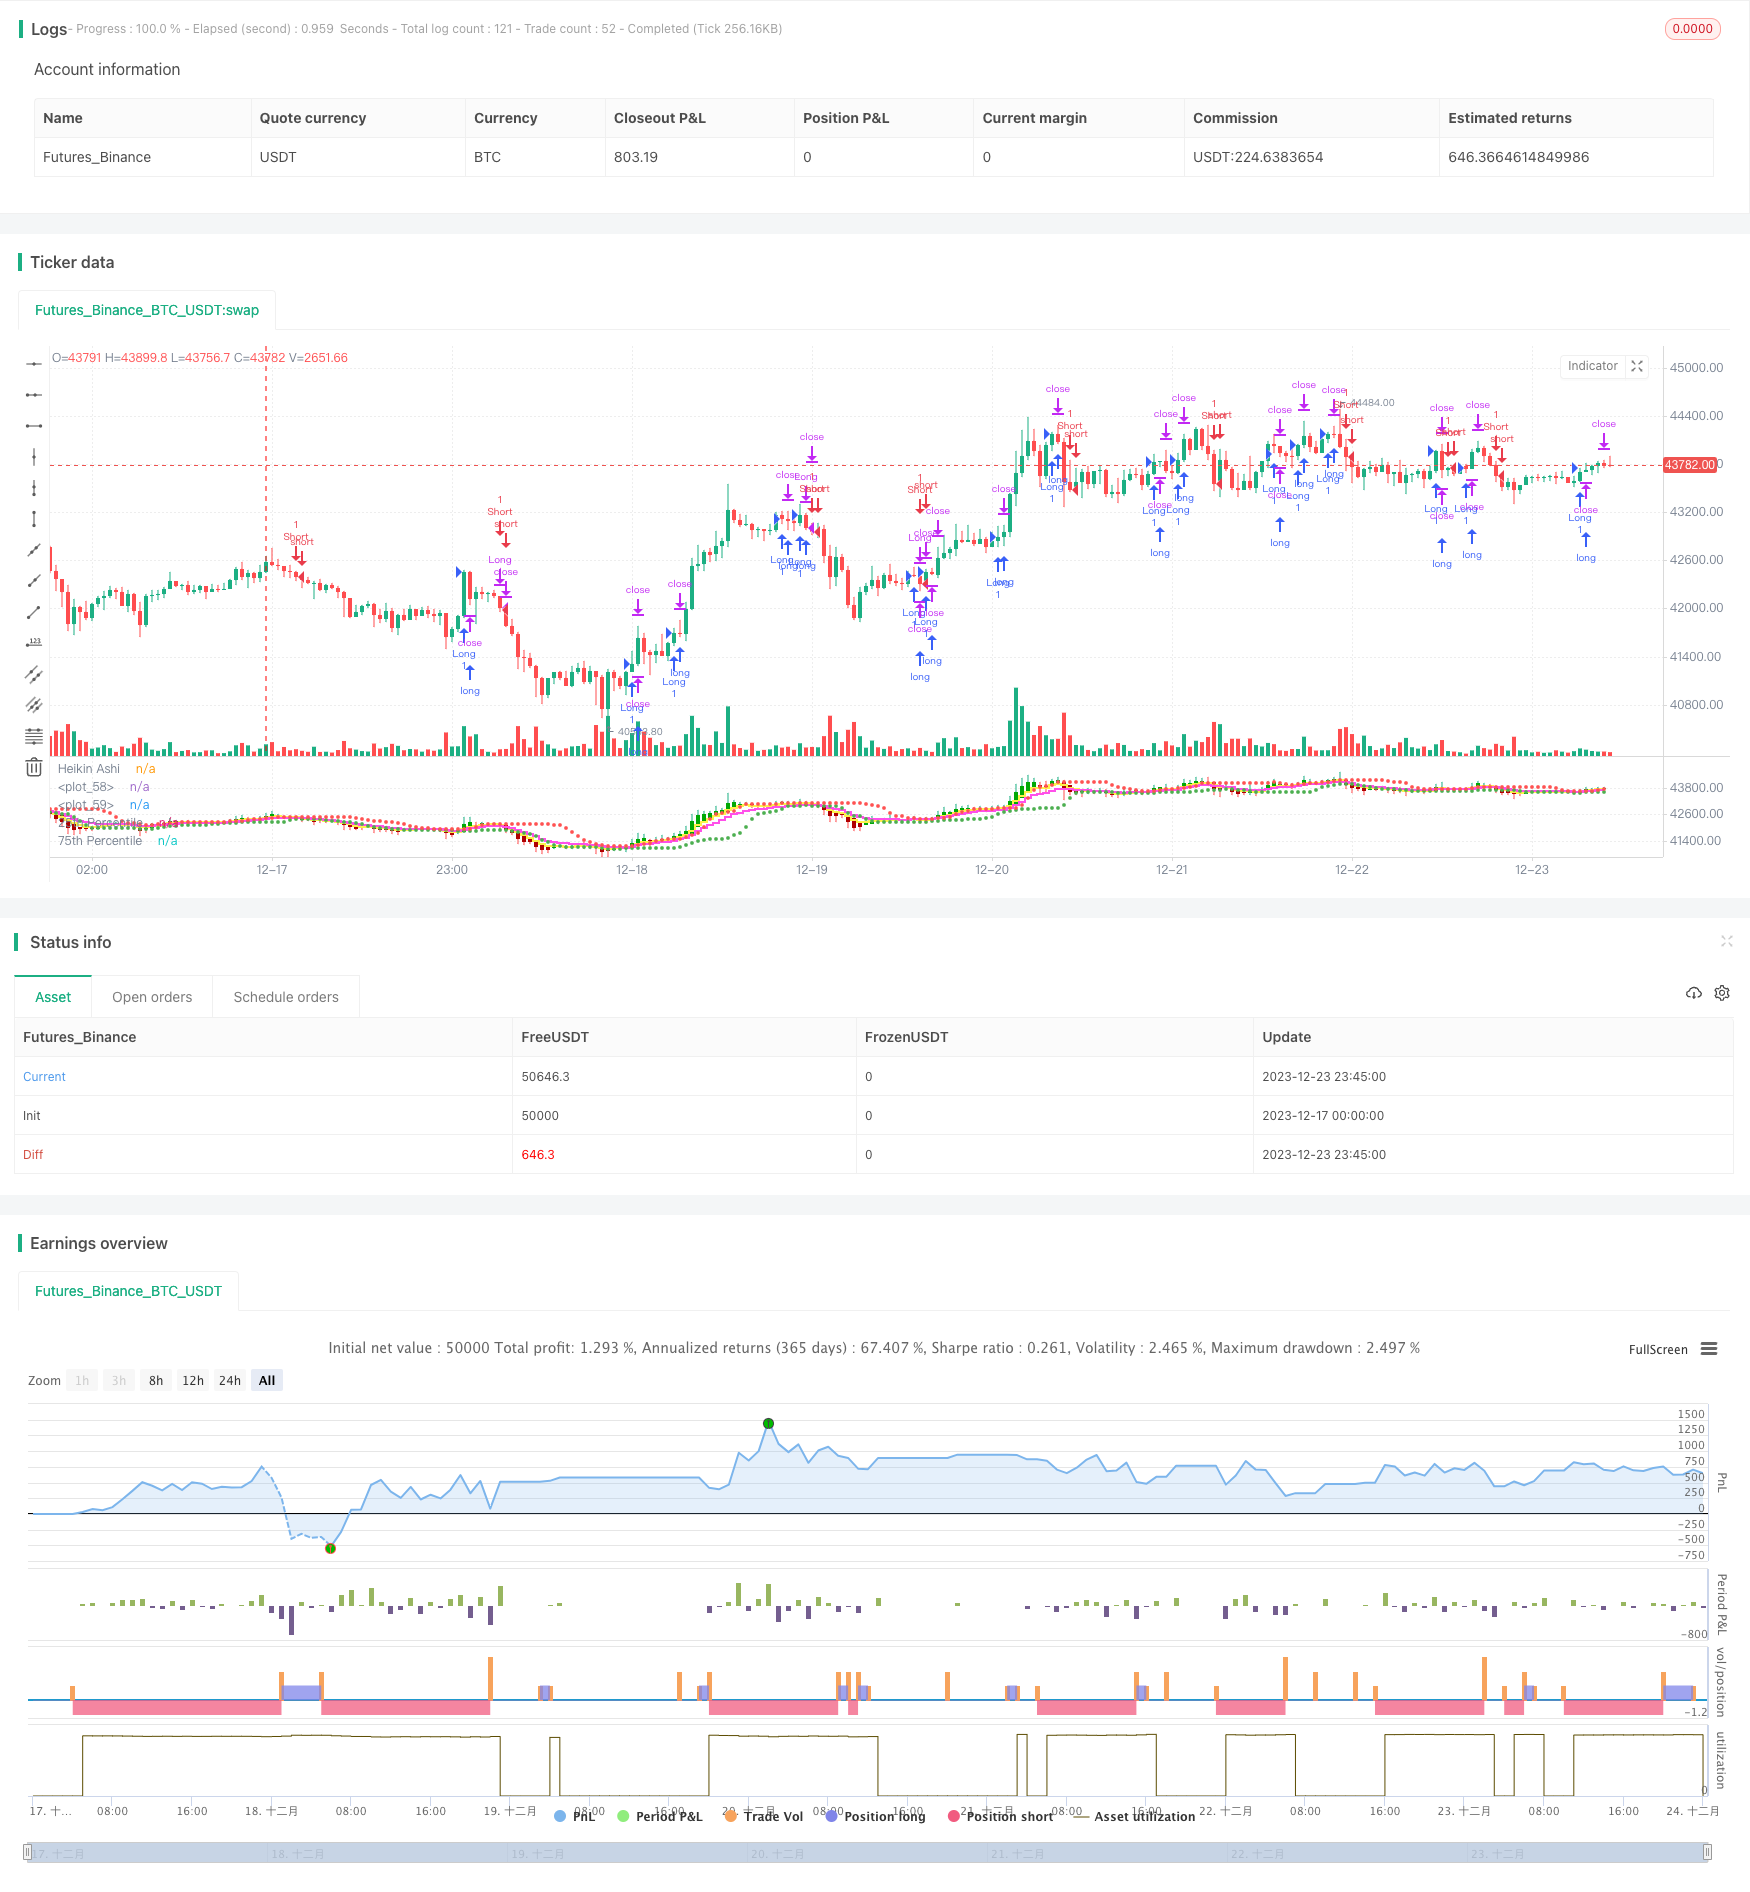
Стратегия торговли скользящей средней Хайнаха, основанная на процентилях

Обзор
Стратегия основана на генерировании сигналов для торгов на средней линии Хайн-Аши. При этом создание сигналов для покупки и продажи учитывает два фактора: перекрестность цены закрытия Хайн-Аши с уровнем цены 75%, а также то, что цена закрытия Хайн-Аши выше, чем движущаяся средняя.
Стратегический принцип
Эта стратегия использует среднюю линию Хайн-Аши вместо обычной K-линии для анализа, которая фильтрует рыночный шум и помогает обнаруживать тенденции и обратные сигналы. В частности, стратегия объединяет процентные каналы и движущиеся средние для создания торговых сигналов:
- Сигналы покупки появляются, когда цена Hyndai пересекает 75-процентную отметку на закрытии.
- Сигнал продажи появляется при прохождении 5-дневной скользящей средней по цене закрытия H&A.
Кроме того, стратегия предусматривает установку стоп-дистанций и отслеживание стоп-порогов для контроля одностороннего риска.
Стратегические преимущества
- Использование средней линии Хайн-Аша позволяет более четко идентифицировать тенденции и своевременно обнаруживать обратные сигналы.
- В сочетании с процентным каналом можно определить, находится ли цена в состоянии перегрева или перепродажи, чтобы определить время покупки и продажи.
- Установка и отслеживание стоп-убытков помогает активно контролировать риски и избегать потерь, превышающих допустимые.
Стратегический риск
- Сама по себе средняя линия Хайна-Аха создает задержку, которая может пропустить оптимальные точки для коротких операций.
- Процентные каналы не могут полностью определить точку перехода цены, существует определенный уровень ложного сигнала.
- Неправильно установленная стоп-дистанция может быть слишком свободной или слишком плотной, что может повлиять на эффективность стратегии.
Для снижения вышеуказанного риска можно соответствующим образом скорректировать циклы скользящих средних или скорректировать стоп-процент и т. д.
Оптимизация стратегии
- Тестируйте различные комбинации скользящих средних, чтобы найти оптимальные параметры.
- Тестирование различных параметров процентных каналов, чтобы убедиться в том, что цены находятся в наиболее горячей зоне.
- В сочетании с другими показателями проверяются сигналы о покупке и продаже, фильтруются фальшивые сигналы.
- Динамическая настройка стоп-расстояния.
Подвести итог
Эта стратегия объединяет несколько индикаторов, таких как средняя линия Хайн-Аша, процентный канал и движущаяся средняя, в торговую систему. Система может эффективно идентифицировать направление тенденции и установить остановку для контроля риска. Это стоит рассмотреть как количественную торговую стратегию.
/*backtest
start: 2023-12-17 00:00:00
end: 2023-12-24 00:00:00
period: 45m
basePeriod: 5m
exchanges: [{"eid":"Futures_Binance","currency":"BTC_USDT"}]
*/

//@version=5
strategy("HK Percentile Interpolation One",shorttitle = "HKPIO", overlay=false, default_qty_type = strategy.cash, default_qty_value = 5000, calc_on_order_fills = true, calc_on_every_tick = true)

// Input parameters
stopLossPercentage = input(3, title="Stop Loss (%)") // User can set Stop Loss as a percentage
trailStopPercentage = input(1.5, title="Trailing Stop (%)") // User can set Trailing Stop as a percentage
lookback = input.int(14, title="Lookback Period", minval=1) // User can set the lookback period for percentile calculation
yellowLine_length = input.int(5, "Yellow", minval=1) // User can set the length for Yellow EMA
purplLine_length = input.int(10, "Purple", minval=1) // User can set the length for Purple EMA
holdPeriod = input.int(200, title="Minimum Holding Period", minval=10) // User can set the minimum holding period
startDate = timestamp("2021 01 01")  // User can set the start date for the strategy

// Calculate Heikin Ashi values
haClose = ohlc4
var float haOpen = na
haOpen := na(haOpen[1]) ? (open + close) / 2 : (haOpen[1] + haClose[1]) / 2
haHigh = math.max(nz(haOpen, high), nz(haClose, high), high)
haLow = math.min(nz(haOpen, low), nz(haClose, low), low)

// Calculate Moving Averages
yellowLine = ta.ema(haClose, yellowLine_length)
purplLine = ta.ema(haClose, purplLine_length)

// Calculate 25th and 75th percentiles
p25 = ta.percentile_linear_interpolation(haClose, lookback, 28)
p75 = ta.percentile_linear_interpolation(haClose, lookback, 78)

// Generate buy/sell signals
longSignal = ta.crossover(haClose, p75) and haClose > yellowLine
sellSignal = ta.crossunder(haClose, yellowLine)
longSignal1 = ta.crossover(haClose, p75) and haClose > purplLine
sellSignal1 = ta.crossunder(haClose, purplLine)

// Set start time and trade conditions
if(time >= startDate)
    // When longSignal is true, enter a long trade and set stop loss and trailing stop conditions
    if (longSignal)
        strategy.entry("Long", strategy.long, 1)
        strategy.exit("Sell", "Long", stop=close*(1-stopLossPercentage/100), trail_points=close*trailStopPercentage/100, trail_offset=close*trailStopPercentage/100)
    // When sellSignal is true, close the long trade
    if (sellSignal)
        strategy.close("Long")
    // When sellSignal1 is true, enter a short trade
    if (sellSignal1)
        strategy.entry("Short", strategy.short, 1)
    // When longSignal1 is true, close the short trade
    if (longSignal1)
        strategy.close("Short")

// Plot Heikin Ashi candles
plotcandle(haOpen, haHigh, haLow, haClose, title="Heikin Ashi", color=(haClose >= haOpen ? color.rgb(1, 168, 6) : color.rgb(176, 0, 0)))

// Plot 25th and 75th percentile levels
plot(p25, title="25th Percentile", color=color.green, linewidth=1, style=plot.style_circles)
plot(p75, title="75th Percentile", color=color.red, linewidth=1, style=plot.style_circles)

// Plot Moving Averages
plot(yellowLine, color = color.rgb(254, 242, 73, 2), linewidth = 2, style = plot.style_stepline)
plot(purplLine, color = color.rgb(255, 77, 234, 2), linewidth = 2, style = plot.style_stepline)