Динамическая стратегия возвращения Санта-Клауса
Обзор
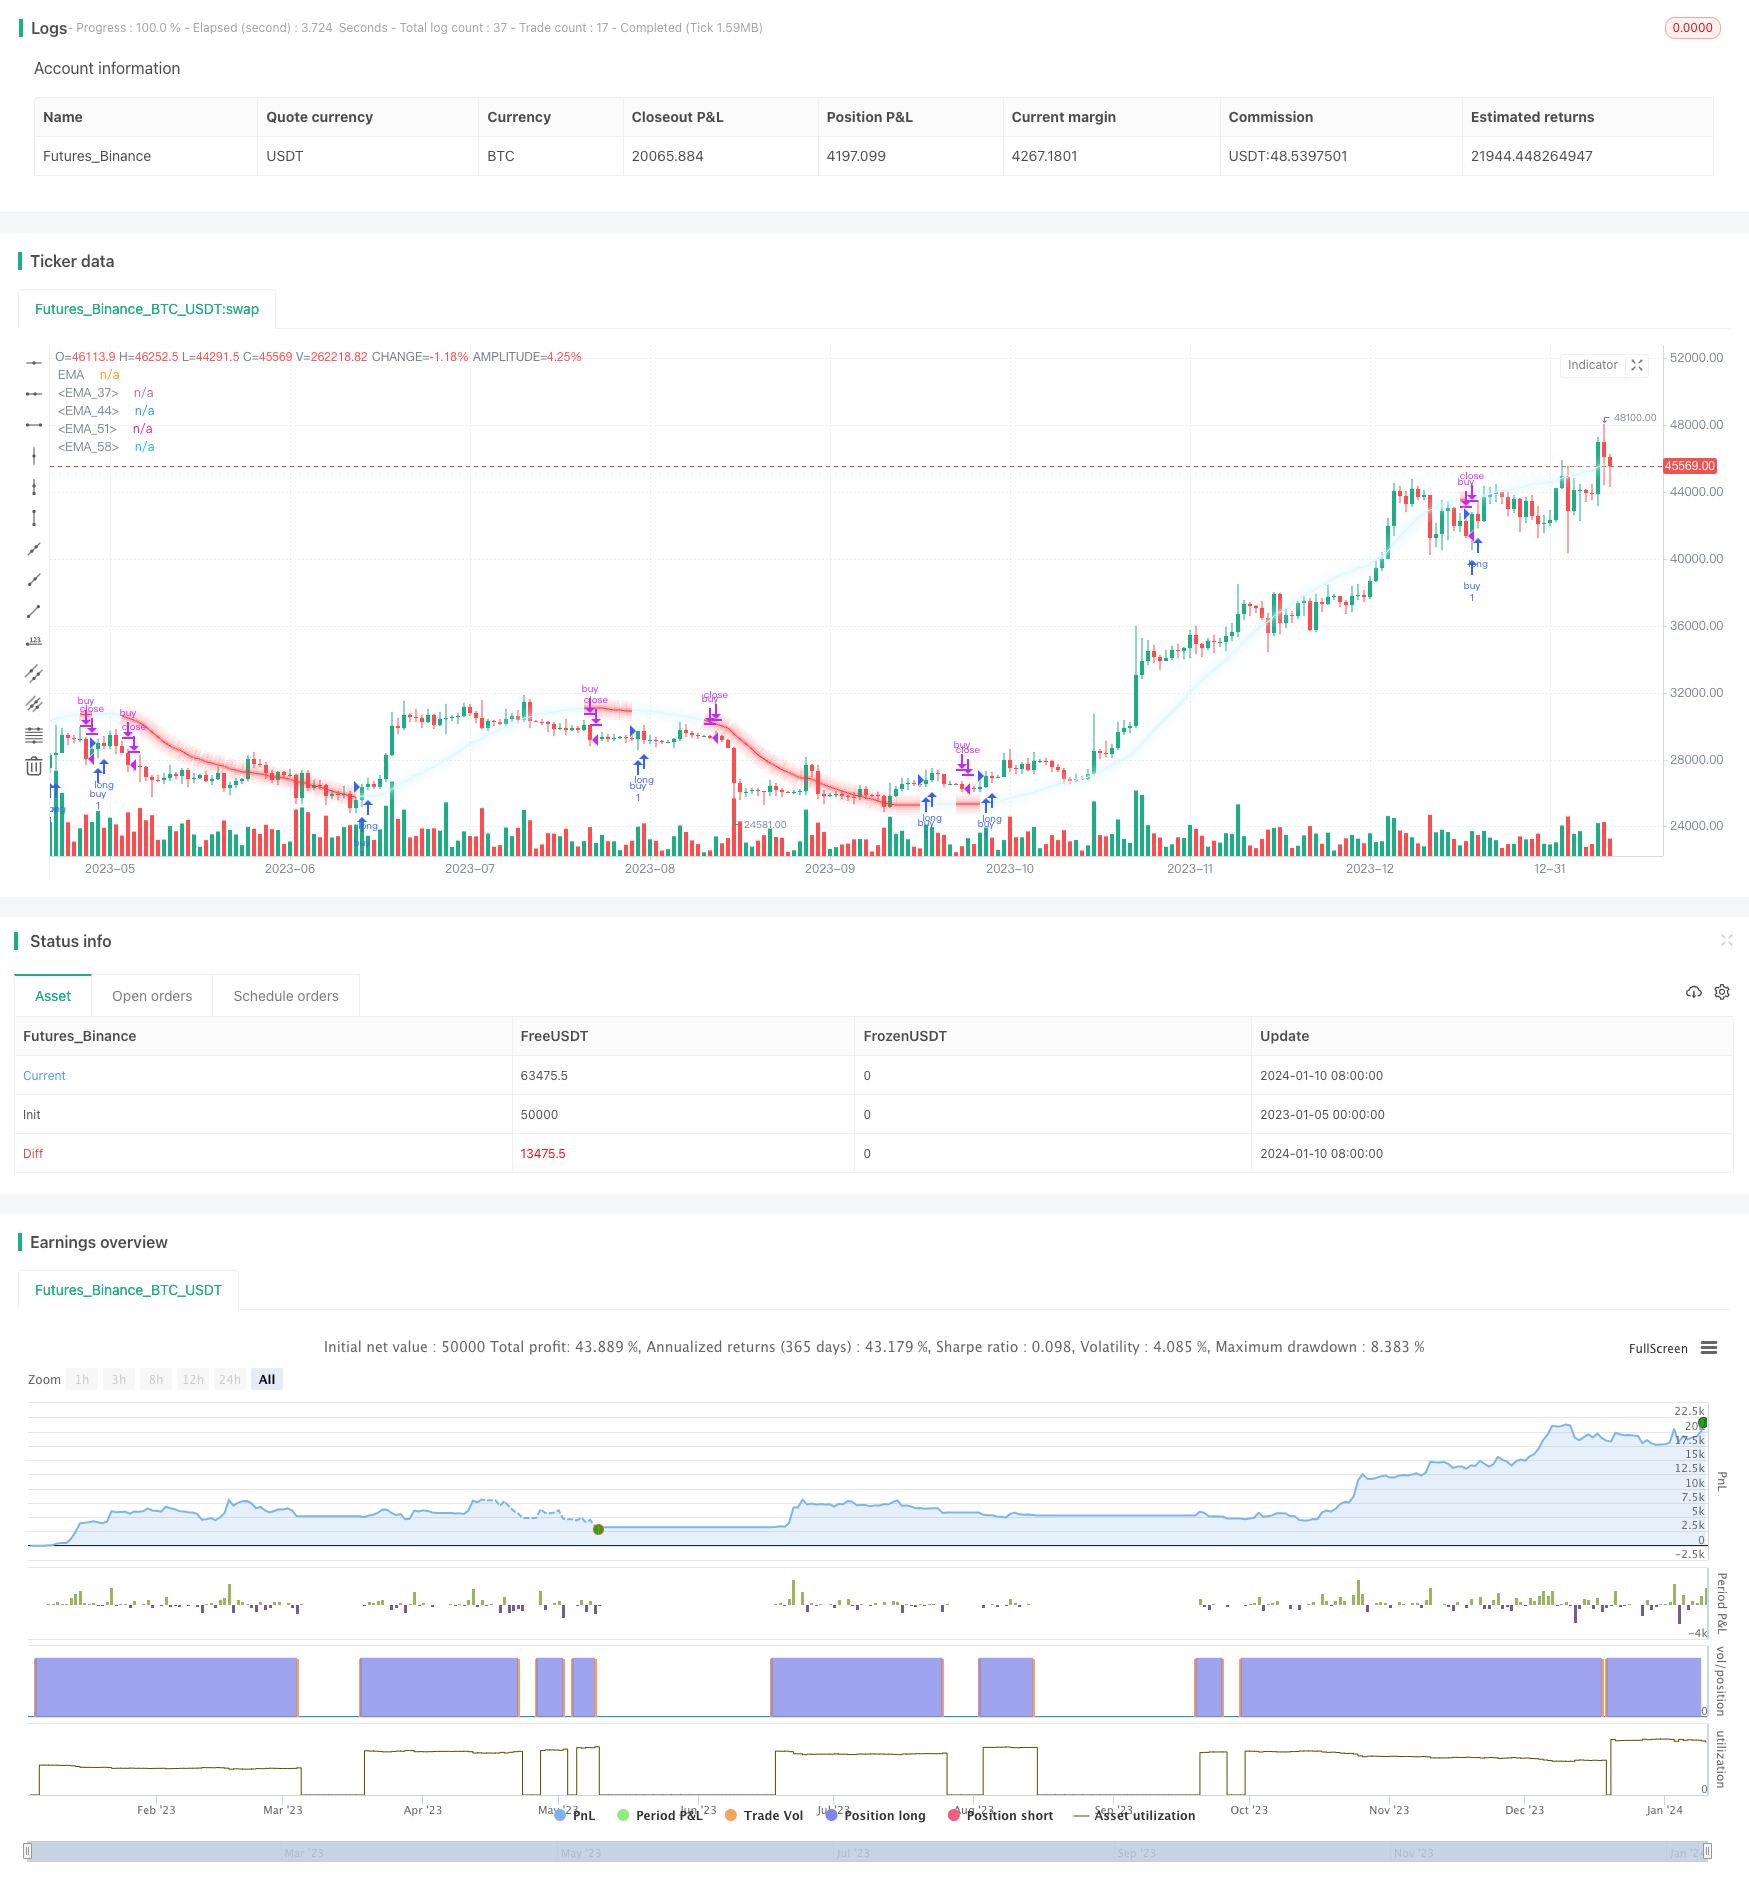
Стратегия динамического возвращения Санта-Клауса - это количественная торговая стратегия, которая определяет потенциальные точки входа и выхода на основе динамического возвращения отношений между ценой и столбовым индексом. Стратегия использует динамическую среднюю линию с параметрами, регулируемыми по длине, чтобы нарисовать обратную линию тренда цены.
Стратегический принцип
В основе этой стратегии лежит вычисление линейной регрессии между ценой и столбовым индексом. Сначала вычисляются простое скользящее среднее и стандартное расхождение длиной N. Затем, на основе соответствующих коэффициентов и стандартных значений расхождения, вычисляются склонность k и сечение b для линии регрессии. Таким образом, получается динамически скорректированное линейное регрессионное уравнение:
y = kx + b
где x - индекс столбца, y - цена.
Если регрессионная линия поднимается, и цена закрытия выше цены открытия и предыдущей минутной максимума, это создает сигнал покупки; если регрессионная линия падает, и цена закрытия ниже цены открытия и предыдущей минутной минимума, это создает сигнал продажи.
Стратегические преимущества
- Динамические параметры, которые можно настроить, чтобы адаптироваться к изменениям цены в разные периоды, путем корректировки значения N
- Возвратная связь учитывает влияние временных факторов и лучше отражает тенденционность цен
- Сочетание множества условных суждений создает торговые сигналы, чтобы избежать заблуждений
- Интуитивное отображение тенденции к возврату цены, четко читается
Риски и решения
- Неправильная настройка значения N может привести к тому, что линия регрессии будет слишком гладкой или чувствительной
- Решение: Настройка N-значений для поиска оптимального баланса
- Короткосрочные колебания цен, провал регрессивного суждения
- Решение: фильтрация входных точек в сочетании с другими показателями.
- Круговое соотношение учитывает только один момент времени и может упустить локальные предельные значения
- Решение: установить надлежащий промежуток времени, чтобы избежать ошибочных суждений
Направление оптимизации
- Добавление механизма динамического выхода, регулирование стоп-пойнтов в зависимости от регрессии
- Проверка сигналов в сочетании с такими показателями, как объем сделок, для уменьшения ошибочных сделок
- Автоматическая оптимизация параметров с использованием методов машинного обучения для адаптации к более широким рыночным условиям
- Дополнительные графические изображения, чтобы визуализировать результаты стратегии
Подвести итог
Динамическая стратегия возвращения Санта-Клауса использует динамическую обратную связь между ценой и временем для реализации гибкой, интуитивной и параметрически регулируемой системы количественных сделок. Логика стратегии ясна, легко понятна и может быть использована для различных торговых продуктов и циклов путем оптимизации параметров.
/*backtest
start: 2023-01-05 00:00:00
end: 2024-01-11 00:00:00
period: 1d
basePeriod: 1h
exchanges: [{"eid":"Futures_Binance","currency":"BTC_USDT"}]
*/

//@version=5
// Creator - TradeAI
strategy('Moving Santa Claus Strategy | TradeAI', overlay=true)

// Set the length of the moving average
length = input(64)

// Calculate the moving averages and standard deviations
x = bar_index
y = close
x_ = ta.sma(x, length)
y_ = ta.sma(y, length)
mx = ta.stdev(x, length)
my = ta.stdev(y, length)
c = ta.correlation(x, y, length)
slope = c * (my / mx)

// Calculate the parameters of the regression line
inter = y_ - slope * x_
reg = x * slope + inter

// Set the line color based on whether EMA is moving up or down
var color lineColor = na
if (reg > reg[1] and (close > open and close > high[1]))
    lineColor := color.new(#d8f7ff, 0)
if (reg < reg[1] and (close < open and close < low[1]))
    lineColor := color.new(#ff383b, 0)

// Plot the EMA line with different thicknesses
plot(reg, color=lineColor, title="EMA")

var color lineColorrr = na
if (reg > reg[1] and (close > open and close > high[1]))
    lineColorrr := color.new(#d8f7ff, 77)
if (reg < reg[1] and (close < open and close < low[1]))
    lineColorrr := color.new(#ff383b, 77)
plot(reg, color=lineColorrr, title="EMA", linewidth=5)

var color lineColorr = na
if (reg > reg[1] and (close > open and close > high[1]))
    lineColorr := color.new(#d8f7ff, 93)
if (reg < reg[1] and (close < open and close < low[1]))
    lineColorr := color.new(#ff383b, 93)
plot(reg, color=lineColorr, title="EMA", linewidth=10)

var color lineColorrrr = na
if (reg > reg[1] and (close > open and close > high[1]))
    lineColorrrr := color.new(#d8f7ff, 97)
if (reg < reg[1] and (close < open and close < low[1]))
    lineColorrrr := color.new(#ff383b, 97)
plot(reg, color=lineColorr, title="EMA", linewidth=15)

var color lineColorrrrr = na
if (reg > reg[1] and (close > open and close > high[1]))
    lineColorrrrr := color.new(#d8f7ff, 99)
if (reg < reg[1] and (close < open and close < low[1]))
    lineColorrrrr := color.new(#ff383b, 99)
plot(reg, color=lineColorr, title="EMA", linewidth=20)

// Implement trading strategy based on EMA direction
if reg > reg[1] and (close > open and close > high[1])
    strategy.entry('buy', strategy.long)

if reg < reg[1] and (close < open and close < low[1])
    strategy.close('buy')