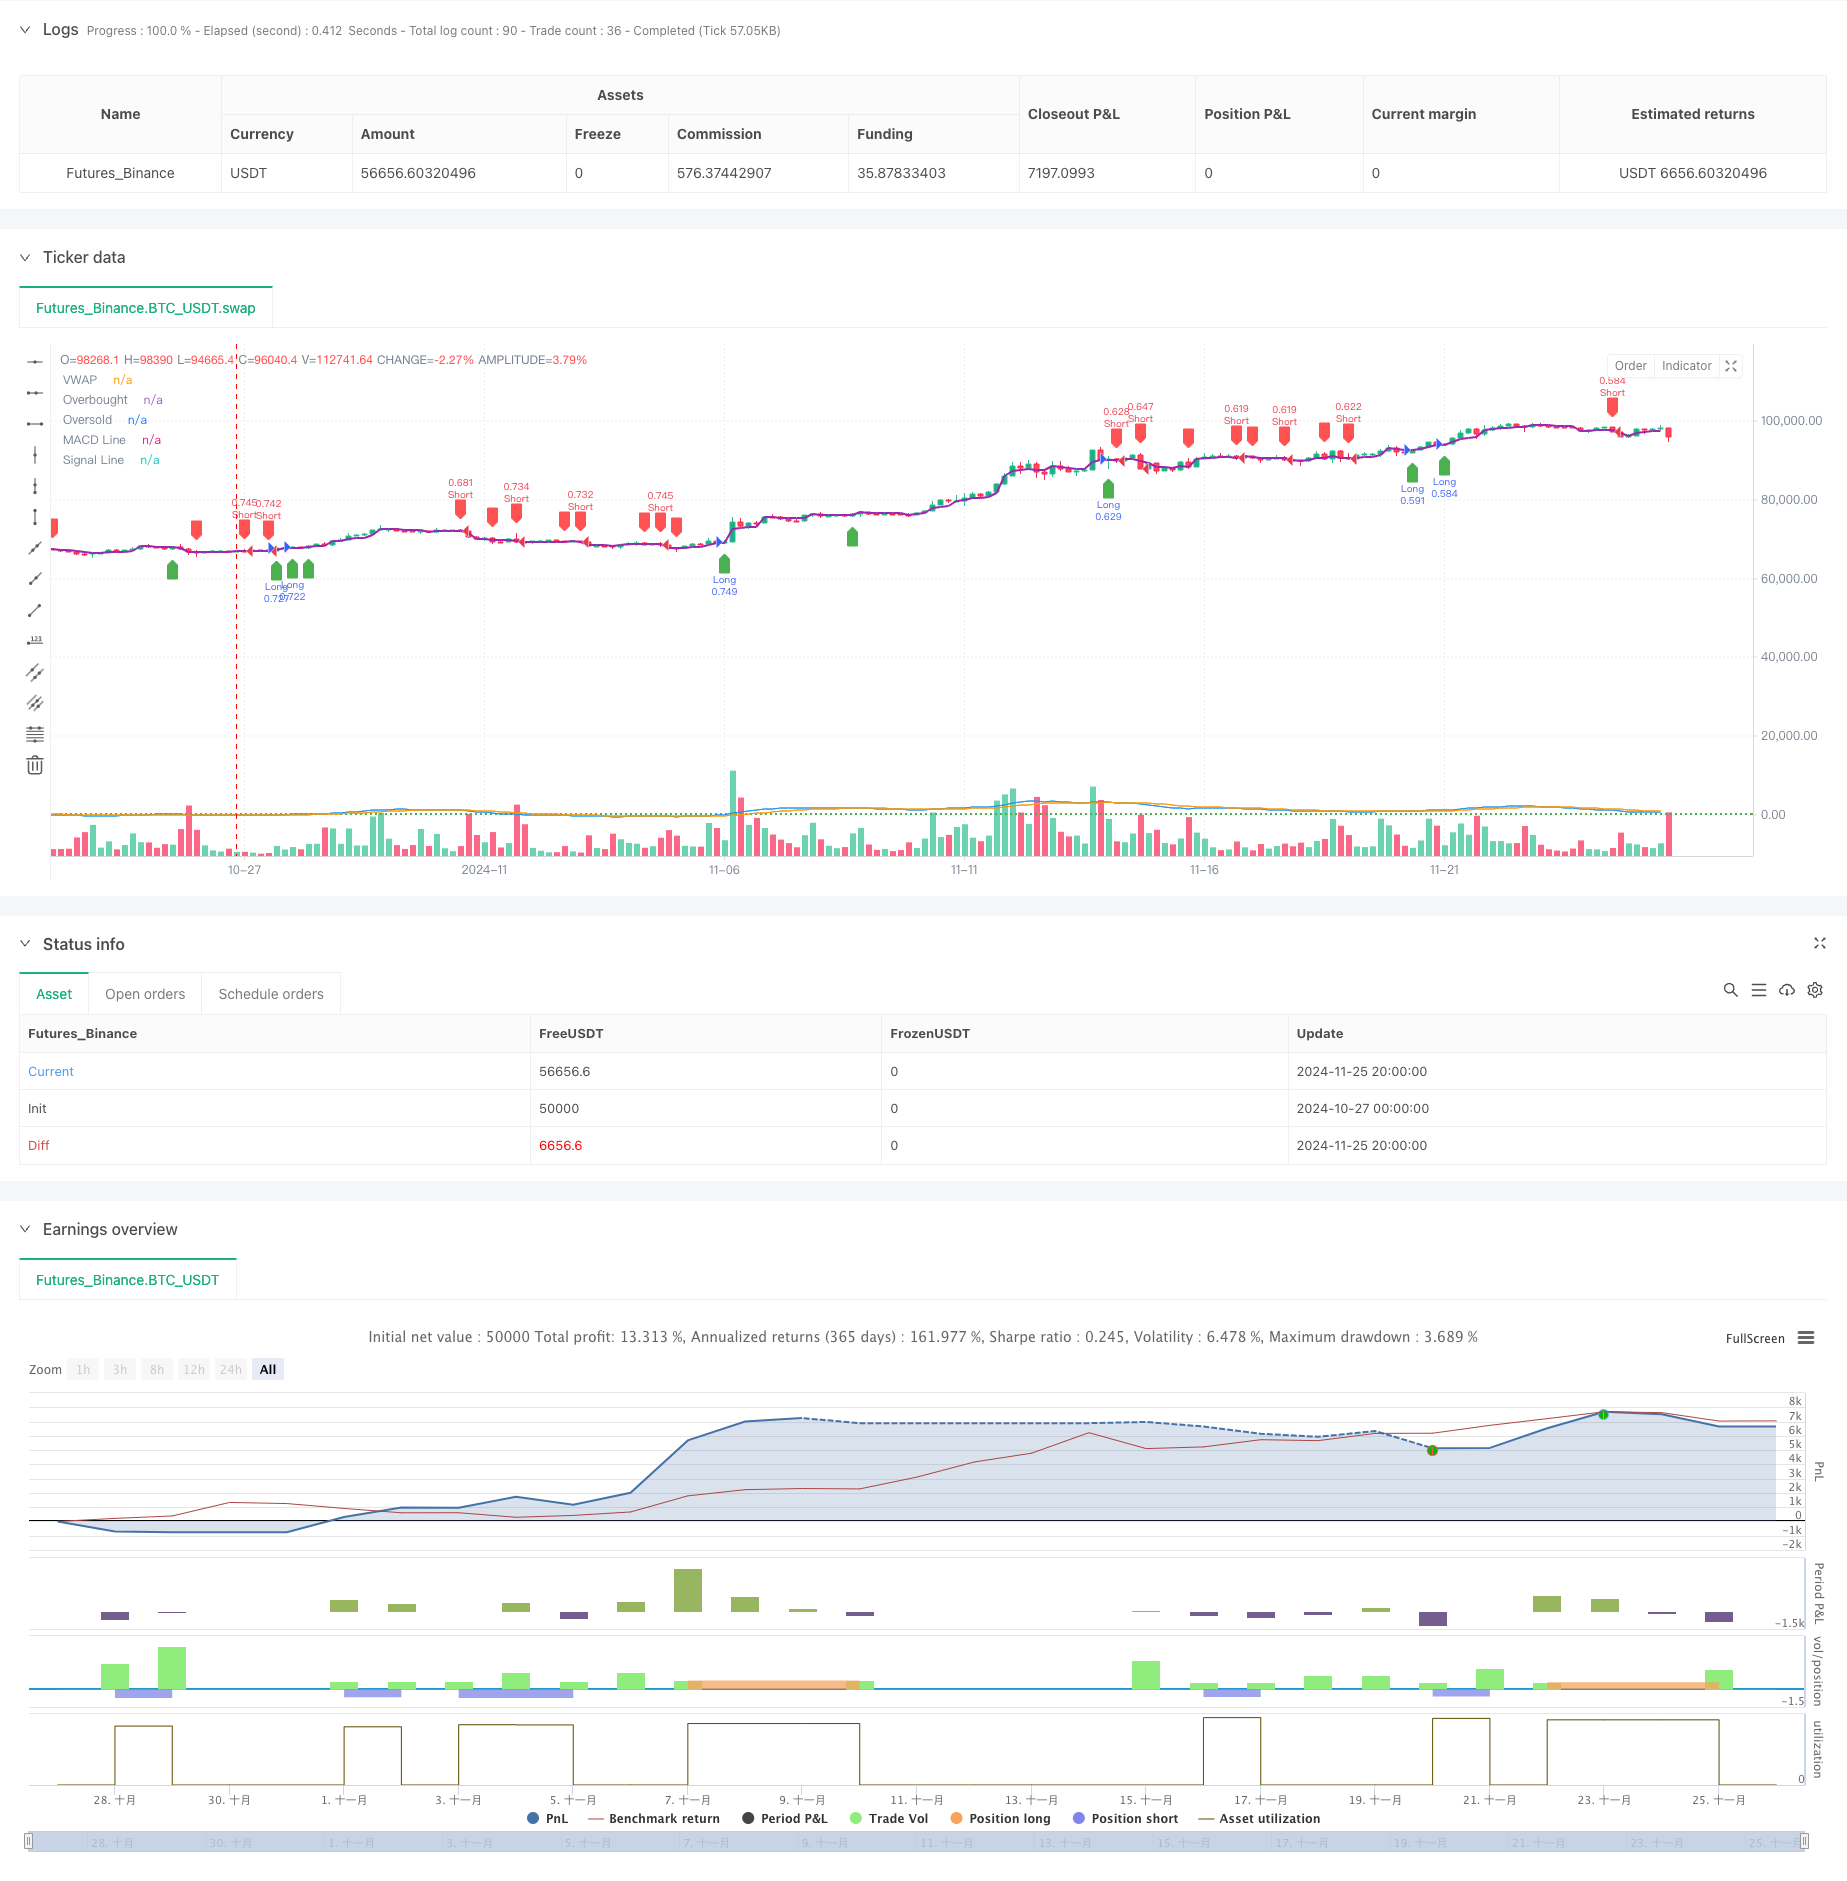
Обзор
Это количественная торговая стратегия, основанная на трёх технических показателях VWAP, MACD и RSI. Эта стратегия использует множественные сигналы для идентификации рыночных возможностей для покупки и продажи путем комбинирования сбалансированных средневесовых средних цен (VWAP), скользящих средних сближения и распределения (MACD) и относительно сильных показателей (RSI). Стратегия использует процентный стоп-стоп для управления рисками и использует стратегическое управление позициями для оптимизации использования средств.
Стратегический принцип
Основная логика стратегии основана на комплексном анализе трех основных показателей:
- Использование VWAP в качестве основной линии отсчета тренда, рассматриваемой как потенциальный сигнал перехода тренда, когда цена превышает VWAP
- MACD используется для определения силы и направления тренда, положительные значения указывают на тенденцию к росту, отрицательные значения - на тенденцию к снижению
- RSI используется для определения того, находится ли рынок в состоянии перекупа или перепродажи, чтобы избежать входа в крайних случаях
При покупке необходимо соблюдать следующие условия:
- Цены выросли до VWAP
- MACD столбик - положительное значение
- RSI не достиг уровня перекупа
Условия продажи должны соответствовать:
- Цены упали до VWAP
- MACD столбик отрицательный
- RSI не достиг уровня oversold
Стратегические преимущества
- Круговая проверка с использованием нескольких технологических показателей повышает надежность сигнала
- Введение VWAP в качестве коэффициента загрузки для более глубокого анализа рынка
- Использование RSI для фильтрации экстремальных ситуаций снижает риск ложных прорывов
- Использование стоп-стоп-потерей в процентном соотношении, динамическая адаптация к различным ценовым диапазонам
- position sizing - динамическое управление позициями на основе соотношения чистой стоимости счетов
- Ясная логика стратегии, ее легко понять и поддерживать
Стратегический риск
- Непостоянные рынки могут привести к частым сделкам и увеличению их стоимости.
- Многочисленные индикаторы могут привести к задержке сигнала и повлиять на время запуска.
- Фиксированный стоп-лосс может не подходить для всех рыночных условий
- Повышение риска в период высокой волатильности без учета изменений волатильности рынка
- Отсутствие фильтрации на прочность тренда, что может привести к избыточному количеству сигналов на рынках с слабым трендом.
Направление оптимизации стратегии
- Введение динамического корректировки стоп-лосса ATR, чтобы лучше адаптироваться к рыночным колебаниям
- Добавление фильтров интенсивности тренда, чтобы уменьшить ложные сигналы о колебаниях рынка
- Оптимизация VWAP-циклических настроек с учетом многоциклических VWAP-комплексов
- Введение механизма подтверждения перехода, повышение надежности прорывного сигнала
- Подумайте о добавлении временной фильтрации, чтобы избежать торговли в период низкой ликвидности
- Механизм размещения позиций с динамической корректировкой размеров позиций в зависимости от рыночных условий
Подвести итог
Стратегия создает относительно целостную торговую систему, используя в комплексе три классических технических показателя VWAP, MACD и RSI. Стратегия в своем дизайне уделяет внимание надежности сигналов и управлению рисками, чтобы повысить качество торговли с помощью перекрестной проверки нескольких показателей. Хотя есть некоторые аспекты, требующие оптимизации, общая структура разумна и имеет хорошую масштабируемость.
/*backtest
start: 2024-10-27 00:00:00
end: 2024-11-26 00:00:00
period: 4h
basePeriod: 4h
exchanges: [{"eid":"Futures_Binance","currency":"BTC_USDT"}]
*/

//@version=5
strategy("pbs", overlay=true, default_qty_type=strategy.percent_of_equity, default_qty_value=100)

// Input for take-profit and stop-loss
takeProfitPercent = input.float(0.5, title="Take Profit (%)", step=0.1) / 100
stopLossPercent = input.float(0.25, title="Stop Loss (%)", step=0.1) / 100


macdFastLength = input.int(12, title="MACD Fast Length")
macdSlowLength = input.int(26, title="MACD Slow Length")
macdSignalLength = input.int(9, title="MACD Signal Length")


rsiLength = input.int(14, title="RSI Length")
rsiOverbought = input.int(70, title="RSI Overbought Level", step=1)
rsiOversold = input.int(30, title="RSI Oversold Level", step=1)


vwap = ta.vwap(close)


[macdLine, signalLine, _] = ta.macd(close, macdFastLength, macdSlowLength, macdSignalLength)
macdHistogram = macdLine - signalLine

rsi = ta.rsi(close, rsiLength)


plot(vwap, color=color.purple, linewidth=2, title="VWAP")
hline(rsiOverbought, "Overbought", color=color.red, linestyle=hline.style_dotted)
hline(rsiOversold, "Oversold", color=color.green, linestyle=hline.style_dotted)
plot(macdLine, color=color.blue, title="MACD Line")
plot(signalLine, color=color.orange, title="Signal Line")

// Buy Condition
longCondition = ta.crossover(close, vwap) and macdHistogram > 0 and rsi < rsiOverbought

// Sell Condition
shortCondition = ta.crossunder(close, vwap) and macdHistogram < 0 and rsi > rsiOversold

// Execute trades based on conditions
if (longCondition)
    strategy.entry("Long", strategy.long)
    strategy.exit("Take Profit/Stop Loss", "Long", limit=close * (1 + takeProfitPercent), stop=close * (1 - stopLossPercent))

if (shortCondition)
    strategy.entry("Short", strategy.short)
    strategy.exit("Take Profit/Stop Loss", "Short", limit=close * (1 - takeProfitPercent), stop=close * (1 + stopLossPercent))

// Plot Buy/Sell Signals
plotshape(series=longCondition, location=location.belowbar, color=color.green, style=shape.labelup, title="Buy Signal")
plotshape(series=shortCondition, location=location.abovebar, color=color.red, style=shape.labeldown, title="Sell Signal")