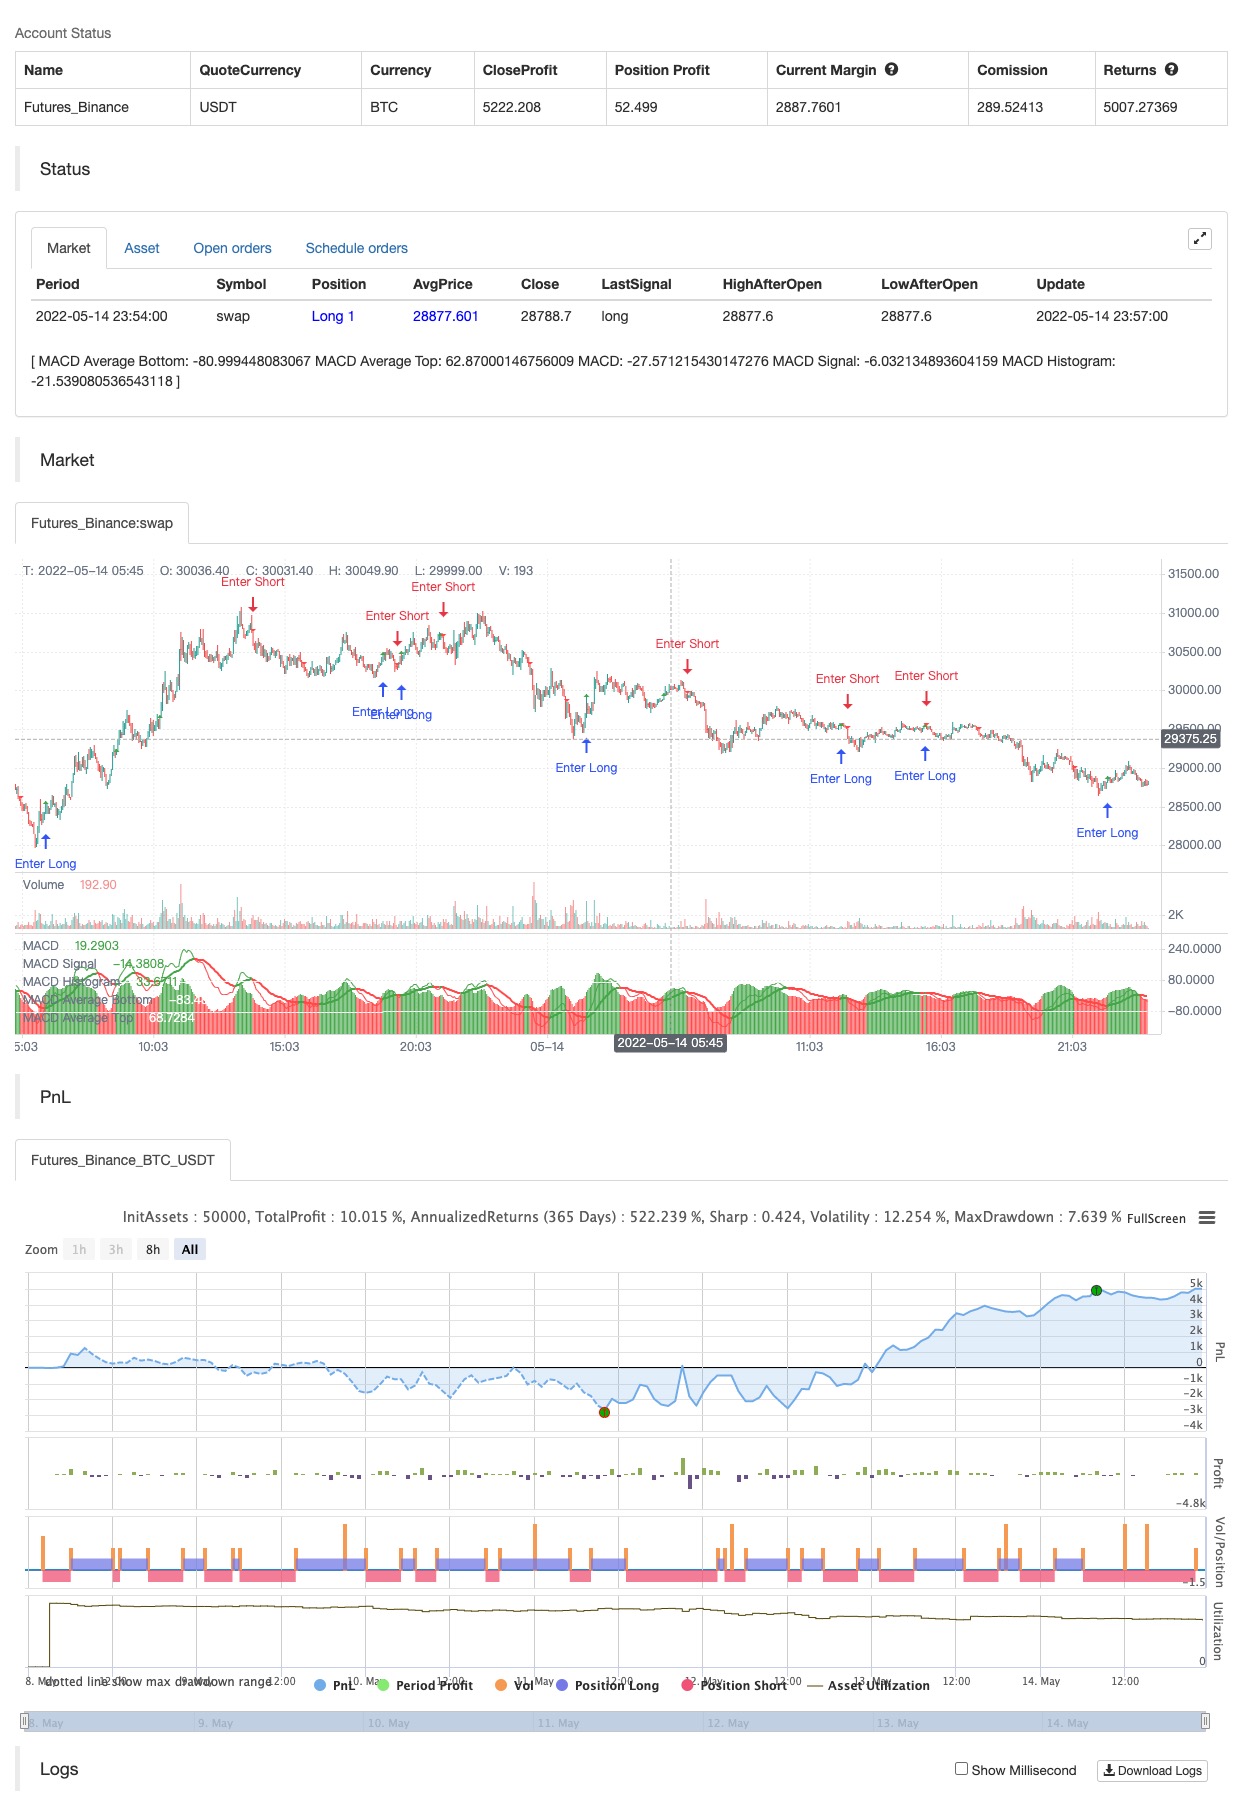
زیادہ ذہین MACD
مصنف:چاؤ ژانگ، تاریخ: 2022-05-16 16:51:56ٹیگز:آر ایم اےای ایم اےایس ایم اےڈبلیو ایم اےایم اے سی ڈی
ایک کلاسک ایم اے سی ڈی جس میں اوسط چوٹی اور ڈپ لائنیں ہیں۔ ہلکی سبز اور سرخ افقی لائنیں بالترتیب پورے اسپین کی اوسط چوٹی اور ڈپ ہیں۔ دوسری ، دو لائنوں میں سے زیادہ جرات مندانہ مجموعی چوٹی اور ڈپ اوسط کے اوپر اور نیچے چوٹیوں اور ڈپس کی اوسط ہیں۔ رنگ بھرنے سے ان اوسطوں اور ممکنہ تجارتی سیٹ اپ کو دیکھنے میں مدد ملتی ہے۔ ایم اے سی ڈی + اوسط اسکرپٹ کا دوبارہ کام۔
بیک ٹسٹ

/*backtest
start: 2022-05-08 00:00:00
end: 2022-05-14 23:59:00
period: 3m
basePeriod: 1m
exchanges: [{"eid":"Futures_Binance","currency":"BTC_USDT"}]
*/

//@version=4
//@author=Cryptonaut
//@ Cryptonaut
study("Smarter MACD", max_bars_back=500, max_labels_count=500, overlay=false, shorttitle="Smarter MACD")

///////////////////////////////////////////////////////////////////////////////////////////////////////
//  Miscellaneous block  //////////////////////////////////////////////////////////////////////////////
///////////////////////////////////////////////////////////////////////////////////////////////////////
// Inputs
showTable = input(defval=true, group="Visibility Settings", title="Show right-side monitor?")

// Variables block
showMacd = true
negativeColor      = color.red
negativeColorFaded = color.new(color.red, 50)
neutralColor       = color.yellow
neutralColorFaded  = color.new(color.yellow, 50)
positiveColor      = color.green
positiveColorFaded = color.new(color.green, 50)
transparentColor   = color.new(color.white, 100)

darkTextColor  = color.black
lightTextColor = color.white

// Functions
getMa(type, src, length) =>
    float ma = 0

    if type == "EMA"
        ma := ema(src, length)
    else if type == "RMA"
        ma := rma(src, length)
    else if type == "SMA"
        ma := sma(src, length)
    else if type == "WMA"
        ma := wma(src, length)

    return = ma

// Calculations

// Plots
// SYMBOLS; ∅ ∇ ¤ ° » ↕ ↗ ↘ ↟ ↠ ↡ ∞ ∘ ∴ ∵ ∷ ⊛ ⊚ ⊙ ⊗ ⋆ ⌢ ⌣ ⌕ ⌖ ★ ✶

///////////////////////////////////////////////////////////////////////////////////////////////////////
//  MACD block  ///////////////////////////////////////////////////////////////////////////////////////
///////////////////////////////////////////////////////////////////////////////////////////////////////
//  Calculation of trend and momentum                                                                //
///////////////////////////////////////////////////////////////////////////////////////////////////////
// Inputs
macdFastMaLength = input(defval=12, group="MACD Settings", title="MACD Fast MA Length")
macdSlowMaLength = input(defval=26, group="MACD Settings", title="MACD Slow MA Length")
macdSignalLength = input(defval=23, group="MACD Settings", title="MACD Signal Length")

// Variables block

// Functions
getMacd(fastMaLength, slowMaLength, signalLength) =>
    fastMa      = getMa("EMA", close, fastMaLength)
    slowMa      = getMa("EMA", close, slowMaLength)
    macd        = fastMa - slowMa
    macdSignal  = getMa("EMA", macd, signalLength)
    macdHistory = macd - macdSignal

    [macd, macdSignal, macdHistory]

// Calculations
[macd, macdSignal, macdHistory] = getMacd(macdFastMaLength, macdSlowMaLength, macdSignalLength)

macdGrowAbove = positiveColor
macdFallBelow = negativeColor
macdGrowBelow = negativeColorFaded
macdFallAbove = positiveColorFaded
macdColor     = (macdHistory >= 0) ? (macdHistory[1] < macdHistory ? macdGrowAbove : macdFallAbove) : (macdHistory[1] < macdHistory ? macdGrowBelow : macdFallBelow)
macdHistColor = (macdHistory >= 0) ? (macdHistory[1] < macdHistory ? color.new(macdGrowAbove, 50) : color.new(macdFallAbove, 75)) : (macdHistory[1] < macdHistory ? color.new(macdGrowBelow, 75) : color.new(macdFallBelow, 50))

macdBot       = 0.0
macdBotPoints = 0.0
macdBots      = 0
macdTop       = 0.0
macdTopPoints = 0.0
macdTops      = 0
if not barstate.isfirst
    macdBot       := macdBot[1]
    macdBotPoints := macdBotPoints[1]
    macdBots      := macdBots[1]
    macdTop       := macdTop[1]
    macdTopPoints := macdTopPoints[1]
    macdTops      := macdTops[1]

if crossover(macdHistory, 0)
    macdBot      := macdSignal

    if macdSignal < 0
        macdBotPoints := macdBotPoints + macdSignal
        macdBots      := macdBots + 1

if crossunder(macdHistory, 0)
    macdTop      := macdSignal

    if macdSignal > 0
        macdTopPoints := macdTopPoints + macdSignal
        macdTops      := macdTops + 1

macdAvgBot = macdBotPoints/macdBots
macdAvgTop = macdTopPoints/macdTops

// Plots
macdAvgBotLine = plot(showMacd ? macdAvgBot : na, color=transparentColor, title="MACD Average Bottom")
macdAvgTopLine = plot(showMacd ? macdAvgTop : na, color=transparentColor, title="MACD Average Top")
fill(macdAvgBotLine, macdAvgTopLine, color=color.new(color.white, 90), title="MACD Average Range")

plot(showMacd ? macd : na,        color=macdColor, linewidth=1, title="MACD")
plot(showMacd ? macdSignal : na,  color=macdColor, linewidth=2, title="MACD Signal")
plot(showMacd ? macdHistory : na, color=macdHistColor, style=plot.style_columns, title="MACD Histogram")

plotshape(showMacd and (macdBot > macdBot[1]) ? macdSignal + (macdAvgBot * 0.25) : na, color=color.green, location=location.absolute, size=size.tiny, style=shape.triangleup,   title="MACD Bullish Divergence")
plotshape(showMacd and (macdTop < macdTop[1]) ? macdSignal + (macdAvgTop * 0.25) : na, color=color.red,   location=location.absolute, size=size.tiny, style=shape.triangledown, title="MACD Bearish Divergence")

if showMacd and (macdBot > macdBot[1])
    strategy.entry("Enter Long", strategy.long)
else if showMacd and (macdTop < macdTop[1])
    strategy.entry("Enter Short", strategy.short)
متعلقہ مواد
- رفتار پر مبنی زگ زگ
- رینبو اوسیلیٹر
- چاند لانچ الرٹس ٹیمپلیٹ [شاندار]
- کثیر متوازی کراس لائن متحرک تجارت کی حکمت عملی کو اپنانا
- سپر اسکیلپر
- سپر جمپ ٹرن بیک بولنگر بینڈ
- ای ایس ایس ایم اے
- مضبوط ای ایم اے / ڈبلیو ایم اے کراس حکمت عملی اور جامع اخراج کی شرائط
- سپر اسکیلپر - 5 منٹ 15 منٹ
- خرید/فروخت کے ساتھ EMA ADX RSI کا اسکیلپنگ
مزید معلومات
- تصور دوہری سپر ٹرینڈ
- سپر اسکیلپر
- بیک ٹسٹنگ- اشارے
- ٹرینڈیلیوس
- ایس ایم اے بی ٹی سی قاتل
- ایم ایل انتباہات کا نمونہ
- وقفے کے ساتھ فبونیکی ترقی
- RSI MTF Ob+Os
- Fukuiz Octa-EMA + Ichimoku
- سی سی آئی ایم ٹی ایف او بی + او
- OCC حکمت عملی R5.1
- بیئر مارکیٹ میں خوش آمدید
- سڈبوس
- پییوٹ پوائنٹس اعلی کم ملٹی ٹائم فریم
- گھوٹالہ رجحانات کی حکمت عملی کا ڈیٹا بیس
- گھوٹالہ رجحانات کی پیروی کرنے کی حکمت عملی
- گھوسٹ ٹرینڈ ٹریکنگ کی حکمت عملی
- رینبو اوسیلیٹر
- ایکویٹی وکر کی پوزیشن سائزنگ مثال کی تجارت
- KLineChart ڈیمو